The proliferation of smartphones: what is the market doing to attract the “late majority”?
- Transfer
 Seven years after the launch of the iPhone, the number of smartphone users in the United States reached 70% of the country's total population. Smartphones existed before the iPhone, so this category of products is clearly more than seven years old. However, given the number of current users, it can already be said that this is the fastest process of acceptance by the population of a new category of goods in history.
For the same seven years, the CD player reached coverage in 55% of the population, and the boombox - 62%. If we measure the period during which the penetration of smartphones in the United States increases from 9% to 90% [1], then its duration will be approximately 9 years, starting in 2008. Until 2008, the product was, for the most part, experimental, and the manufacturers participating in this experiment [2] basically failed. After a announced period of 9 years, the vast majority of products will become “publicly available and interchangeable,” while product profitability will begin to decline, and production consolidation around large vendors will increase.
The audience growth rate is even more impressive when one considers that penetration occurs at the individual level, rather than at the household level. Consequently, the total number of users is over 270 million, while usually consumer technologies target 115 million users [ this is an absolute indicator of consumer technology penetration among the US population - approx. transl.]. Thus, in the case of smartphones, almost 60% more purchases are made. It is also noteworthy that this product has a shorter life cycle (2 years), compared with other technological products for consumers [3].
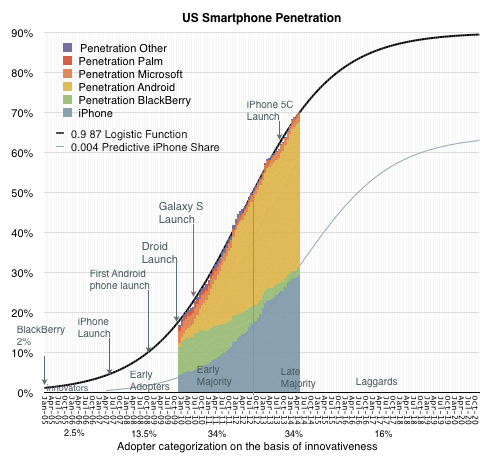
Given the above, the US smartphone market is now undergoing distribution among the “Late Majority” (conservatives). No wonder. The inflection point of the life cycle curve dates from mid-2012, which indicates that the market has been in the current phase for 2 years. It is possible that this period of growth retardation could last another 2 years.
According to Geoffrey Moore, approaches to selling goods should be chosen according to the current stage of market development. In the case of sales, innovators (the first 2.5% of users) should focus on the very novelty of the product. Early followers (the next 13.5%) are looking for exclusivity in the product and the opportunity to show their financial status in society. For the early majority (34%), recognition of the product by others is important, and the late majority (34%) needs to increase productivity when using the product. It is important for “skeptics” (the last 16% of users) to make a safe choice.
One of the misconceptions about the product adoption life cycle is related to the significance of its price. It is believed that the price of a product becomes more and more significant as society adopts the technology. In fact, the price is always high, so this value can be leveled. Pricing is only one of the components of marketing, and at any given time [on the market - approx. transl.] there are solutions in different ranges of the price spectrum. Pricing can also serve as a factor in deliberate confusion due to the possibility of a batch offering of products and, conversely, splitting decisions into several products.
An example is Apple’s attitude towards its products in the late stages of the life cycle. The products of this company are known for their well-established pricing.
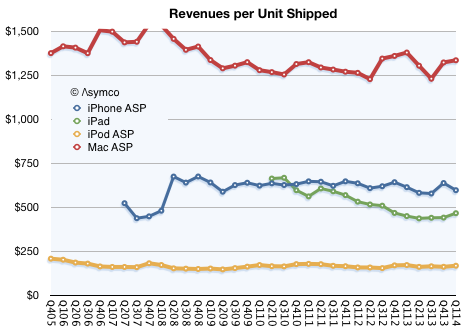
Sales revenue per unit of Mac, iPod, iPhone and iPad stubbornly remains stable. This does not mean that the devices are sold at a fixed price. The company is constantly changing the ratio of the number of products of medium, low and high class to keep the average retail price constant. Essentially, the averages remain unchanged, which in turn means that regardless of the current market stage, Apple's profitability remains unchanged.
So, if we look at the remaining 2 years of smartphone penetration, how will Apple do?
There is some indirect evidence that the company will do well. In search of any clues, I analyzed two data sets: the speed of replenishing the audience with new smartphone users (person / month) in relation to new iPhone or Android users.
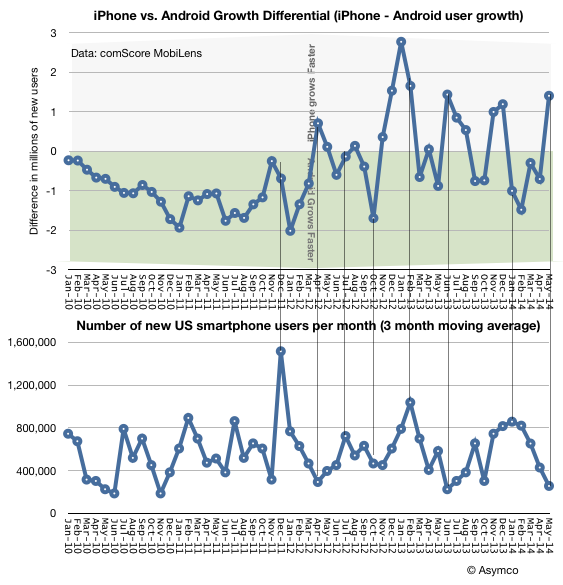
Note: The title of the second chart should be: “The number of new smartphone users in the US per week (in the context of approximately three months)”
I'm trying to find a connection between the speed of adoption of a product (smartphone) by the public and the speed of spread of the iPhone. When analyzing new smartphone users, I took into account the quantitative change in the user base (in the context of several weeks), and also used the choice of users in favor of the iPhone as a growth differential. [4] There is no noticeable correlation between the speed of product distribution and preferences in favor of a particular platform. However, with a more detailed analysis, one can notice an outbreak of an influx of new users, especially since 2012.
The numbers vary quite significantly: from ~ 300 thousand users per week, up to 1 million. Burst periods, during which there is an increase in the number of users, can be both the result of the launch of new products, and the result of shares of mobile operators. One way or another, deviations are observed in one direction or the other.
If we look at the corresponding schedule for adopting mobile platforms among users, the ratio will be as follows: the peak moments are chosen in favor of Android, and the troughs correspond to the choice in favor of the iPhone. This fact may seem quite logical: after the saturation level of the market has reached 50%, mobile operators “attract” the shares of the remaining potential consumers, who tend to buy cheaper products.
However, there is also something paradoxical in this data. Why, while the market is saturated, is the iPhone showing good results, although no one is forcing it to buy? Judging by the graph above, after exceeding the 70% threshold for adopting the technology, the number of new iPhone users, compared to Android, increased by 1.4 million.
Even if we look at the statistics of the past 6 months, we will see that the number of iPhone users from the late majority increased by 15.5 million, while Android users increased by 14.2 million. Will iPhone performance be even better if the number of promotions for the “latest conservatives” and “skeptics” drops?
The only thing that can be said is that cheapness is not the main engine of this market. I repeat, she was never him. Shortly before the emergence of the smartphone market, the most popular phone in the US was the RAZR. And it was a premium device.
Notes:
[1] I consider this growth period to be “economically attractive”
[2] Palm, BlackBerry, Nokia
[3] for example, compared to televisions, refrigerators, radios, etc.
[4] iPhone audience growth minus Android audience growth (in millions of users). Positive indicators indicate an increase in the speed of influx of new iPhone users. Negative indicators - about increasing the speed of influx of new Android users.