Traffic from social networks: the most modern methods of attracting, returning and analyzing
Traffic from social networks: never happens!
The share of social traffic at the top news websites of Runet is on average from 3% to 10% . There are rare exceptions to this pattern, for example, on the Dozhd website - 25% of social traffic; approximately at the same level indicators of youth media Look At Me, etc. under.). *
If we analyze the first page of Yandex ’s issuance by the “plastic windows” microwave request, then the share of social traffic is hardly different from zero. And this is typical of many competitive business-related resources. **
Or, for example, analyze the issuance of requests for “men's swimming trunks” ( RF request) and “men's swimming trunks- 2014 ” ( MF-LFrequest). At the first request, mostly large online stores (sometimes international) drop out. At the second request, large brands are interspersed with small businesses. In the second case, it is surprising that small business is "desperately fighting" for positions with unequal opponents, and at the same time makes almost no attempt to use social traffic at least 25-30% . Only in a couple of cases, small shops receive 3-9% of traffic from social networks, although even the topic of men's underwear is almost perfect for working with social networks.
The picture on the Western Internet is completely different. Here, commercial sites and services work much more closely with social sources, so the percentage of social visitors even on commercial resources is higher than in RuNet. Judging by the long-term tendency of equalization to the west, we should also strive for this.
How to attract social traffic?
Basic options:
- create and develop a group from scratch;
- buy a ready-made group with an already formed audience;
- create a group and promote it in the PS ( much faster and cheaper than promoting a site );
- work more actively with content marketing.
If we talk about specific recommendations on the time and frequency of posting, on the influence of a particular type of content, the influence of pictures in posts, on the form of polls and a host of other factors, we get the topic for a separate article. More precisely, for dozens of articles, because the behavior of users from social networks with different topics will be significantly different. You cannot give the same recommendations to the gynecological clinic and the IT service, gift shop and auto parts store. It is much more advisable to experiment and derive your own formulas.
How and why to analyze traffic for social behavior?
Suppose a site has managed to attract a powerful, stable stream of users from social networks. What's next? How to work with him? Answer: First of all, you need to analyze this traffic.
Let’s look at specific examples of what statistics can be obtained about engagement from social networks, and also consider the picture of social actions of users on sites in general.

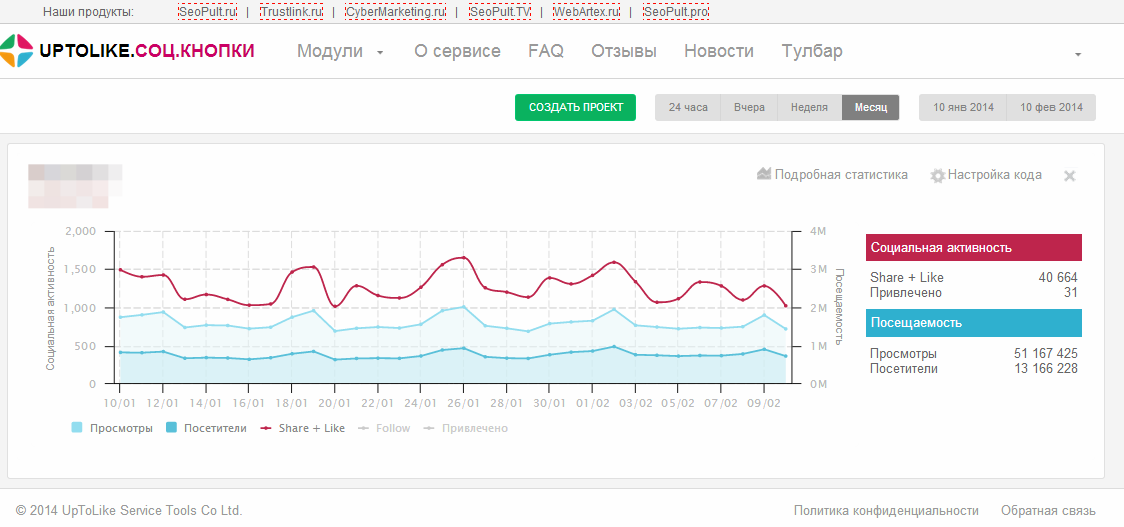
This is the site statistics for losing women taken from the UpToLike counter . In a month, about 3,000 social activities attracted more than 1,000 new users. This is a good example of the fact that sharing information in social networks directly works to attract new, loyal users.

In this screenshot you can see the paginated activity of the attracted users, as well as the breakdown by social networks where they came from. Obviously, the most attention of the female audience is attracted by all sorts of analyzers of calorie content of foods, recipes, calorie calculators. These are useful features that women want to share with each other, add pages to bookmarks.
This is an example from another site where the huge flow of social traffic is completely inactive. Perhaps in this case it is worth checking all the sources of attraction.
If you compare UpToLike statistics with statistics, such as Metrics or Analytics, then you can see that users attracted from social networks through likes and shares are more active and loyal to users attracted from other sources. They stay longer on the site, view more pages, more often “like” the materials that they get from the pages of social networks. Moreover, a person who goes to a page from a social network, in about every fifth case, returns to the site directly from a browser or from bookmarks, that is, there is a sound strengthening of the audience.
Interesting experience regarding social statistics is shared by Western colleagues . They describe an experiment with the new metrics “attention minutes” . Attention minutes - This is more than just a fixer of the amount of time spent by a person on a site. This is an indicator of enthusiasm for content (does the user launch a video on the page, does the mouse cursor move, etc.). It turns out that a user who is passionate about content for 25% attention minutes is more likely to put a shair than a user who is passionate about 100% . Users with 125% enthusiasm also have a high probability of shearing : such users make the most deliberate sheyrs, study the content entirely.

Perhaps from this experiment we can conclude that the virality is affected not so much by the quality of the text as by the design and content of the entire page: a person cheats the page, not so much by studying the text, as by sympathizing partly with the format, partly with layout and other elements of formatting and usability.
In RuNet, such studies can be carried out using the Webvisor in Yandex.Metrica and compare them with UpToLike data .
Does social traffic affect site ranking?
Suppose we analyzed the social traffic of the site, as well as the overall social behavior of users on the site. What to do with this data?
The most obvious answer is to expand the reach of content marketing. The statistics of UpToLike by itself clearly shows which social networks of your users are the most popular, what content they are attracted to, what content they most often share, etc. If you combine UpToLike data with analysis from Yandex and Google counters, you can get even finer statistics (non-obvious dependencies) and use them already for aerobatics content marketing.
A less obvious answer is to use this data to drive search traffic growth along with non-search social traffic.
For example here An experiment is described in which the effect of various social signals on the ranking of sites in the PS was investigated and the enormous influence of social networks on the growth of page positions by low request was revealed.
- 100 followers on Google+ gave an increase in positions by 14.63%
- 300 likes on Google+ generated 9.44% line item growth
- 70 shares and 50 likes on Facebook accounted for 6.9% position growth
- 50 tweets gave 2.88% position growth
Likes, sharers, comments, tweets, subscriptions, etc. active user actions work to strengthen the behavioral and social metrics of the site, the importance of which only the lazy did not say today. Due to the lively behavior of users from social networks, search engines understand that the resource gives people useful experience, which means that the site should be ranked higher.
This is an ideal website promotion scheme, absolutely honest with respect to search engines and users. The only problem is that users on social networks are not worried about all topics, especially commercial ones. Question: how else can you attract non-search traffic whose behavior will be comparable to hyperactivity of users who come from social networks? Answer: to attract the maximum target audience from other non-search sources. Actually, this is how classic RTB mechanisms work today.
- This material actually describes all the parties and all the possibilities of social traffic, and also provides statistics on the social behavior of users on the site. If you still don’t use at least one aspect of the described ones, you will undoubtedly receive some of the traffic, not only from social networks, but also from search results. The situation will quickly be rectified and significantly improved by working with analytics ( UpToLike , Metrica, Analytics) and content marketing.
* Data from similarweb
** Data from similarweb