Monitoring system of active network equipment of the federal network
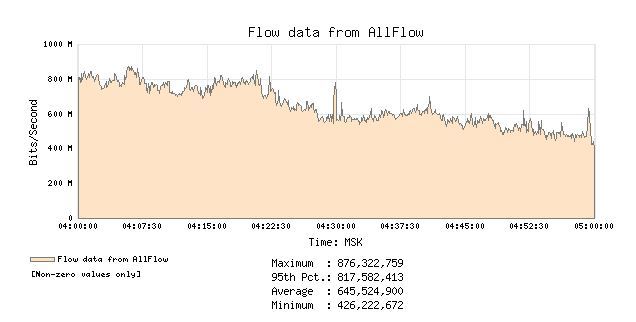
At the time of writing, I came to the conclusion that it is almost impossible to explain the entire technical part on this topic in one post, and maybe no one needs to. Therefore, I decided to make this post a review on my work. The purpose of the post is to show how without using additional company financing and asking for a couple of virtual servers, you can build an effective environment for monitoring the active equipment of a large network in a large company.
If you are interested in the topic of network monitoring or if you want to compare my work with yours, I invite you to cat.
In a small “home” network, the task of monitoring the network can be solved using any of the available free monitoring platforms. However, when it comes to a large enterprise with a large number of nodes, everything is not so transparent. And the main problem is the lack of physical resources and the lack of a system adapted to your requirements. The situation is slightly better with paid products, but paid systems rarely enter the business’s expenses for some kind of monitoring.
Control system
The skeleton of all monitoring will be a control system that allows the mouse to make changes, delete or add new nodes or links.
When developing the entire system as a whole, the following requirements were taken into account:
- Minimum configuration / reconfiguration on active equipment;
- Processing a large amount of traffic on netflow;
- The ability to examine in detail any network activity;
- Online update of incidents. Whether it’s a channel drop or a large channel load;
- Ability to modify modules or reports for all possible samples;
- Involve the minimum amount of infrastructure;
- As little as possible write the functionality yourself.
The infrastructure was tried different until the current configuration was reached. I will not describe all the tried options, so as not to stretch the post.
The bottom line is: Two virtual servers running CentOS 6.
One for the management and display system. 2 processors, 4GB RAM, 250GB disk.
The second acting as a netflow collector. 2 processors, 4GB RAM 150GB drive.
Server configuration is quite standard, apache web server with php + mysql .
Cactus
For the control system, Cactus was selected . What attracted the cactus:
- The lack of complex code in the WEB display (no flash, aciveX and other active components, which gives the advantage of using on mobile devices);
- Simple and clear database structure, to which you can easily bind your own functionality;
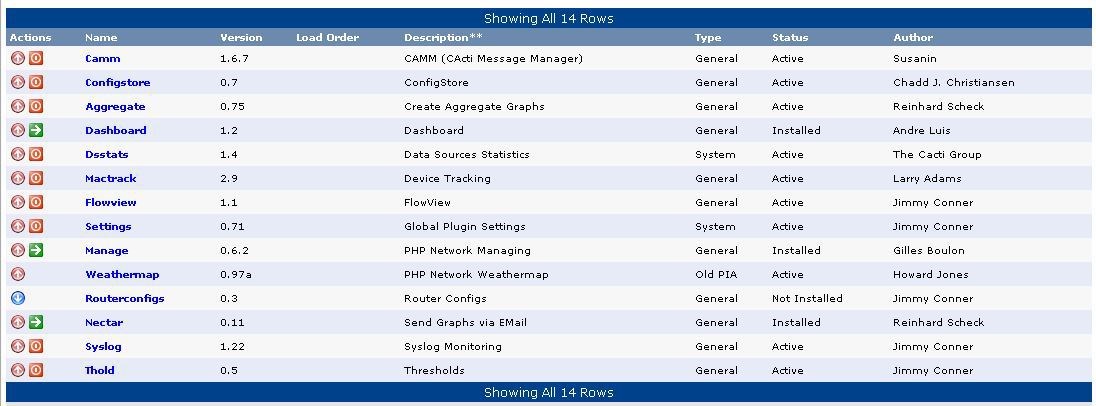
- Many plug-ins specifically for monitoring active equipment;
- Built-in SNMP support;
- RRDTool as a source for charts (hello zabbiksu);
- there is no client part.
Installation of Cactus is not any difficulty. There is a lot of information on this topic on the Internet, well, and the best, of course, is the official documentation .
Customization also does not require in-depth IT knowledge. On the Devices page, devices are added, the type of SNMP and authorization are indicated. Standard templates are bound.
Devices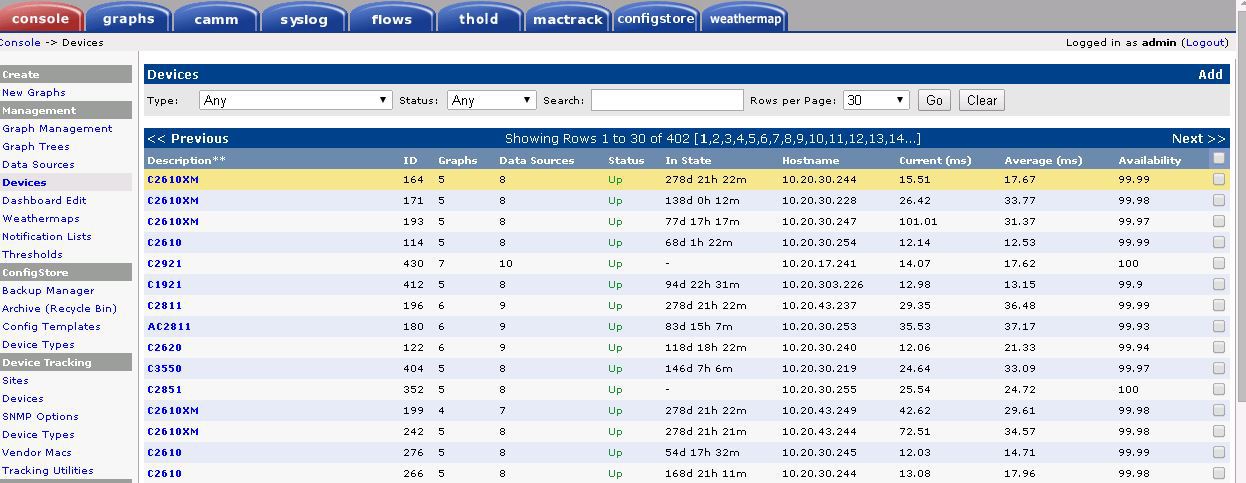
SNMP configuration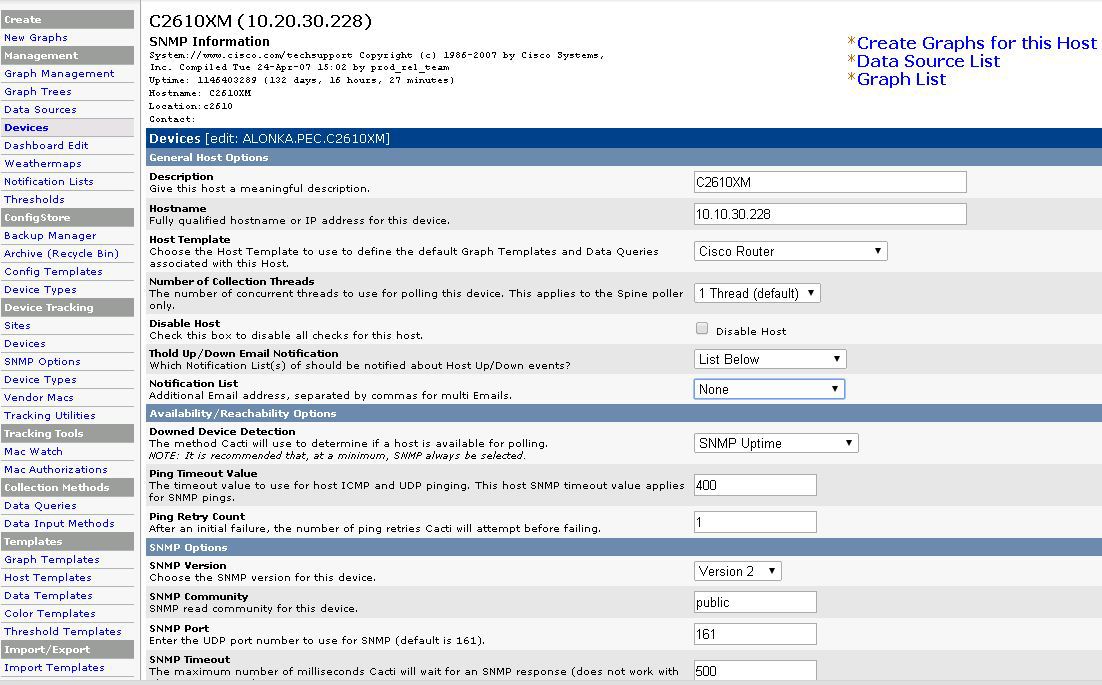
Patterns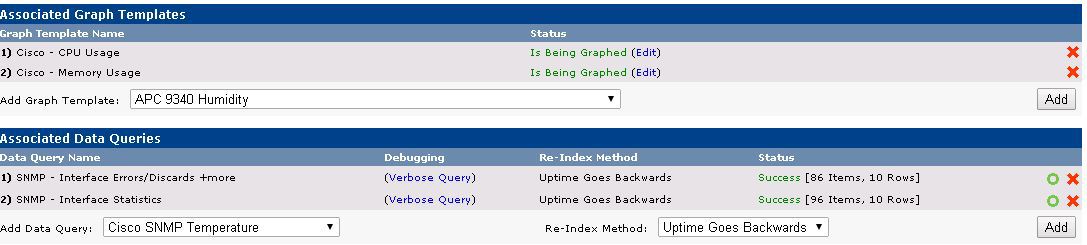
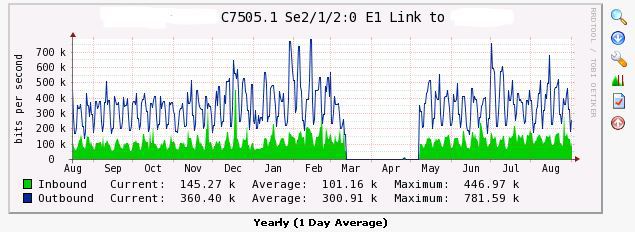
After polling a device with a cactus, it becomes possible to create a graph based on data from SNMP from a specific network interface or other sensor, whether it is the voltage in the network at the IPB or the processor load at the switch.
Choice of Charts
Cactus plugins for working with active equipment
Netflow
The main ideas are reports based on netflow streams. So, the first flowview plugin we need. A very simple plugin that allows you to graphically configure flow sources.
flowview config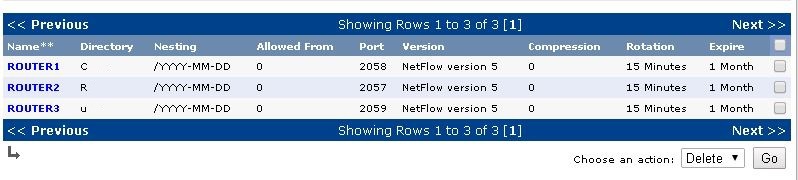
And also make selections based on flow streams and build automatic reports on a schedule.
flowview schedules
Syslog and traps
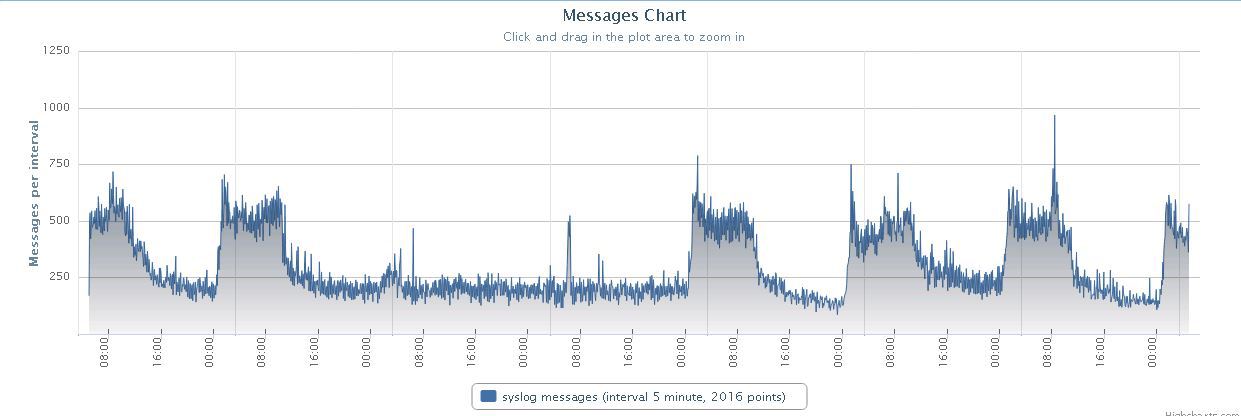
I used two plugins to collect and analyze traps and syslog with Cisco.
This is camm and syslog.
camm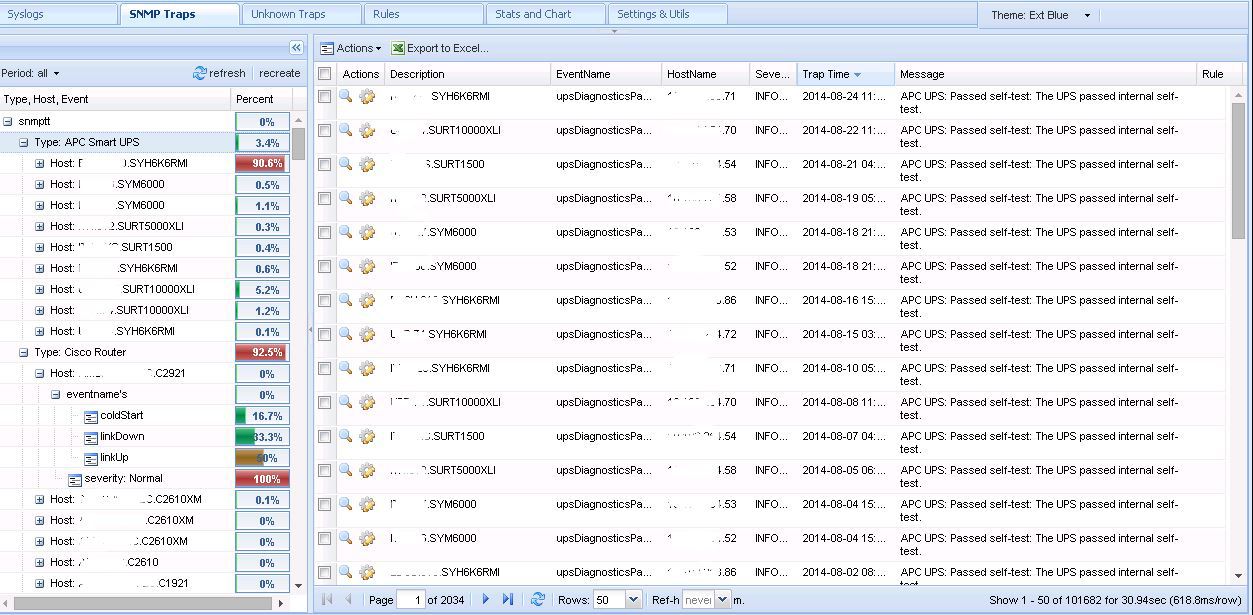
The first one impressed me with the filters and the ability to create rules for events (for example, I received messages about corporate events in corporate jabber).
camm rule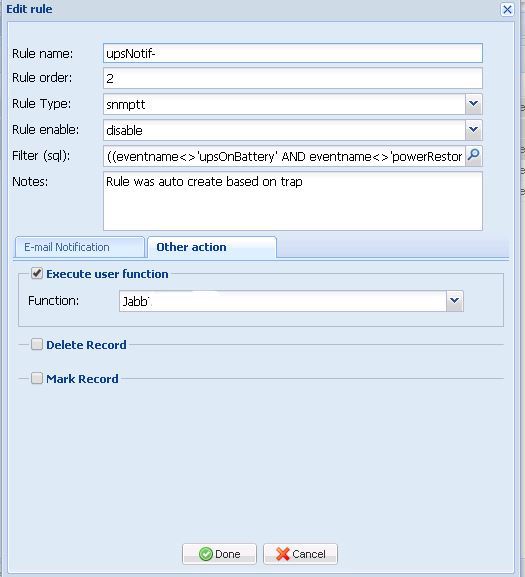
It is also a very convenient grouping based on the MIB and the database of the cactus itself.
camm group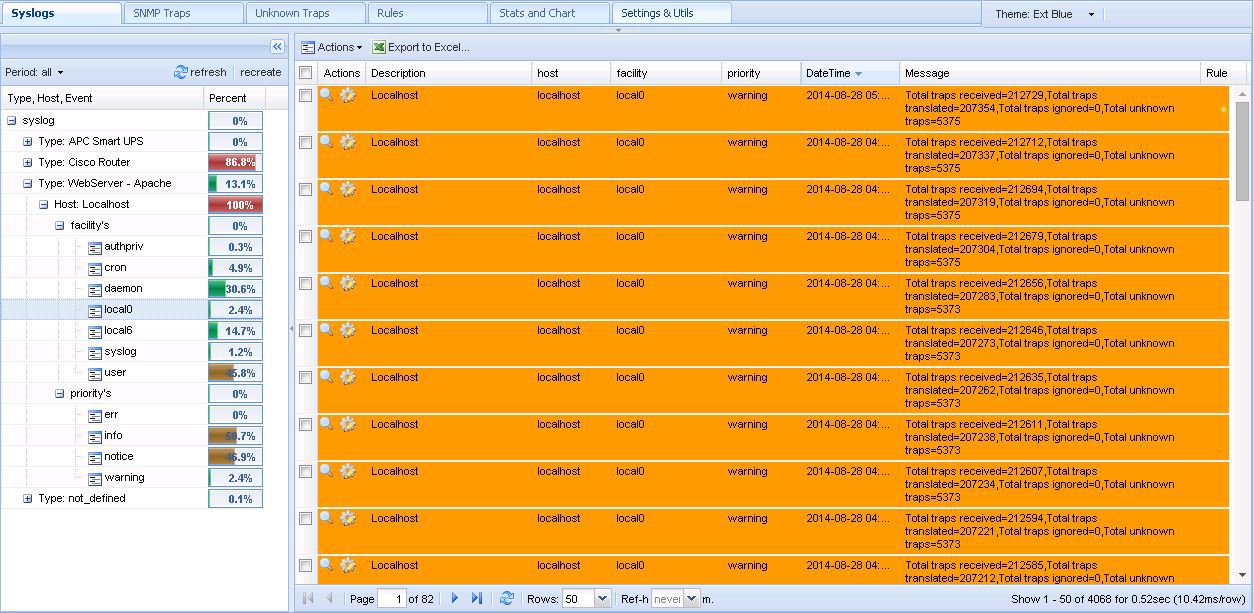
The second creates an autonomous database with a very transparent structure, to which I attached functionality written independently, but more on that later.
Network maps
Weathermap is the last plugin I use to monitor networks. He is beautiful and simple. The data is taken from the RRD databases of the cactus itself, and the editor is similar to Paint.
Channels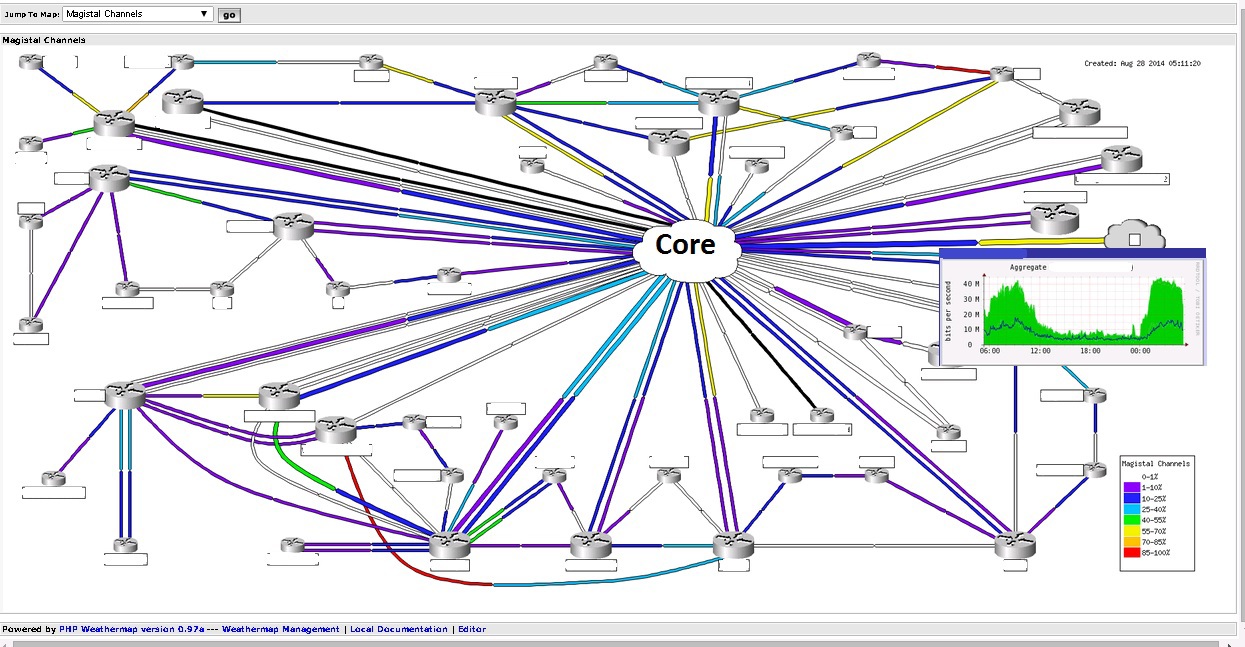
Allows you to graphically display the load of communication channels. So are the possible problems with the channel.
A piece of the weathermap configuration file.
Weathermap config example
NODE C7606.1
	LABEL C7606.1
	LABELOFFSET N
	INFOURL /cacti/graph.php?rra_id=all&local_graph_id=3691
	OVERLIBGRAPH /cacti/graph_image.php?rra_id=0&graph_nolegend=true&graph_height=100&graph_width=300&local_graph_id=3691
	ICON images/Router_PU2.png
	POSITION 1132 180
NODE C7609#1
	LABEL C7609#1
	LABELOFFSET N
	INFOURL /cacti/graph.php?rra_id=all&local_graph_id=3366
	OVERLIBGRAPH /cacti/graph_image.php?rra_id=0&graph_nolegend=true&graph_height=100&graph_width=300&local_graph_id=3366
	ICON images/Router_PU2.png
	POSITION 795 180
# regular LINKs:
LINK C7606.1-C7609#1
	INFOURL /cacti/graph.php?rra_id=all&local_graph_id=347
	OVERLIBGRAPH /cacti/graph_image.php?local_graph_id=347&rra_id=0&graph_nolegend=true&graph_height=100&graph_width=300
	TARGET /var/www/cacti/rra/c7606_1_traffic_in_403.rrd
	NODES C7606.1:N20 C7609#1:N50
	BANDWIDTH 40M
LINK C7606.2-C7609#2
	INFOURL /cacti/graph.php?rra_id=all&local_graph_id=340
	OVERLIBGRAPH /cacti/graph_image.php?local_graph_id=340&rra_id=0&graph_nolegend=true&graph_height=100&graph_width=300
	TARGET /var/www/cacti/rra/c7606_1_traffic_in_396.rrd
	NODES C7606.1:N10 C7609#1:N50
	BANDWIDTH 40M
NetFlow Setup
Flow-tools will be used as our software collector . This software can not only capture traffic, but also analyze it. Also on the basis of this package is written quite a few GUIs to display the collected information in human form. I was going to
manage the flow-capture component from the flowview cactus plugin , so after installing flow-tools , you need to copy the service launch script from the plugin folder to our init.d on the server.
What is all this fuss with the control system about? After all, is it easier to fix the config manually and score? But it was not there. The number of devices is about 500 pieces with a very large amount of traffic. If you add all flow to one folder, extracting data for one hour of traffic will take more than 2 hours, this is unacceptable.
It was decided to separate the streams from each device into a separate folder so that the selection takes place in a specific folder with the necessary traffic. By means of flow-capture this is done by spacing the streams from devices by ports. Does this mean that each device needs to be configured with a unique flow return port?
This is also unacceptable, so a simple small program samplicator comes to the rescue in solving this problem. The essence of the work is as follows: receives incoming UDP packets, sorts them by source address and translates them to the selected port. And this means that we do the standard equipment setup for one port, and already on the server itself we distribute the flows across the ports.
Config syntax: Source / Mask: Destination1 / Port [Destination2 / Port] and example:
samplicate.conf
10.20.0.0/255.255.0.0__/2056
10.20.30.252/255.255.255.252:10.20.0.108/2057 0/2057
10.20.30.4/255.255.255.252:10.20.0.108/2058 0/2058
10.20.30.160/255.255.255.255 : 10.20.0.108/2059 0/2059
10.20.30.252/255.255.255.252:10.20.0.108/2057 0/2057
10.20.30.4/255.255.255.252:10.20.0.108/2058 0/2058
10.20.30.160/255.255.255.255 : 10.20.0.108/2059 0/2059
Flow collected, with horror we watch the speed of filling our disks. How to view it all now?
There are many ways you can generate reports manually through the same flow-tools package . But not all users of the system can do this, and anyone who can, must sweat to write a human report.
I turned to another great FlowViewer project .
When I dug it up and started using it, there was version 3.3 or something like that of 2006. While I figured out with the 3rd version, the project unexpectedly came to life and began to develop, the 4th version was simply brilliant, compared to the 3rd. At the time of writing, the current version is 4.4 (I am using 4.1).
At its core, it almost duplicates the Cactus plugin flowview, but I liked the plug-in only with the available schedule, its selection work is unstable, the filters are not complete, and there is no necessary aggregation. And architecturally, the entire flow is stored on the second server, which means that FlowViever is happy to put on the second server and provides beautiful graphs and traffic samples.
flowviewer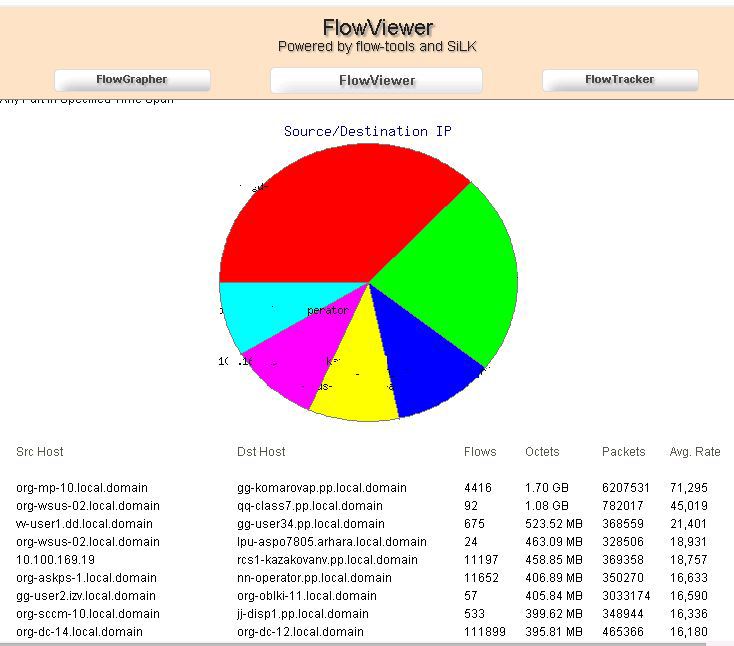
SNMP Traps
Streams with flow are very good and tempting, but it is impossible to use them to report problems. Only for analysis after fixing the problem.
Well, the most affordable way to alert is SNMP traps. Getting SNMP traps from 500 devices with one list is not a very pleasant thing, you will lose information that is important at the moment in the garbage. It’s clear that you need to do some kind of filter. There was no ready-made solution satisfying my requirements. But it doesn’t matter, remembering the craving for programming at the institute I decided to write a ladder analyzer myself.
The technology for obtaining a filtered list is as follows: when receiving a ladder, the monitoring server receives ( snmptrapd ) it, analyzes it ( snmptt ) in accordance with the loaded MIB specifications, and immediately puts it into the database.
snmptt.conf
mysql_dbi_enable = 1
mysql_dbi_host = localhost
mysql_dbi_port = 3306
mysql_dbi_database = cacti
mysql_dbi_table = plugin_camm_snmptt
mysql_dbi_table_unknown = plugin_camm_snmptt_unk
mysql_dbi_table_statistics = plugin_camm_snmptt_stat
mysql_dbi_username = cacti
mysql_dbi_password = cacti
mysql_ping_on_insert = 1
mysql_ping_interval = 300
mysql_dbi_host = localhost
mysql_dbi_port = 3306
mysql_dbi_database = cacti
mysql_dbi_table = plugin_camm_snmptt
mysql_dbi_table_unknown = plugin_camm_snmptt_unk
mysql_dbi_table_statistics = plugin_camm_snmptt_stat
mysql_dbi_username = cacti
mysql_dbi_password = cacti
mysql_ping_on_insert = 1
mysql_ping_interval = 300
It makes no sense to intercept this processing, because you have to start your own event stack somehow. We don’t need it, all the more the database into which the ladders get into is filled with information about the devices (names, ports, links), which Cactus collects itself using SNMP polling.
The option to take events from the base looks attractive, linking them to the existing base for information. Armed with a notebook, he began to come up with logic. There were no special problems with it, problems arose when fetching data from the database. Which started to take from 30 seconds. There was no talk about any efficiency here. The theory of database optimization, query optimization, indexes, plans, clever tips of my companion (an expert in super-large databases) did their job.

The main idea is to filter Up / Down ladders, in the description of which there are interface names (Eth, Serial, Gi, E), by identifiers and source we look for data in a table with SNMP. At the output, we get a beautiful line when , where and where the link fell.
MySQL Select: Channel Status
Select
MAX(sd.id),
sd.id_channel,
sd.`status`,
sd.diff,
MAX(sd.date) as 'date',
MIN(sd.date2) as 'date2',
SUM(UNIX_TIMESTAMP(sd.date)-UNIX_TIMESTAMP(sd.date2)) as 'time',
MAX(sd.id_trap) as 'id_trap',
`host`.description,
channel_list.ch_name
from (
SELECT
a.id,
a.id_channel,
a.`status`,
UNIX_TIMESTAMP(NOW())-UNIX_TIMESTAMP(a.date) as 'diff',
a.date,
(select
CASE cs2.`status`
WHEN a.`status` THEN null
ELSE cs2.`date`
END
from custom_status AS cs2
where cs2.id_channel = a.id_channel and cs2.date =
(select MAX(cs.date) from custom_status cs
where cs.date < a.date
and cs.id_channel = a.id_channel
) LIMIT 1 ) as 'date2',
a.id_trap
FROM
custom_status AS a
JOIN (SELECT t.id_channel,
MAX(t.date) AS max_date
FROM custom_status t
GROUP BY t.id_channel) AS b ON b.id_channel= a.id_channel) sd
INNER JOIN channel_list ON channel_list.id = sd.id_channel
INNER JOIN `host` ON channel_list.hostname = `host`.hostname
where sd.`status` = 'linkUp'
AND sd.date between DATE_SUB(CURDATE(),INTERVAL MOD(DAYOFWEEK(CURDATE())-2,7)+7 DAY) AND DATE_ADD(CURDATE(), INTERVAL MOD(7 - (DAYOFWEEK(CURDATE()) - 1), 7)-6 DAY)
GROUP BY sd.id_channel,sd.`status`
ORDER BY date desc"
All data from the database is made out in a readable form in the form of html pages.
Info from Traps
Samples from the database, receiving different conditions, form different report labels.
Detail info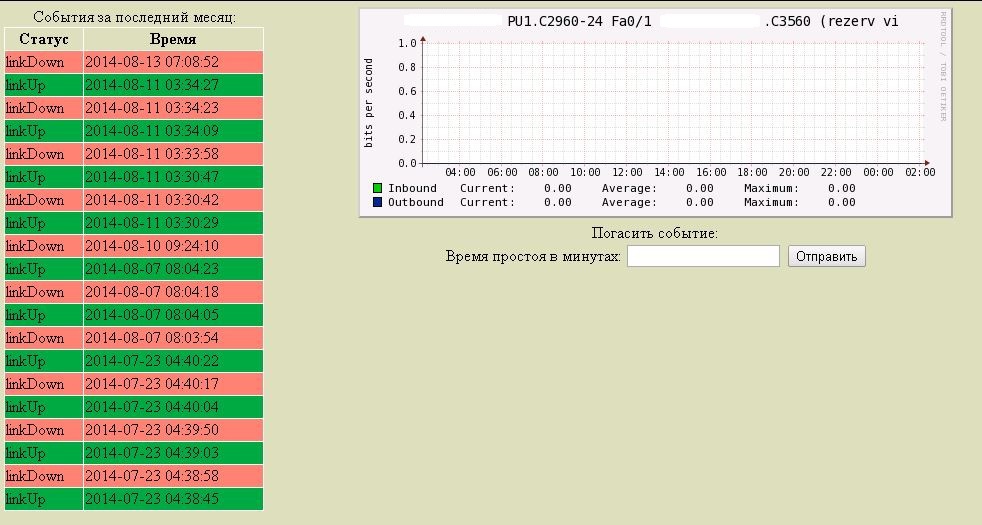
I thank the reader who mastered all my messy narration. Partly due to the fact that the system has been working without me for more than a year now. I forgot a lot, something lost its meaning. But monitoring still works, collects data and provides samples already without my support.
All data, screenshots and configs are depersonalized. Any coincidence is an accident.