A few benchmark tests of network frameworks
Hi Habr! A couple of months ago, I wanted to test the performance of some network frameworks in order to understand how big the gap between them is. Do I need to use Node.js where I would like Python with Gevent or need Ruby with its EventMachine.
I want to draw your attention to the fact that these materials are not a guide to choosing a framework and may contain contentious points. I was not going to publish the results of this study at all, but when they caught my eye I caught myself thinking that this could be useful to someone. Now I will start to shower you with graphs.
The first test I conducted on the cheapest VPS DigitalOcean (1 Core, 512Mb RAM, 20Gb SSD). For performance testing, the httperf utility was used . In order to produce the necessary load, VPS of the same configuration were involved, in the amount of 5 pieces. To run the test on all clients at the same time, I used the autobench utility with the following parameters:
This test starts at 50 connections per second (10 requests through one connection) and reaches 600 connections in 10 connections per second. Each test establishes a total of 6000 connections and all requests that were not processed within 5 seconds are considered an error.
All HTTP servers do the same thing, namely they return the string “I am a stupid HTTP server!” For each request. The results were as follows ( along the X axis - the number of requests per second ):


As soon as we reach 100% CPU utilization, RAM consumption begins to increase, the number of responses drops, the response time for each request grows and errors begin to appear. As I wrote above, each request that did not receive a response within 5 seconds is considered an error, and this is exactly what happens here, this can be traced on the “Response Time” graph.
Results (in brackets the number of processed requests without errors):
I am never completely satisfied with my work, so after a couple of hours I decided that testing performance on VPS was not the best choice. Between the frameworks, the difference in performance is understandable and some conclusions can be drawn, but we can’t find out how many clients we can service on the same core of a real processor. It is one thing to share unknown resources with someone and quite another when all the resources are known and at our disposal.
For the next test, I rented a dedicated server from Hetzner (EX40) with an Intel Core i7-4770 Quad-Core Haswell processor and 32 GB DDR3 RAM.
This time, I created 10 VPS that will create the necessary load and launched autobench with the following parameters:
This test starts execution with 50 connections per second (10 requests through one connection) and with a step of 50 connections per second reaches 1500. Each test sets only 15,000 connections and all requests that were not processed within 5 seconds are considered an error.
The source code of the servers is the same as in the first test. One copy of the server has been launched, which uses only 1 core. I added Twisted 13.2 and Eventmachine frameworks to this test .1.0.3. I deleted the memory consumption from the test results because the difference, by modern standards, is negligible. I will not pull the cat by the tail, here are the results:

Here, as before, they ran into the CPU, which was to be expected. On average, productivity here is 3 times higher than on VPS DigitalOcean (1 Core, 512Mb), from which we can draw the appropriate conclusions about the amount of resources allocated to us.
Results (in brackets the number of processed requests without errors):
Eventmachine surprised me with its performance and went far from competitors, because of which I had to increase the load to 25,000 requests per second specifically for him. The result on the graphs:

I have suspicions that he could handle 30,000 requests, but I had to move on, so I could not verify this. In general, by this time I already knew that I would use Python for my project, so I needed frameworks in other languages just for comparison.
As I wrote above, I am not completely satisfied with my work, so I went to bed with a sense of accomplishment, and woke up with the thought “I need more tests!”. Giving a line of text to each request is certainly good, but this is not the only function of the web server, so we will distribute the files.
For this test, I used 10 VPS to create the necessary load. Experimentally, I found that on 1 VPS DigitalOcean, on average, a 100Mbps channel is allocated. I had a server with a 1Gbps channel and I had to fully load it. The files for distribution were images from an online store in the amount of 10,000 pieces, of different sizes. To create the load, I used the siege utility with the following parameters:
A list of files is stored in filelist.txt, 55 connections are established and through them we begin to hammer the server with requests within 1 minute. Files are randomly selected from the fileslist.txt list. It is definitely worth considering that this test runs on 10 machines at the same time, which means that we are installing not 550, but 550 simultaneous connections. Moreover, I constantly changed this option from 5 to 55 in increments of 5, thereby increasing the load on the server, and establishing from 50 to 550 simultaneous connections.
Here's what we get ( along the X axis - the number of simultaneous connections ):

In this test, I added RAM consumption as well as the nginx web server for comparison. Here the bottleneck is the communication channel, and the 1st core is enough to load this entire channel in 1Gbps.
Results (in brackets the number of processed requests without errors):
This could be the end of the article, but I wanted to use MongoDB GridFS in my project, so I decided to see how performance would change with its use. This test is similar to the 3rd one, except that I uploaded all the images in the amount of 10,000 in MongoDB and rewrote the web servers so that they would distribute files from the database. So what do we get:


During the test, Gevent had answers with errors, so I added a graph “Number of errors”. In general, GridFS can be used, but it should be borne in mind that the database itself creates a considerable load on the CPU, and I had 7 free cores at its disposal, when everything is much simpler with the file system.
Results (in brackets the number of processed requests without errors):
Seriously, it all depends on the conditions under which your project will work. You can conduct a huge number of tests, but when the service is written, everything will most likely be completely different. For example, if you increase the number of pictures from 10,000 to 1,000,000, the performance of the hard drive, rather than the communication channel, becomes a bottleneck.
If you decide to conduct your own testing or study mine in more detail, then this list should help you.
Full reports with individual charts and numbers can be downloaded at these links:
In my tests, I used:
The tests involved:
Thank you all for your attention.
Follow me on Twitter , I talk about working in a startup, my mistakes and the right decisions, about python and everything related to web development.
PS I'm looking for developers in the company, the details are in my profile .
1. Text / Httperf / VPS 1 CPU, 512Mb RAM
The first test I conducted on the cheapest VPS DigitalOcean (1 Core, 512Mb RAM, 20Gb SSD). For performance testing, the httperf utility was used . In order to produce the necessary load, VPS of the same configuration were involved, in the amount of 5 pieces. To run the test on all clients at the same time, I used the autobench utility with the following parameters:
autobench_admin --single_host --host1 example.com --port1 8080 --uri1 / --low_rate 50 --high_rate 600 --rate_step 10 --num_call 10 --num_conn 6000 --timeout 5 --clients XX.XX.XX.XX:4600,XX.XX.XX.XX:4600,XX.XX.XX.XX:4600,XX.XX.XX.XX:4600,XX.XX.XX.XX:4600 --file bench.tsvThis test starts at 50 connections per second (10 requests through one connection) and reaches 600 connections in 10 connections per second. Each test establishes a total of 6000 connections and all requests that were not processed within 5 seconds are considered an error.
All HTTP servers do the same thing, namely they return the string “I am a stupid HTTP server!” For each request. The results were as follows ( along the X axis - the number of requests per second ):
CPU load
RAM consumption (% of 512Mb)
Number of replies
Response Time (in milliseconds)
Number of mistakes
As soon as we reach 100% CPU utilization, RAM consumption begins to increase, the number of responses drops, the response time for each request grows and errors begin to appear. As I wrote above, each request that did not receive a response within 5 seconds is considered an error, and this is exactly what happens here, this can be traced on the “Response Time” graph.
Results (in brackets the number of processed requests without errors):
- Gevent ( 4700 )
- Express.js ( 3600 )
- Eventlet ( 3200 )
- Tornado ( 2200 )
I am never completely satisfied with my work, so after a couple of hours I decided that testing performance on VPS was not the best choice. Between the frameworks, the difference in performance is understandable and some conclusions can be drawn, but we can’t find out how many clients we can service on the same core of a real processor. It is one thing to share unknown resources with someone and quite another when all the resources are known and at our disposal.
2.Text / Httperf / Intel Core i7-4770 Quad-Core Haswell, 32 GB DDR3 RAM
For the next test, I rented a dedicated server from Hetzner (EX40) with an Intel Core i7-4770 Quad-Core Haswell processor and 32 GB DDR3 RAM.
This time, I created 10 VPS that will create the necessary load and launched autobench with the following parameters:
autobench_admin --single_host --host1 example.com --port1 8080 --uri1 / --low_rate 50 --high_rate 1500 --rate_step 50 --num_call 10 --num_conn 15000 --timeout 5 --clients XX.XX.XX.XX:4600,XX.XX.XX.XX:4600,XX.XX.XX.XX:4600,XX.XX.XX.XX:4600,XX.XX.XX.XX:4600 ... --file bench.tsvThis test starts execution with 50 connections per second (10 requests through one connection) and with a step of 50 connections per second reaches 1500. Each test sets only 15,000 connections and all requests that were not processed within 5 seconds are considered an error.
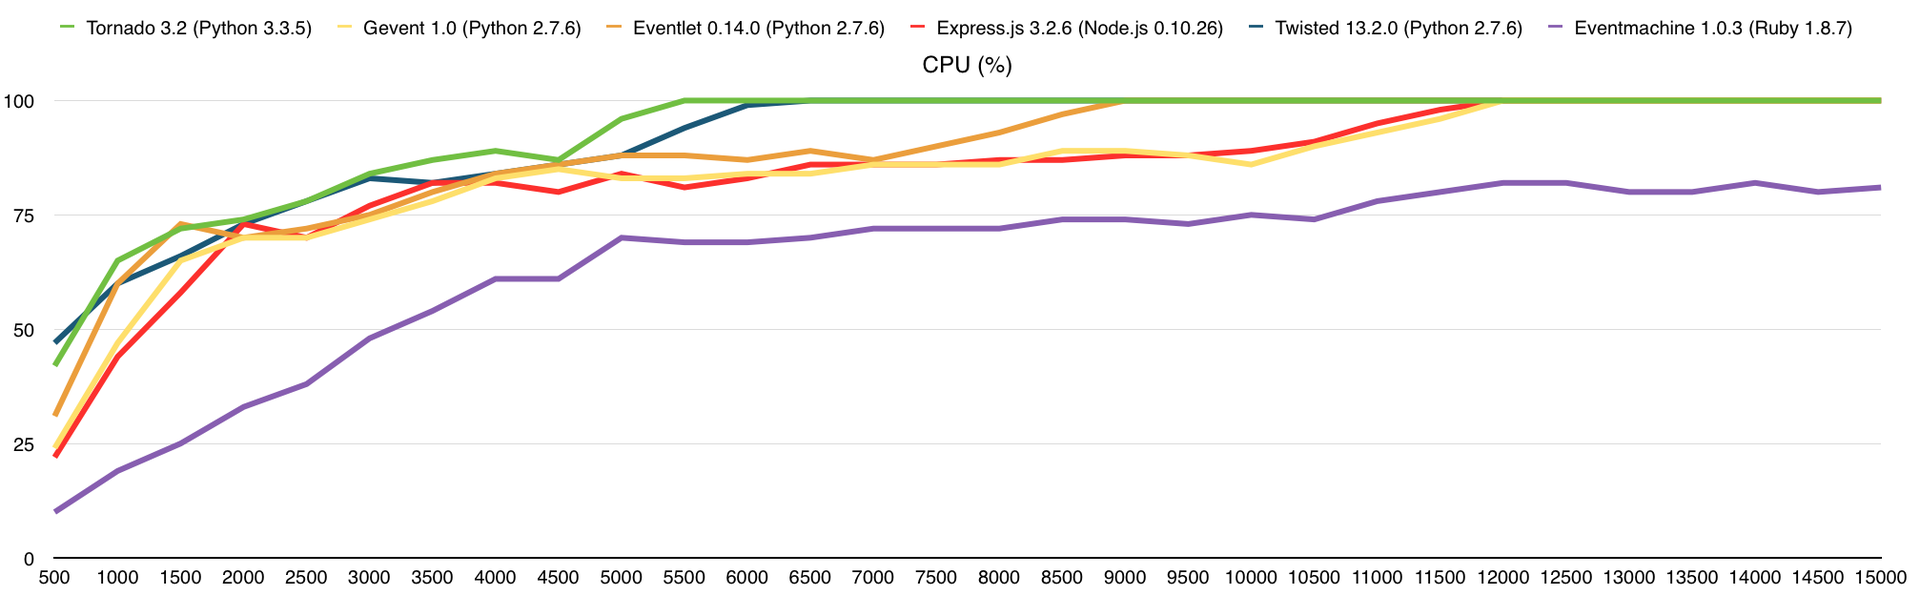
The source code of the servers is the same as in the first test. One copy of the server has been launched, which uses only 1 core. I added Twisted 13.2 and Eventmachine frameworks to this test .1.0.3. I deleted the memory consumption from the test results because the difference, by modern standards, is negligible. I will not pull the cat by the tail, here are the results:
CPU load
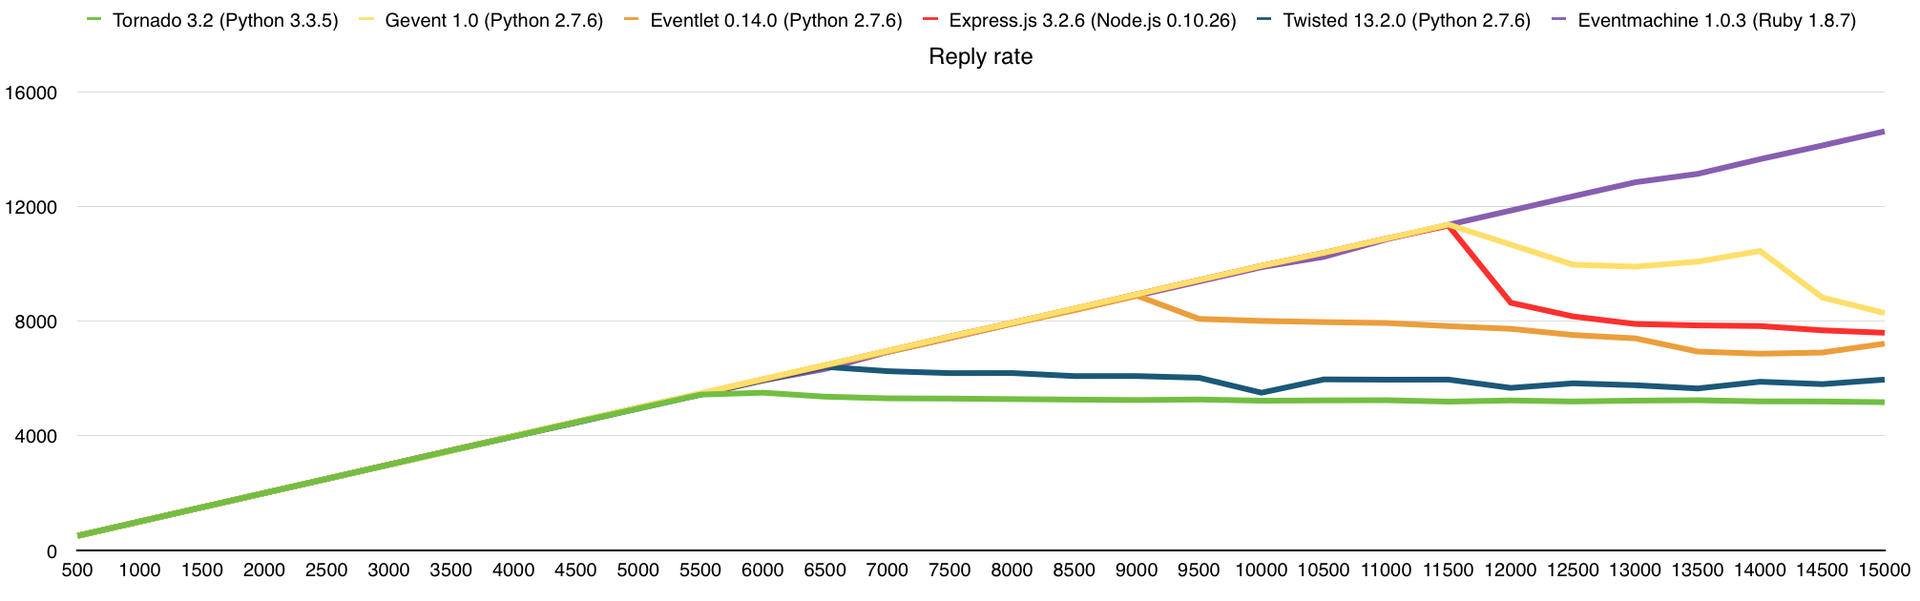
Number of replies
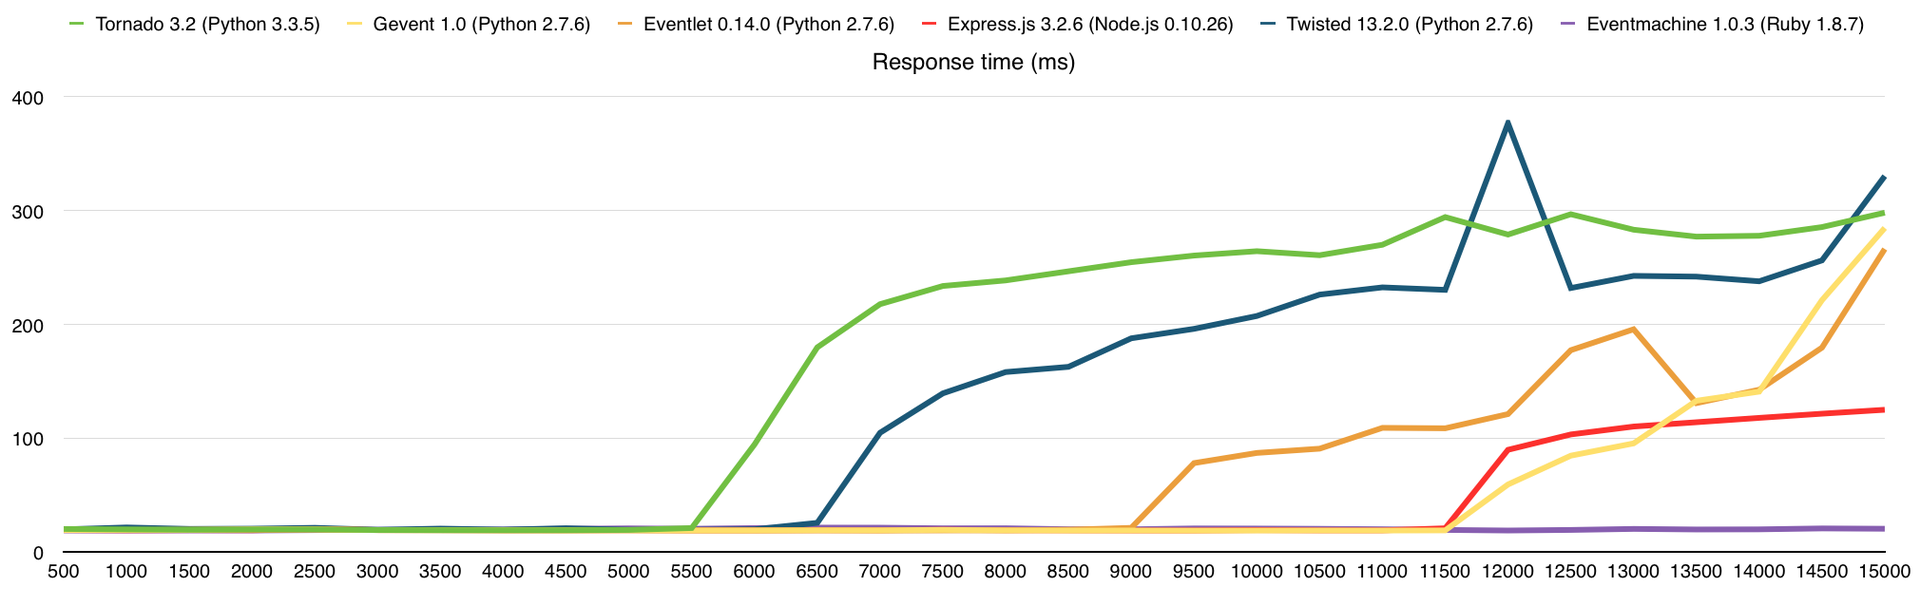
Response Time (in milliseconds)
Number of mistakes
Here, as before, they ran into the CPU, which was to be expected. On average, productivity here is 3 times higher than on VPS DigitalOcean (1 Core, 512Mb), from which we can draw the appropriate conclusions about the amount of resources allocated to us.
Results (in brackets the number of processed requests without errors):
- Eventmachine ( details below )
- Gevent ( 12500 )
- Express.js ( 11500 )
- Eventlet ( 9000 )
- Twisted ( 7000 )
- Tornado ( 6500 )
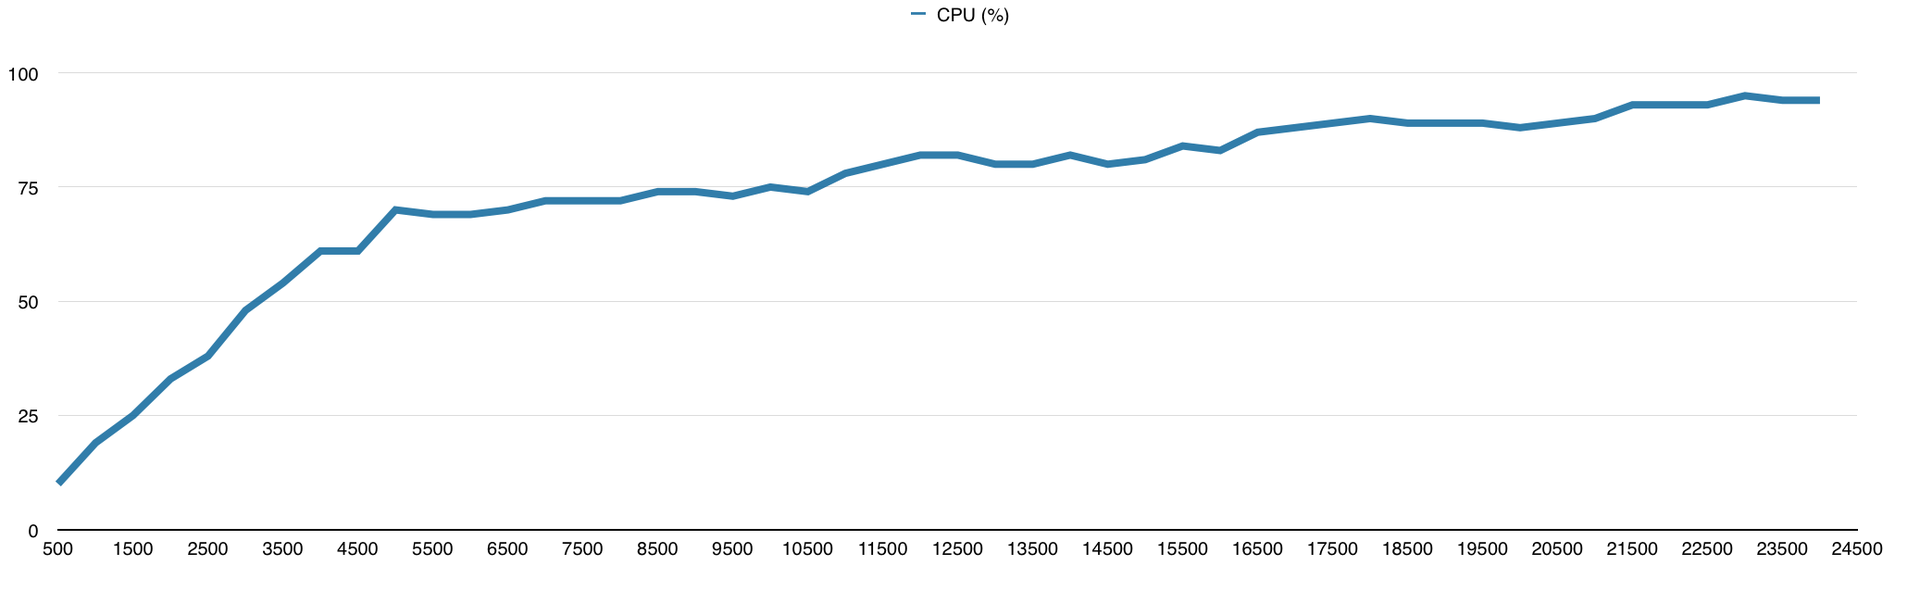
Eventmachine
Eventmachine surprised me with its performance and went far from competitors, because of which I had to increase the load to 25,000 requests per second specifically for him. The result on the graphs:
CPU load
Number of replies
Response Time (in milliseconds)
Number of mistakes
I have suspicions that he could handle 30,000 requests, but I had to move on, so I could not verify this. In general, by this time I already knew that I would use Python for my project, so I needed frameworks in other languages just for comparison.
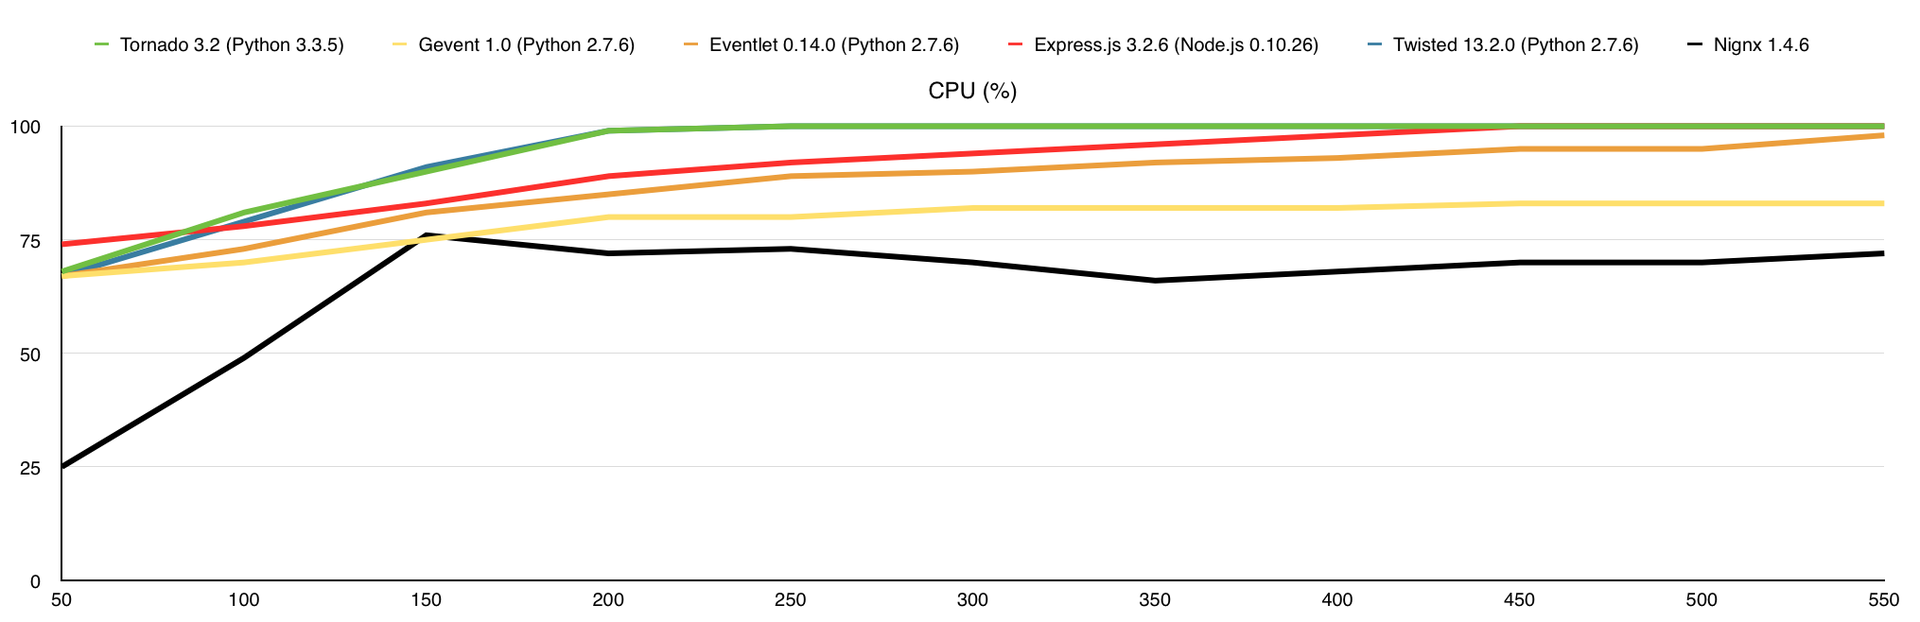
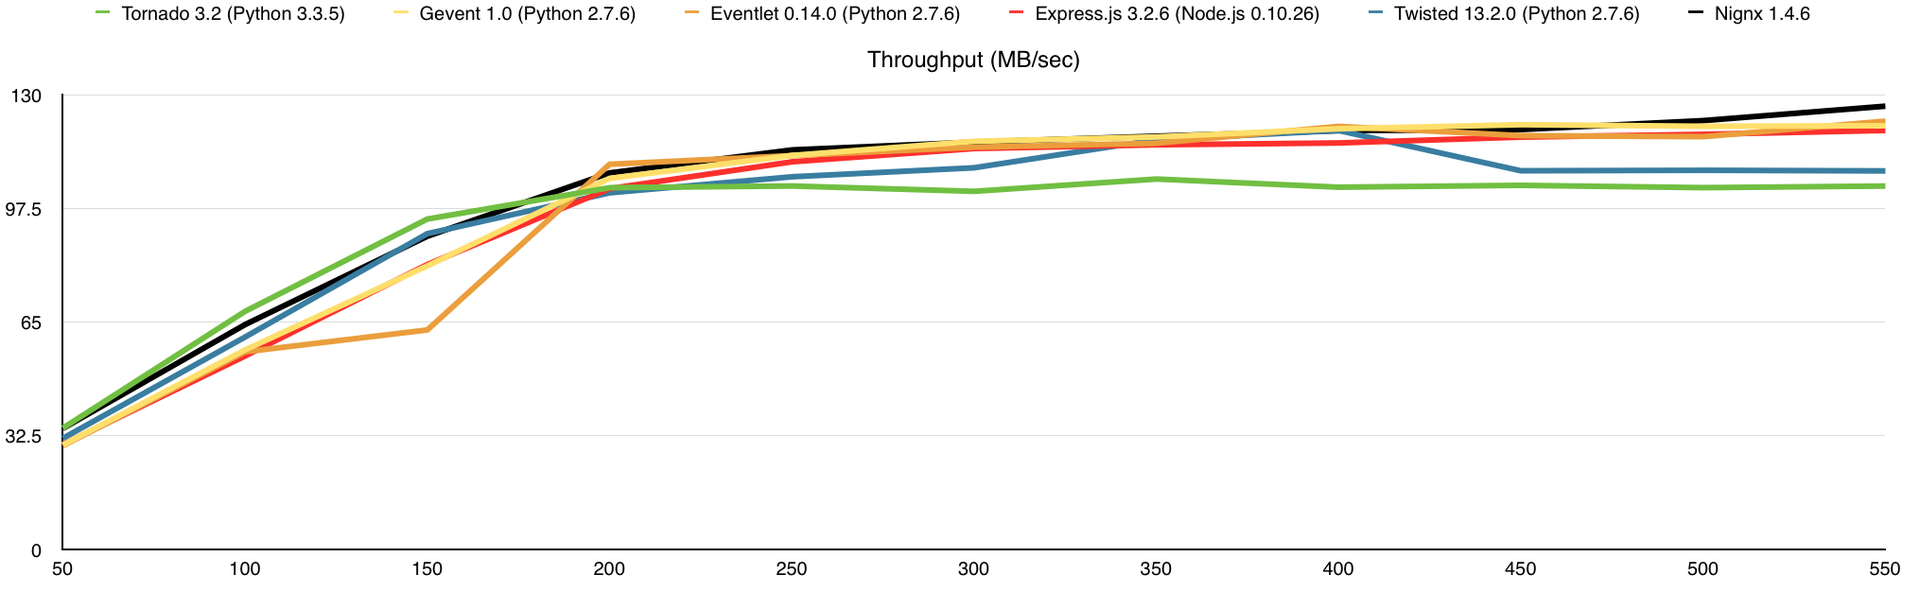
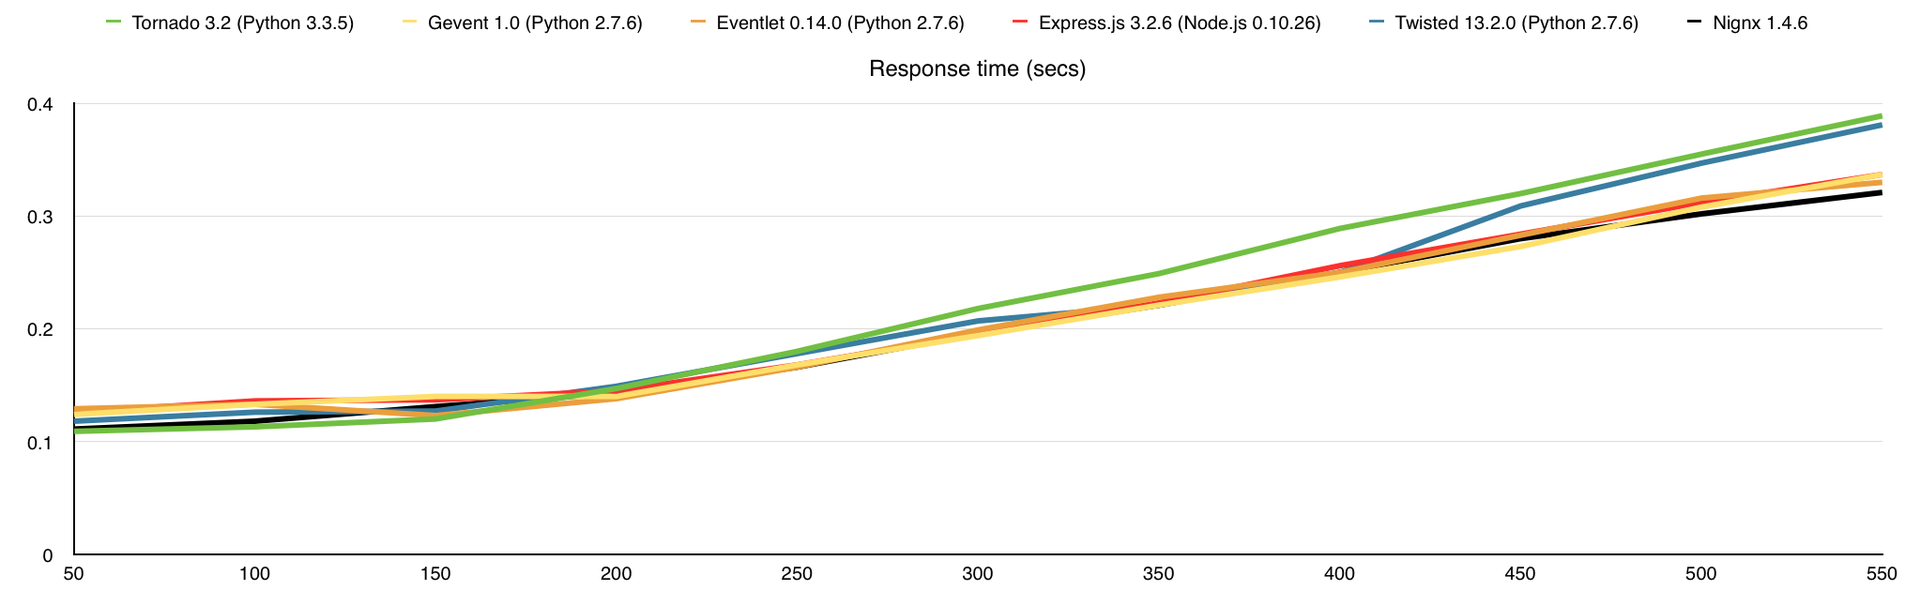
3. Files / Siege / Intel Core i7-4770 Quad-Core Haswell, 32 GB DDR3 RAM
As I wrote above, I am not completely satisfied with my work, so I went to bed with a sense of accomplishment, and woke up with the thought “I need more tests!”. Giving a line of text to each request is certainly good, but this is not the only function of the web server, so we will distribute the files.
For this test, I used 10 VPS to create the necessary load. Experimentally, I found that on 1 VPS DigitalOcean, on average, a 100Mbps channel is allocated. I had a server with a 1Gbps channel and I had to fully load it. The files for distribution were images from an online store in the amount of 10,000 pieces, of different sizes. To create the load, I used the siege utility with the following parameters:
siege -i -f fileslist.txt -c 55 -b -t1MA list of files is stored in filelist.txt, 55 connections are established and through them we begin to hammer the server with requests within 1 minute. Files are randomly selected from the fileslist.txt list. It is definitely worth considering that this test runs on 10 machines at the same time, which means that we are installing not 550, but 550 simultaneous connections. Moreover, I constantly changed this option from 5 to 55 in increments of 5, thereby increasing the load on the server, and establishing from 50 to 550 simultaneous connections.
Here's what we get ( along the X axis - the number of simultaneous connections ):
Number of completed requests
The number of processed requests per second
CPU load (%)
RAM consumption (% of 32Gb)
Communication channel load (megabytes per second)
Average request response time (in seconds)
In this test, I added RAM consumption as well as the nginx web server for comparison. Here the bottleneck is the communication channel, and the 1st core is enough to load this entire channel in 1Gbps.
Results (in brackets the number of processed requests without errors):
- Nignx ( 100175 )
- Eventlet ( 97925 )
- Gevent ( 96918 )
- Express.js ( 96162 )
- Twisted ( 85733 )
- Tornado ( 83241 )
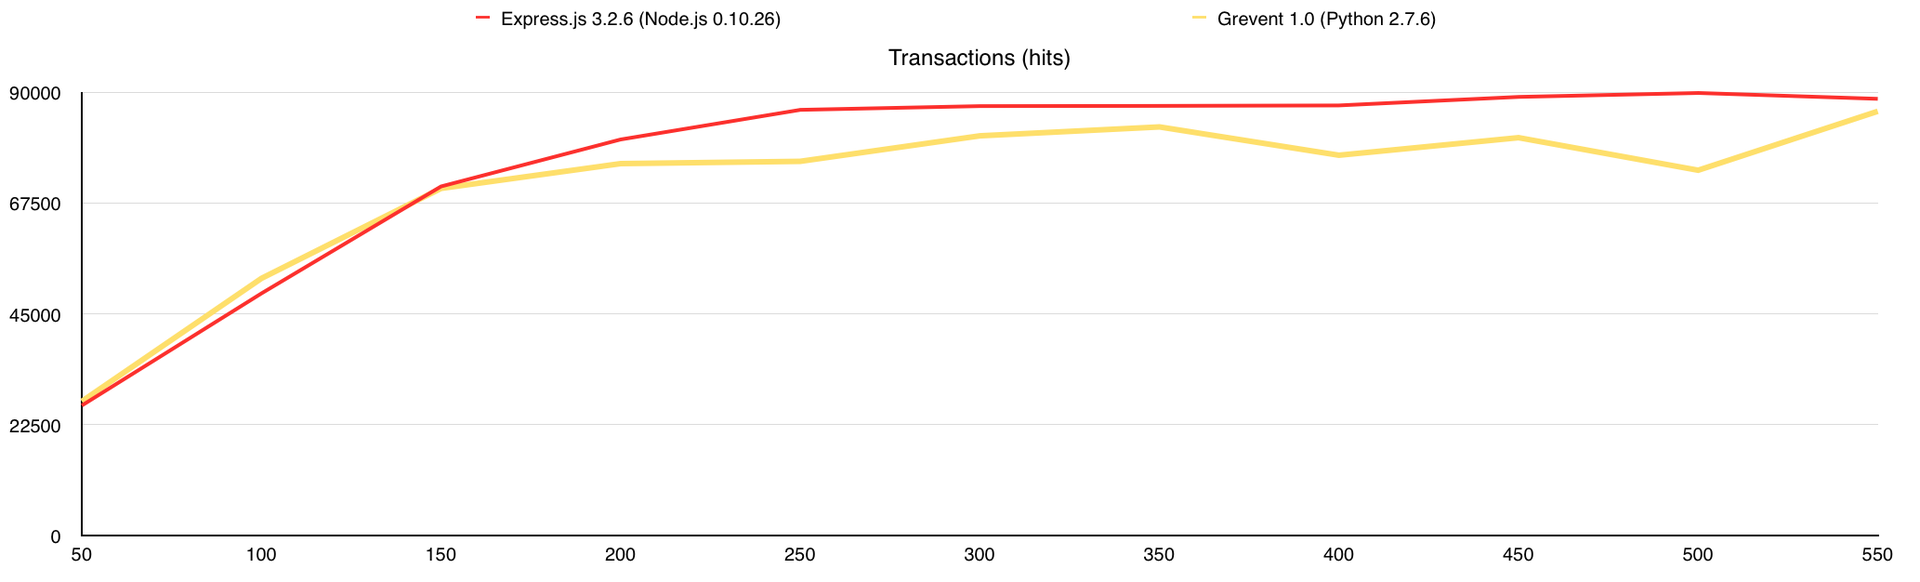
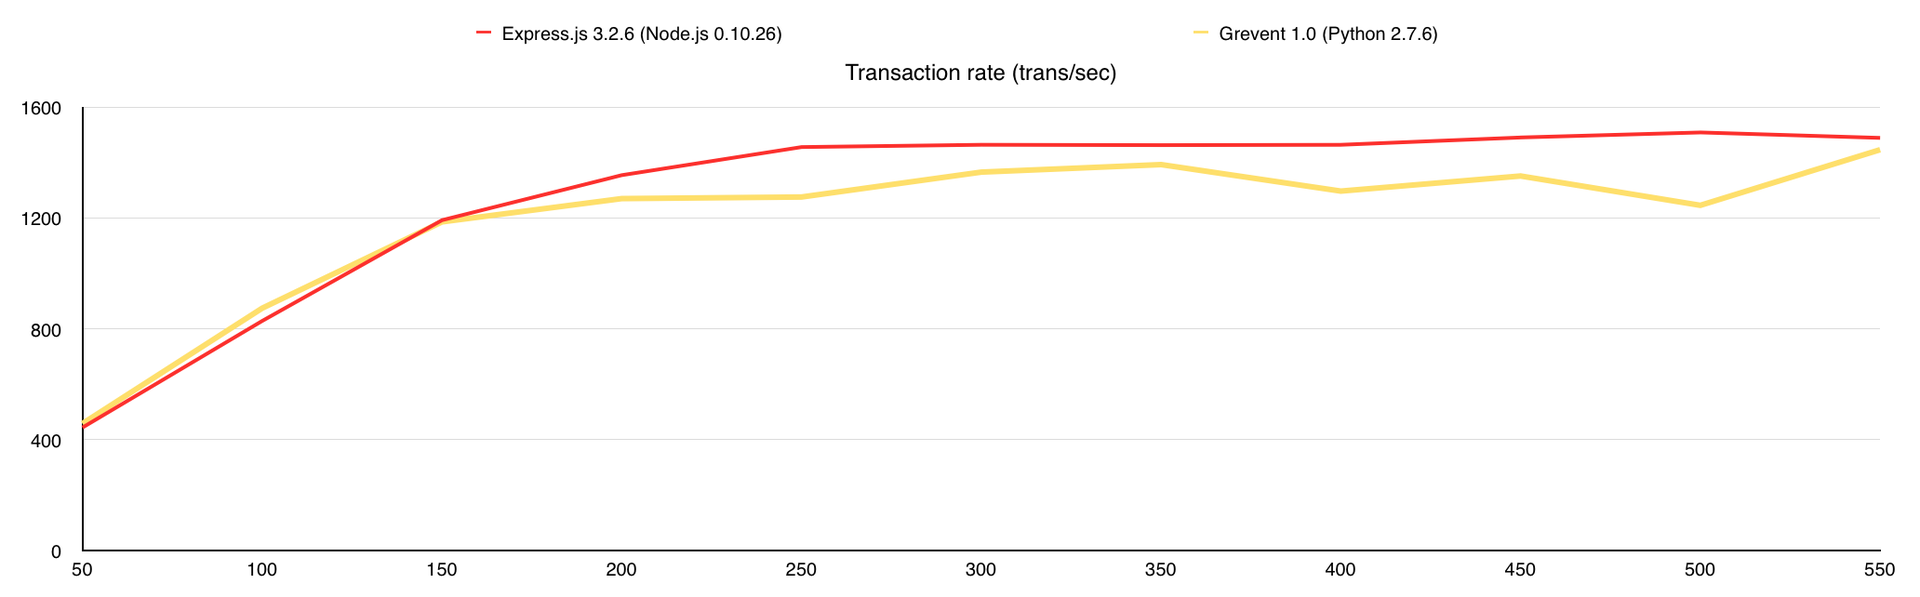
4. GridFS / Siege / Intel Core i7-4770 Quad-Core Haswell, 32 GB DDR3 RAM
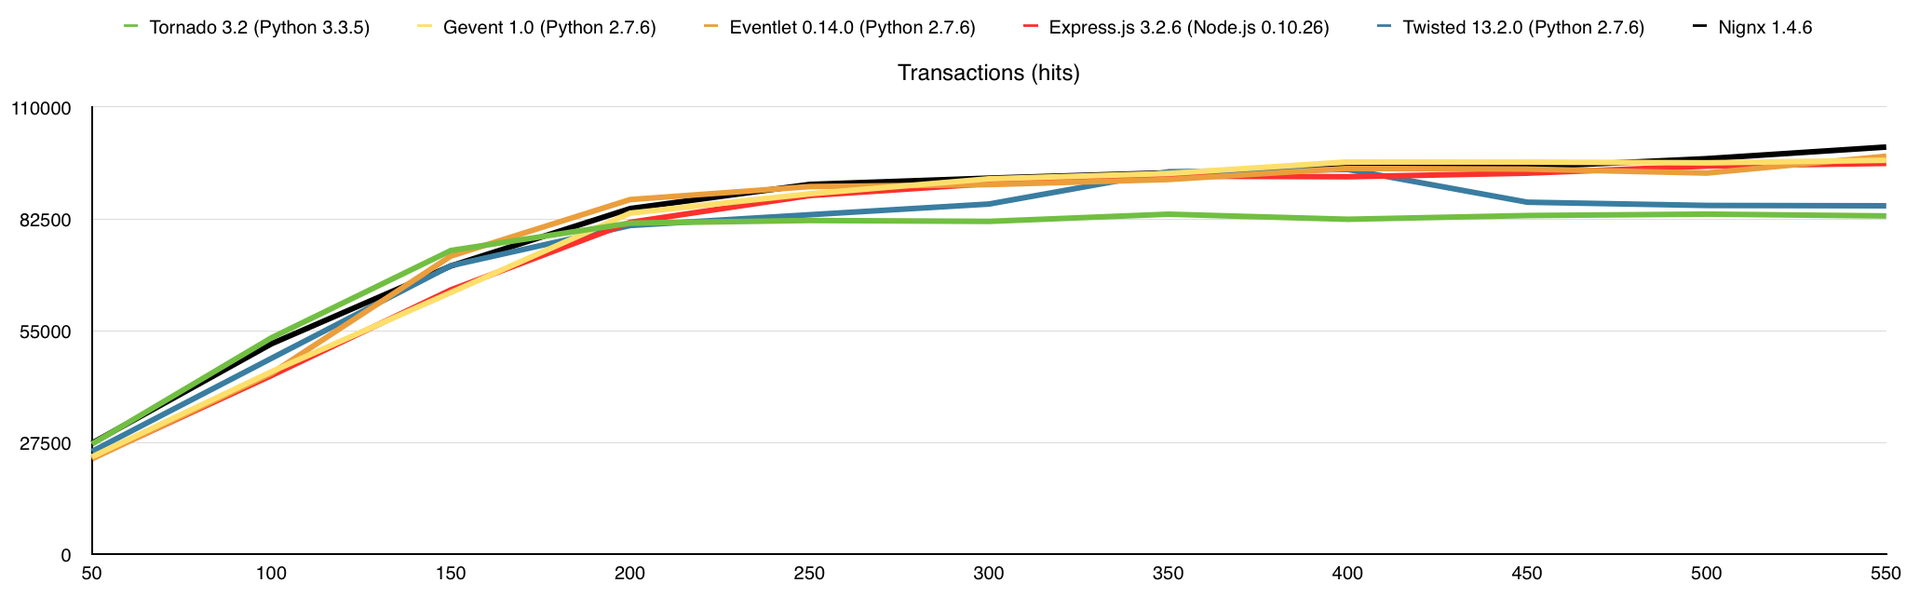
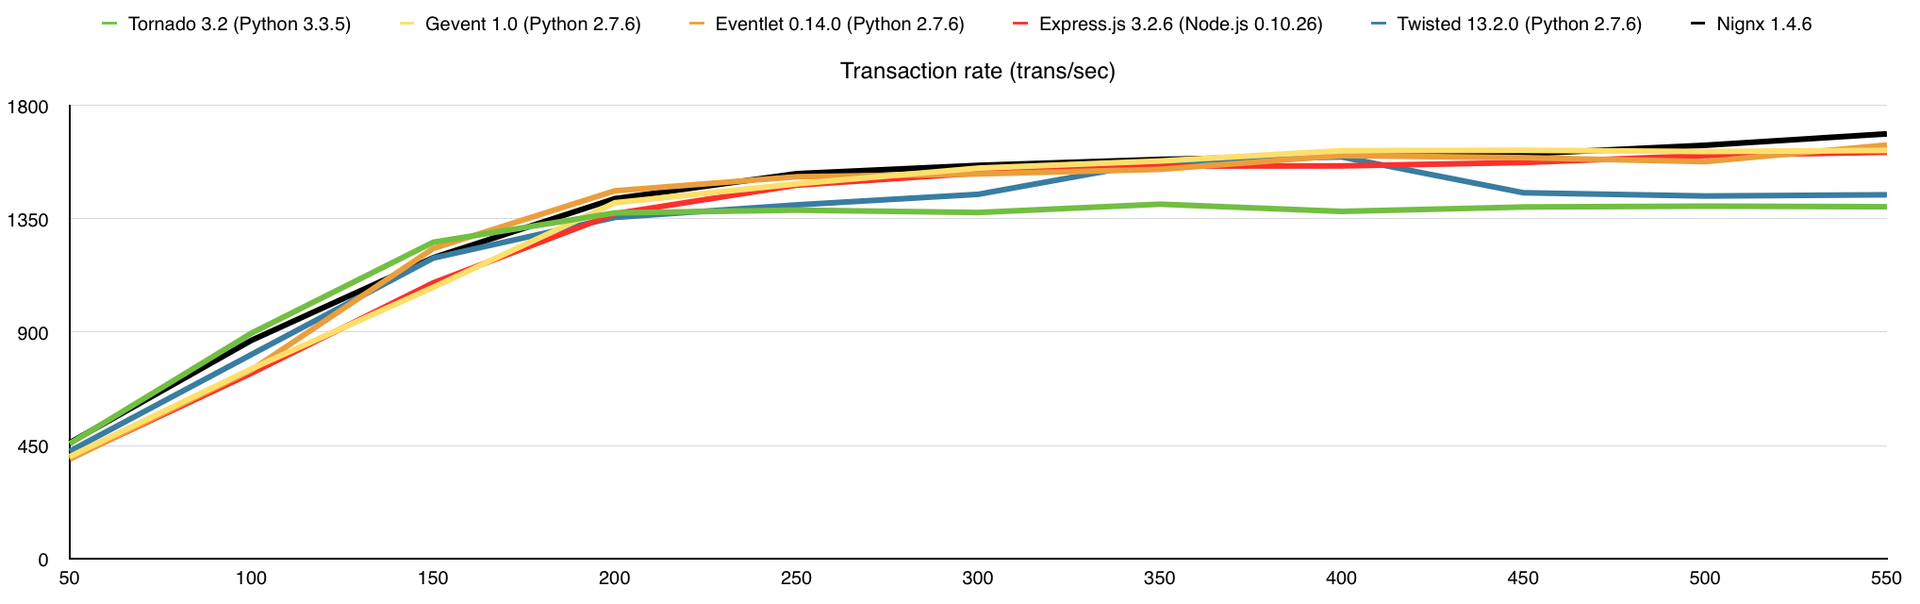
This could be the end of the article, but I wanted to use MongoDB GridFS in my project, so I decided to see how performance would change with its use. This test is similar to the 3rd one, except that I uploaded all the images in the amount of 10,000 in MongoDB and rewrote the web servers so that they would distribute files from the database. So what do we get:
Number of completed requests
The number of processed requests per second
CPU load (%)
RAM consumption (% of 32Gb)
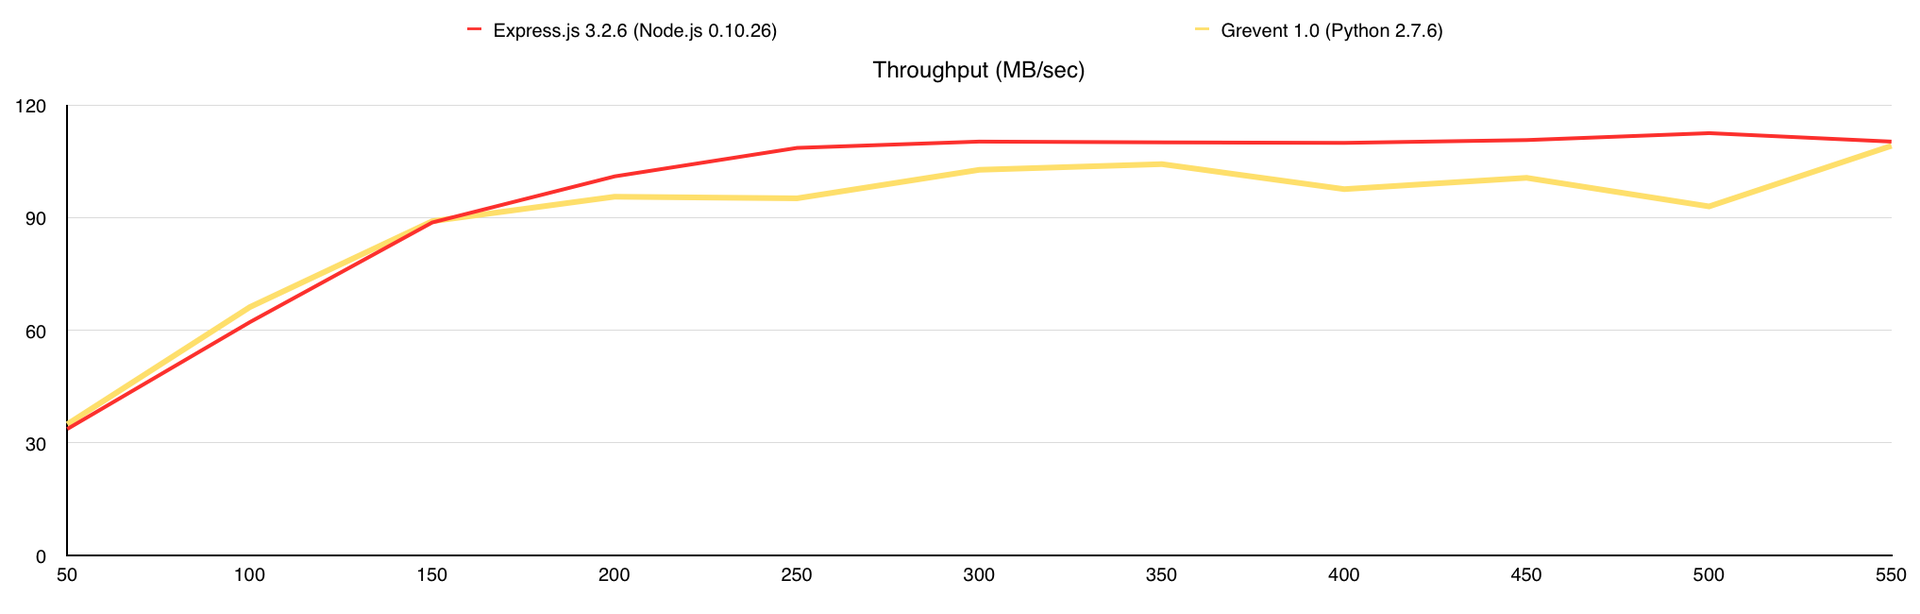
Communication channel load (megabytes per second)
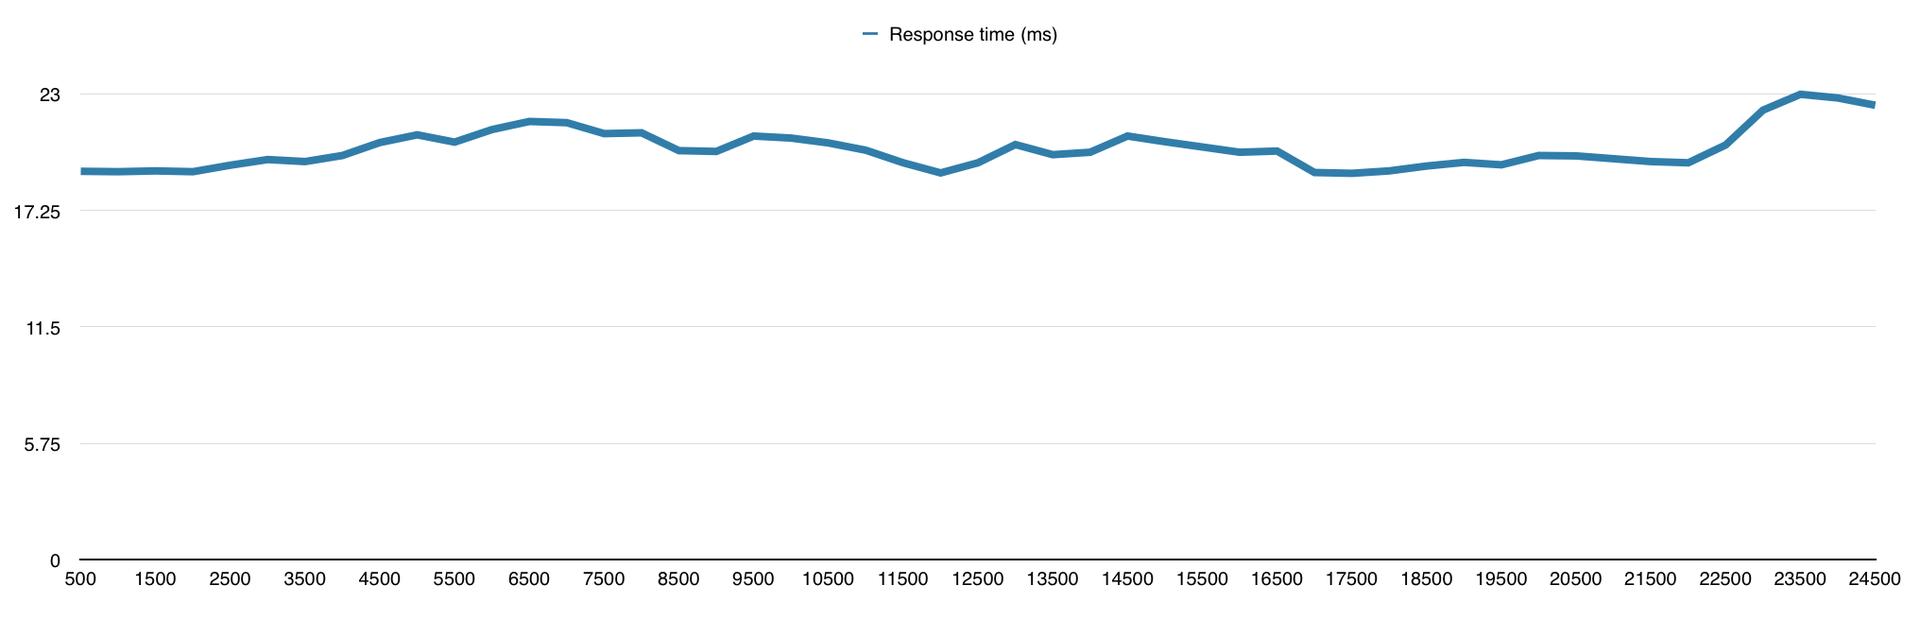
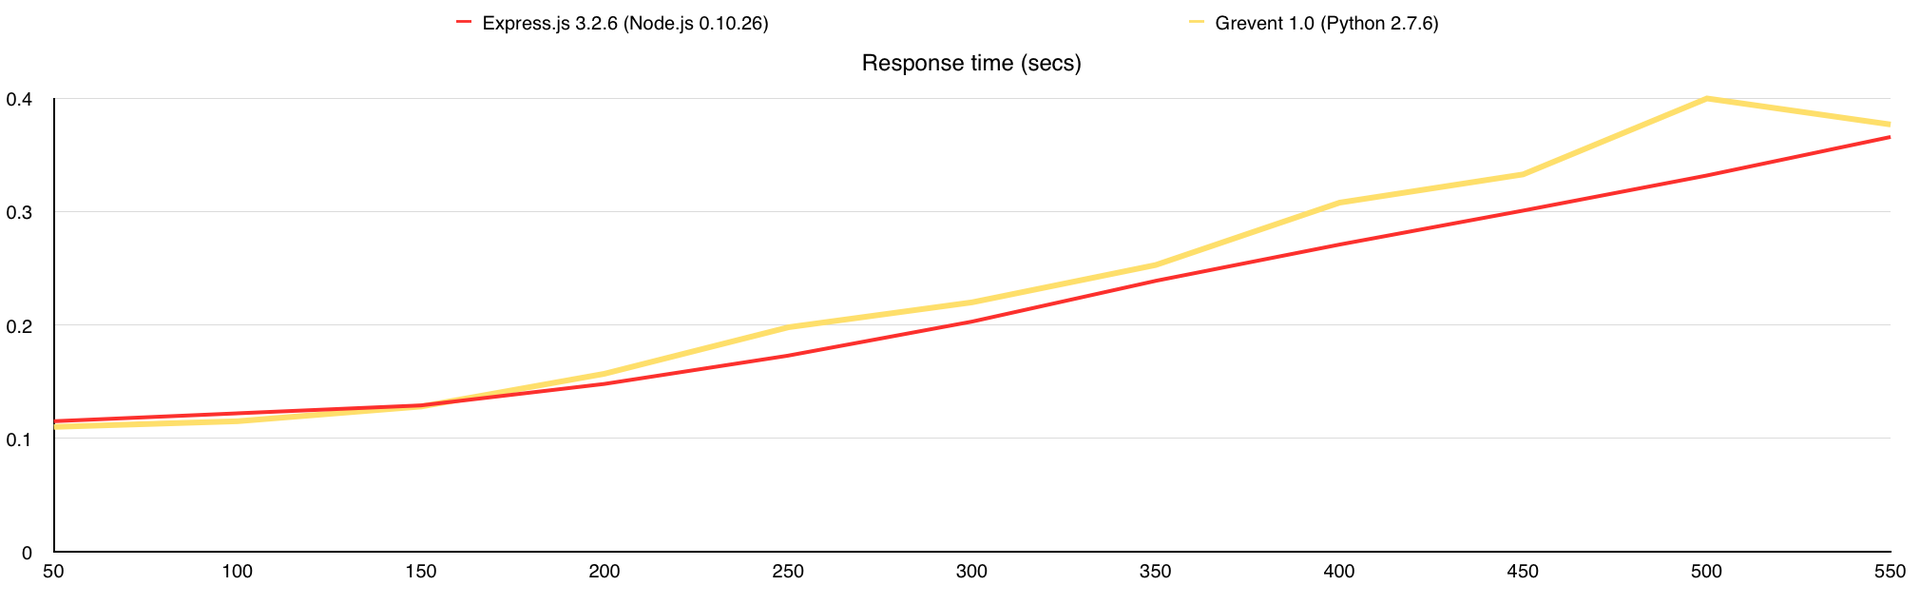
Average request response time (in seconds)
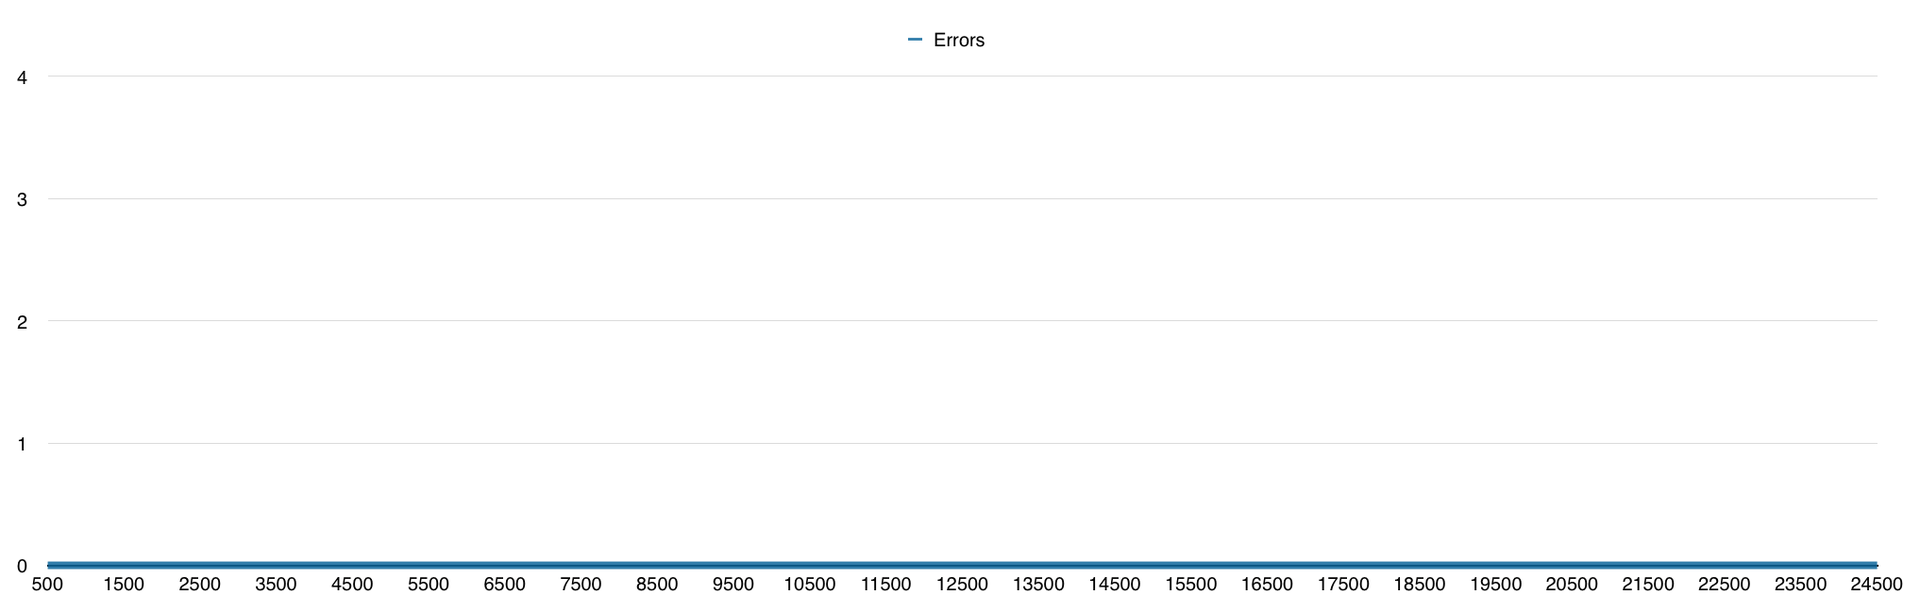
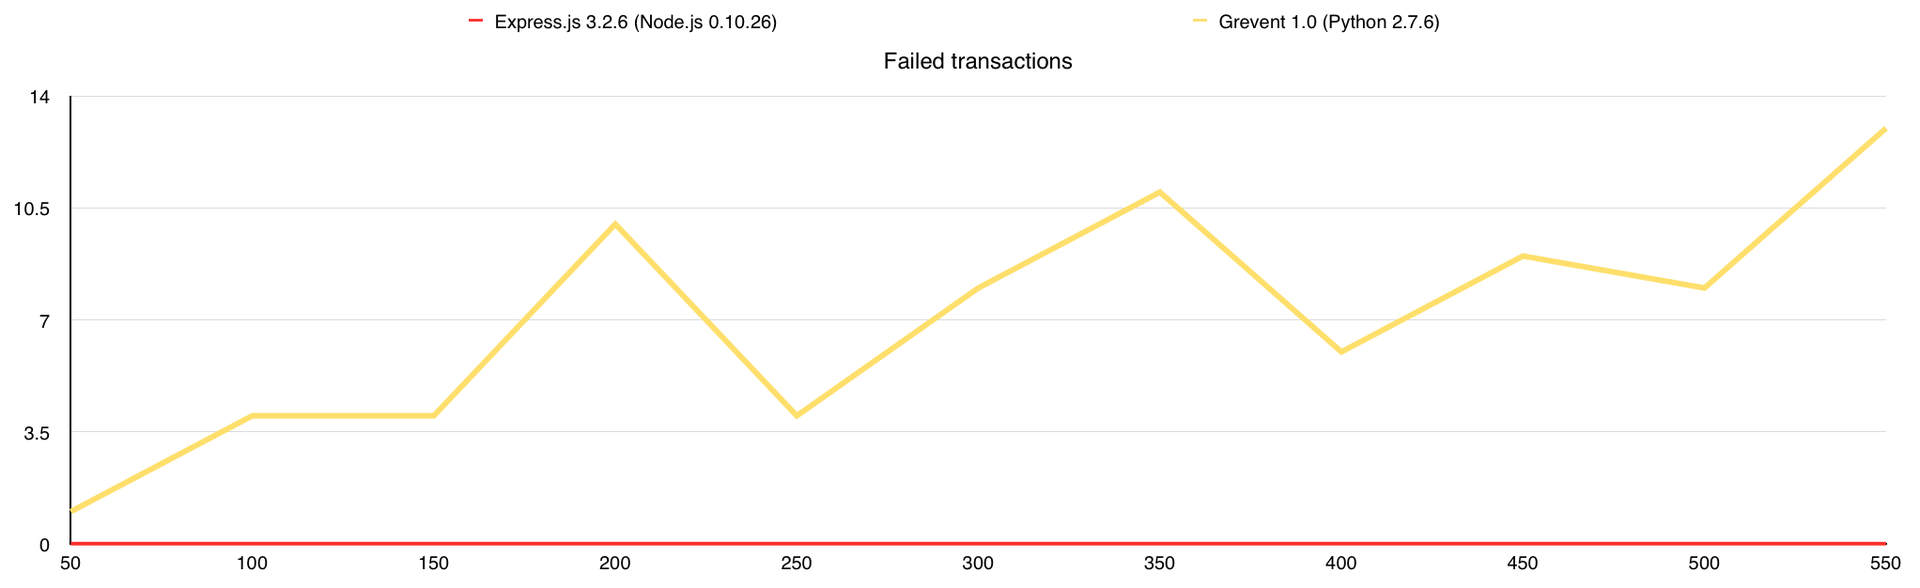
Number of mistakes
During the test, Gevent had answers with errors, so I added a graph “Number of errors”. In general, GridFS can be used, but it should be borne in mind that the database itself creates a considerable load on the CPU, and I had 7 free cores at its disposal, when everything is much simpler with the file system.
Results (in brackets the number of processed requests without errors):
- Express.js ( 88714 )
- Gevent ( 86182 )
findings
- MacBook Pro Retina really works out 9 hours on a single charge.
- Node.js is not the only tool, some say, for developing network applications.
- Gevent produces very good performance.
- Making an article takes more time than writing it.
- Performance testing is a complex process that takes a lot of time.
Seriously, it all depends on the conditions under which your project will work. You can conduct a huge number of tests, but when the service is written, everything will most likely be completely different. For example, if you increase the number of pictures from 10,000 to 1,000,000, the performance of the hard drive, rather than the communication channel, becomes a bottleneck.
Materials
If you decide to conduct your own testing or study mine in more detail, then this list should help you.
Reports
Full reports with individual charts and numbers can be downloaded at these links:
- Text / Httperf / VPS 1 CPU, 512Mb RAM
- Text / Httperf / Intel Core i7-4770 Quad-Core Haswell, 32 GB DDR3 RAM
- Files / Siege / Intel Core i7-4770 Quad-Core Haswell, 32 GB DDR3 RAM
- GridFS / Siege / Intel Core i7-4770 Quad-Core Haswell, 32 GB DDR3 RAM
Tools
In my tests, I used:
Frameworks
The tests involved:
- Gevent ( text , file , GridFS server code )
- Express.js ( text , file , GridFS server code )
- Eventlet ( text , file server code )
- Tornado ( text , file server code )
- Eventmachine ( text server code )
- Twisted ( text , file server code )
Thank you all for your attention.
Follow me on Twitter , I talk about working in a startup, my mistakes and the right decisions, about python and everything related to web development.
PS I'm looking for developers in the company, the details are in my profile .