Business processes multiplied by efficiency. Part 2: BPM Overview with KPI Accounting
In a previous post, we talked about three key functions that KPI accounting tools are aimed at:
Today I will give examples of how this is implemented in practice by developers of BPM systems.
I analyzed the popular Russian and Western systems for managing business processes and performance indicators in terms of compliance with the following parameters:
The systems for review were chosen by me arbitrarily, preference was given to the most interesting, as it seems to me, from the point of view of execution.
QPR Suite is a set of solutions for modeling, structuring, analysis of enterprise business processes. Developer - QPR Software plc. (Finland).
In the graphical environment of QPR Designer, company processes are designed. For this, the system provides a wide range of simple graphical elements (stencils):
The company's business processes are displayed in the system in the form of a strict hierarchical structure, taking into account those pools that are involved in their implementation.

In turn, each process is displayed in the form of a complex multi-level structure, which allows you to trace areas of responsibility at all stages:

In the dashboard “scorecard” of the QPR Metrics module, the results achieved by the company in key areas of activity are displayed:
For a detailed study of current indicators for a specific type of activity, you can “fail” in the card of any object:
Performance indicators (KPI) of employees and managers are displayed in their personal cards:
Performance indicators for business processes here are relevant metrics and indicators. They clearly reflect the course of processes:
The general picture of all types of activities is visible in the strategic map of the company:

The QPR Suite system has a detailed editor for modeling business processes, as well as company management tools (events, work processes).
In addition, QPR Suite has a wide range of visual effects, thanks to which it is convenient to analyze the company's performance in key areas of its activities.
However, the QPR Suite interface seemed to me more suitable for analytics than for dynamic process control.
In the Fox Manager business modeling and process analysis system, each business line of the company corresponds to certain business processes, the logic, executors and sequence of which are set in the graphical environment of the editor:
A diagram of each process is assigned to its card:

When you go to this section, you can analyze the employee’s performance on the basis of percentage indicators:

Based on employee indicators and their effectiveness, the size of the bonus is calculated:
You can track the change in employee performance indicators over time. This is done using a graph:

Analyzes of the quality and efficiency of those operations that are regulated by this process are provided in the relevant reports.
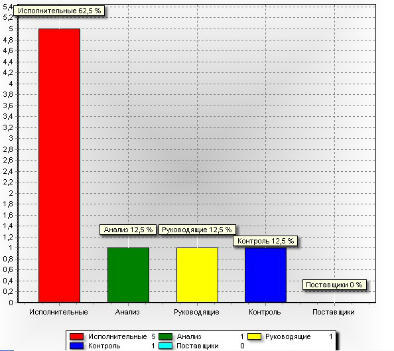
Process indicators (in this case, temporary) are visually displayed in reports. This is what the infographic in the report reflects the time spent on the company's processes (in percent):
Using the “Control” module, it is possible to analyze what results in the implementation of certain works have been achieved at the moment.

The Fox Manager system is a tool for modeling business processes and analyzing them using appropriate indicators, nothing more.
Domestic BPM-system developed on the 1C: Enterprise 8 platform by PeterSoft .
The structure of the system includes the following functional areas:
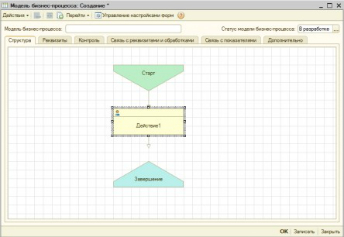
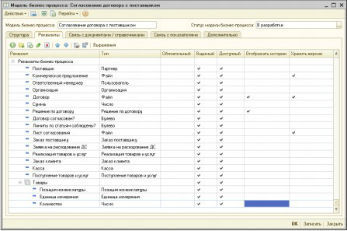
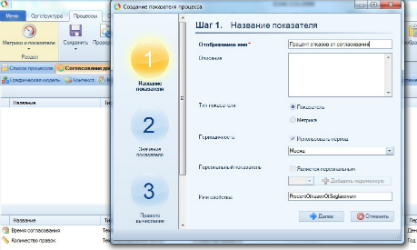
Business processes are modeled in the web interface of the system in the business process card. For this, the user is offered a set of simple flowcharts:
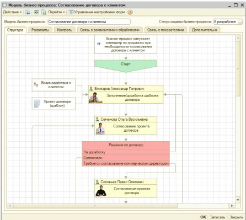
The resulting graphical diagram of the business process with all the executors and related procedures is displayed in the process card:
Each point (step) of the business process is assigned a specific set of attributes (details), including the name, indication of the executors , type of document:
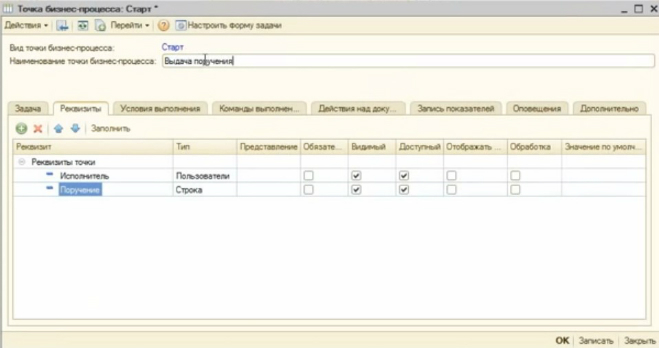
The next step in building the logic of a business process is setting up its details: The
collection of indicators can be carried out manually and using business processes.
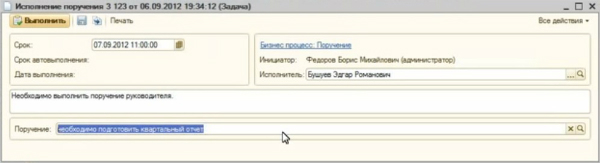
When the process starts, the corresponding task comes to the responsible user:
Changes to existing processes can be made on the go. Simply remove or add new blocks to the graphical model of the process.
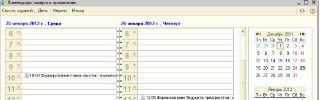
Typical processes can be configured for regular execution automatically:
The head is provided with consolidated reporting on all indicators of the company:
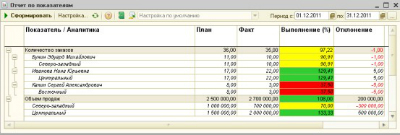
A summary of all types of company business processes indicating the number of running instances and their statuses, planned and actual time indicators is presented in the process execution report:
Also, reporting on process statuses can be displayed in graphical form. The status of operations (tasks) in the process is marked with the color:
The influence of KPIs of employees and departments on the overall results of the company can be seen in the example of such an element as calculated indicators.
Estimated indicators are total values that consist of a number of key indicators according to a special formula. For example, to calculate the “Finance” value, the indicators “Sales volume” and “Marginal profit” are added:
The terms of this formula can be flexibly adjusted for each calculated indicator.
The relationship between the calculated indicator and the KPI is graphically shown in the Supervisor Panel.

The presentation model can be customized for a specific user.
The solution "Process Management" based on 1C: Enterprise 8 presents an extensive set of tools for building business processes of the company. There is a graphical editor, tools for monitoring / improving business processes, and custom panels for visual display of indicators.
KPI here is not just an optional “appendage”, but an element of controlling the company's process model.
All this is implemented with the scrupulousness inherent in the products of the 1C line. For example, the construction of each stage of the process chain requires the introduction of a large amount of related data.
ELMA is a BPM class system and at the same time a platform for developing modules and solutions aimed at various aspects of the business. The ELMA-based KPI module serves to visually display employee performance indicators, which are considered in relation to the strategic goals of the company.
A complete business solution that combines BPM functionality, process metrics, strategy management tools and staff motivation tools is offered in the ELMA BPM Suite .
Let's consider what functionality is supplied by the developer as part of this package.
ELMA Designer is a configurator that graphically displays the organizational structure of a company. To do this, the user has at his disposal a whole set of simple geometric shapes and elements.
The Designer also forms the company's strategic goals and KPI indicators assigned to certain employees and departments. Logically interconnected, indicators form a tree of indicators.
The ELMA system has convenient dashboards with graphs and tables that show the dynamics of changes for both all and selected indicators:
The sum of the employee’s indicators reflects its overall performance. This is implemented in such an element of the system as the “Performance Matrix”, in addition to key indicators, which includes a tool for monitoring the implementation of SMART tasks (priority tasks set for a specified period), the level of performing discipline and the leader’s assessment.
The weight of these parameters, the set of key indicators, the frequency of their accounting, and other elements of the performance matrix are configured separately for each user / user group by the system administrator:
SMART tasks are a tool that deserves special attention.
As I said above, it serves to set priority and strategically significant tasks for employees. Already at the stage of formulating the task, it is possible to link it to a specific strategic goal of the company. This emphasizes the importance of the result achieved by the employee for the success of the entire company:
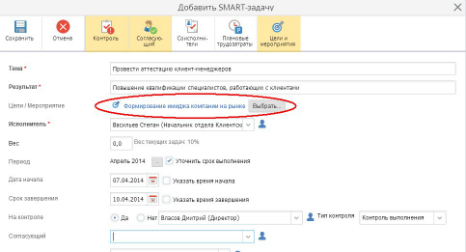
Thus, ELMA logically links the company's strategy and SMART tasks, which are one of the components of the employee performance matrix.
All components of the efficiency matrix in their entirety affect the size of the employee bonus, being one of the most effective means of motivating staff.

Now about how goals and indicators are displayed in the web interface.
For each process, you can assign a set of indicators and metrics that will serve as controllers of its execution:
For processes, you can configure color indicators, each of which is associated with a specific indicator.
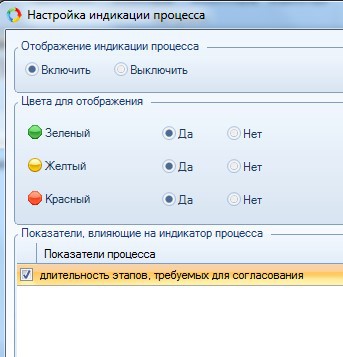
The processes that are executed in the normal mode are marked in green in the Process Monitor, “lagging” or “problematic” in yellow and red, respectively:

The Goals Map graphically shows the areas of activity and strategic goals of the company for the current period. The level of “nesting” of the goal map depends on how extensive the organizational structure of the company is. Each unit has its own goals, and they reflect the specifics of its activities:

ELMA in the BPM Suite delivery option is a complete system for modeling, management and control of business processes.
The developers of the product devote much attention to accounting for KPI indicators, which is reflected in such components of the system as performance indicators that are flexibly customizable in accordance with the organizational structure, company processes and tied to strategic goals, performance matrix, SMART tasks. The dynamics of indicators is reflected using graphics and custom dashboards. All these tools allow you to control the quality of business processes.
The system of business modeling of enterprise processes, interesting in its functionality and execution. Developer - domestic IT vendor GK "Modern management technologies." The range of tasks that Business Studio allows to solve includes modeling and controlling business processes, designing BSC strategic goals with reference to KPI indicators for employees and departments, simulation modeling and analysis of the company's balance, support for QMS.
The system supports popular notations for creating business process models: IDEF0, BPMN, EPC, Basic Flowchart, Cross Functional Flowchart. Using the block diagrams and other graphic elements, the structure of the business process is modeled:

The system has such a mechanism for tracking dynamics as controlling processes:

The system has convenient dashboards for familiarizing yourself with company indicators:

as well as tools for analyzing key performance indicators associated with them, both your own and company departments: The
dynamics of changes in these indicators are clearly visible in the relevant diagrams:

The strategic map clearly shows the lines of activity, goals and indicators of the company.

However, in order to study the dynamics of various indicators, you need to delve into them. In my opinion, this makes it difficult to form a holistic picture of what is happening in the company
The Business Studio system has developed functionality for modeling and analyzing business processes using indicators, charts, and reports. However, management tools and process improvements are not provided for in it.
The program for modeling business processes and enterprise management from the German company Software AG . Available for free download on the developer's site. It does not require the user programming skills and special knowledge in the field of IT, which is especially important for small companies, students studying the basics of enterprise management.
Despite the fact that the system is free, it includes a complete set of tools for describing processes. The main features of the free system are as follows:
Convenient environment for modeling business processes using flowcharts (takes into account entities such as events, actions and positions):
Graphical environment for building process logic and hierarchy (process landscape):

Approval, processing of requests and documents are arranged in accordance with the organizational company structure and process model:
ARIS Express 2.4 developers did not ignore such an aspect as personnel performance indicators.
In the free delivery are not provided. But in the version of the ARIS Business Strategy product there are dashboards for tracking KPI and BCS.
The Whiteboard component (an analogue of a conventional writing board with a marker) sets the company's KPIs in accordance with the competence of an employee or unit, and strategic goals. Formulate employee performance indicators using elements such as KPI Instance (in translation - “KPI indicator options”).
ARIS Xpress is a free simulation system with a simple and intuitive interface. That is why it is used in teaching students the basics of describing business processes and small companies. However, it cannot be called a full-fledged BPM system, since there are no tools for managing, improving and controlling business processes in it.
So, KPI accounting tools are an important structural component of BPM systems, combining the means of forming a company’s strategy and indicators to track how effectively this strategy is being implemented.
Each of the integrated BPM + KPI solutions has its own functional specifics. Some of them are universal business solutions that can adapt to the specifics of almost any company, while others are focused on narrow target groups. A number of systems offer the user the full functionality of BPM and KPI, a number of others are, in fact, only process configurators.
One of the tasks of KPI tools in a BPM system is process control. Not all systems presented in the review have implemented this; there are also differences in implementation methods.
The relationship between strategic goals and performance indicators is implemented differently.
Brief results on the considered systems are given in the table:
- Monitoring employee performance and staff motivation
- Process controlling
- Managing company goals
Today I will give examples of how this is implemented in practice by developers of BPM systems.
I analyzed the popular Russian and Western systems for managing business processes and performance indicators in terms of compliance with the following parameters:
- graphical environment for modeling business processes and indicators (hereinafter briefly referred to as “modeling” );
- dashboards showing the dynamics of indicators (dash boards);
- opportunity to link the KPI metrics with indicators processes ;
- the logical link between strategic objectives (BSC) and performance indicators (KPI) .
The systems for review were chosen by me arbitrarily, preference was given to the most interesting, as it seems to me, from the point of view of execution.
QPR Suite 2012
QPR Suite is a set of solutions for modeling, structuring, analysis of enterprise business processes. Developer - QPR Software plc. (Finland).
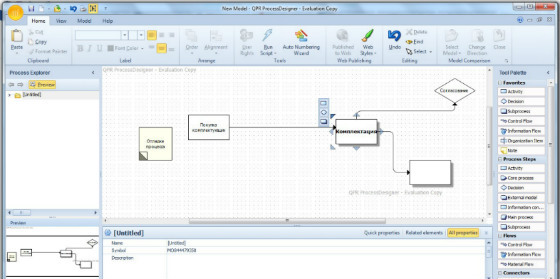
Modeling
In the graphical environment of QPR Designer, company processes are designed. For this, the system provides a wide range of simple graphical elements (stencils):
The company's business processes are displayed in the system in the form of a strict hierarchical structure, taking into account those pools that are involved in their implementation.
In turn, each process is displayed in the form of a complex multi-level structure, which allows you to trace areas of responsibility at all stages:
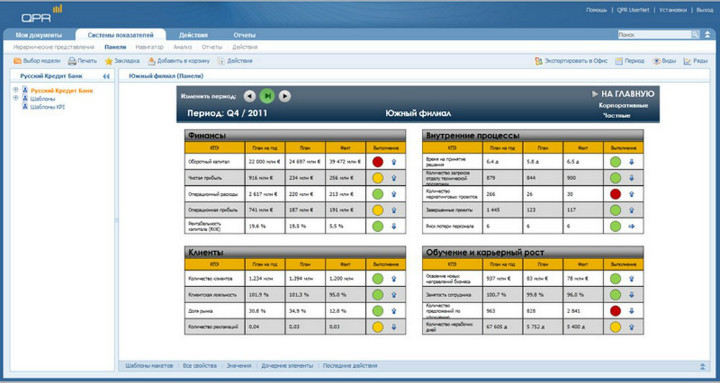
Dashboards and analytics
In the dashboard “scorecard” of the QPR Metrics module, the results achieved by the company in key areas of activity are displayed:
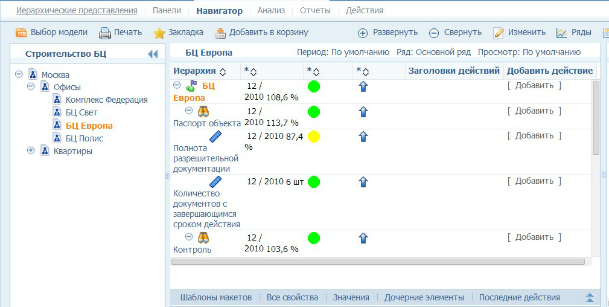
For a detailed study of current indicators for a specific type of activity, you can “fail” in the card of any object:
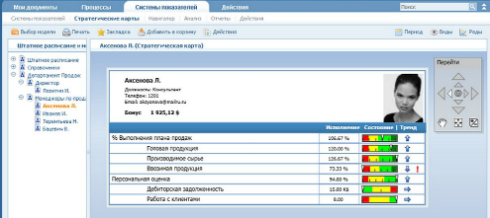
Performance indicators (KPI) of employees and managers are displayed in their personal cards:
Process analysis
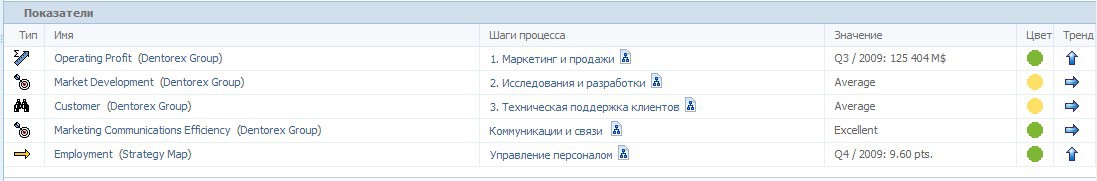
Performance indicators for business processes here are relevant metrics and indicators. They clearly reflect the course of processes:
Link strategic goals and KPI
The general picture of all types of activities is visible in the strategic map of the company:
General impression of the system
The QPR Suite system has a detailed editor for modeling business processes, as well as company management tools (events, work processes).
In addition, QPR Suite has a wide range of visual effects, thanks to which it is convenient to analyze the company's performance in key areas of its activities.
However, the QPR Suite interface seemed to me more suitable for analytics than for dynamic process control.
Fox manager
Modeling
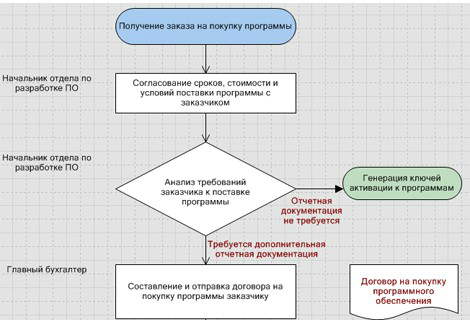
In the Fox Manager business modeling and process analysis system, each business line of the company corresponds to certain business processes, the logic, executors and sequence of which are set in the graphical environment of the editor:
A diagram of each process is assigned to its card:
Dashboards and analytics
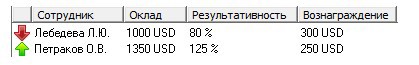
When you go to this section, you can analyze the employee’s performance on the basis of percentage indicators:
Based on employee indicators and their effectiveness, the size of the bonus is calculated:
You can track the change in employee performance indicators over time. This is done using a graph:
Process analysis using indicators
Analyzes of the quality and efficiency of those operations that are regulated by this process are provided in the relevant reports.
Process indicators (in this case, temporary) are visually displayed in reports. This is what the infographic in the report reflects the time spent on the company's processes (in percent):
Linking Strategy and KPI
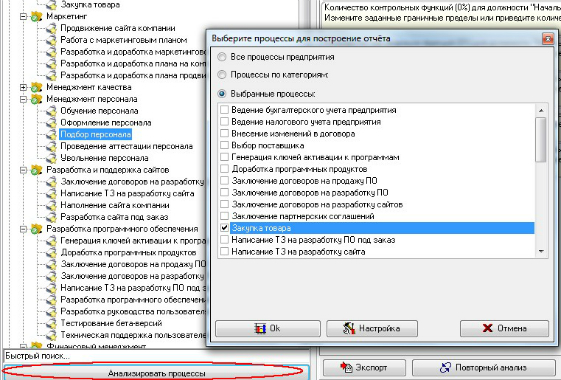
Using the “Control” module, it is possible to analyze what results in the implementation of certain works have been achieved at the moment.
General impression of the system
The Fox Manager system is a tool for modeling business processes and analyzing them using appropriate indicators, nothing more.
Petersoft: process management
Domestic BPM-system developed on the 1C: Enterprise 8 platform by PeterSoft .
The structure of the system includes the following functional areas:
- business process management
- Electronic archive
- KPI scorecard
Modeling
Business processes are modeled in the web interface of the system in the business process card. For this, the user is offered a set of simple flowcharts:
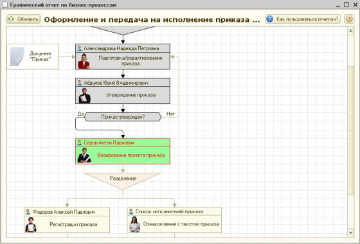
The resulting graphical diagram of the business process with all the executors and related procedures is displayed in the process card:
Each point (step) of the business process is assigned a specific set of attributes (details), including the name, indication of the executors , type of document:
The next step in building the logic of a business process is setting up its details: The
collection of indicators can be carried out manually and using business processes.
When the process starts, the corresponding task comes to the responsible user:
Changes to existing processes can be made on the go. Simply remove or add new blocks to the graphical model of the process.
Typical processes can be configured for regular execution automatically:
Dashboards and analytics
The head is provided with consolidated reporting on all indicators of the company:
Process analysis using indicators
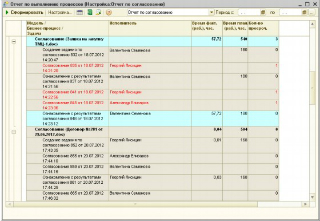
A summary of all types of company business processes indicating the number of running instances and their statuses, planned and actual time indicators is presented in the process execution report:
Also, reporting on process statuses can be displayed in graphical form. The status of operations (tasks) in the process is marked with the color:
Link strategic goals and KPI
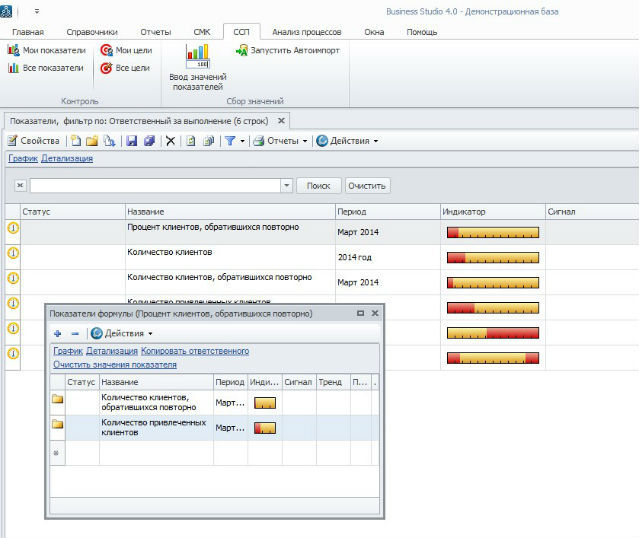
The influence of KPIs of employees and departments on the overall results of the company can be seen in the example of such an element as calculated indicators.
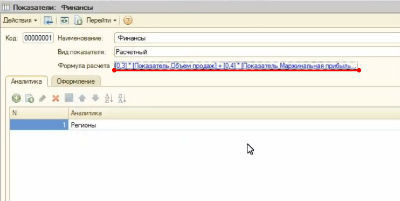
Estimated indicators are total values that consist of a number of key indicators according to a special formula. For example, to calculate the “Finance” value, the indicators “Sales volume” and “Marginal profit” are added:
The terms of this formula can be flexibly adjusted for each calculated indicator.
The relationship between the calculated indicator and the KPI is graphically shown in the Supervisor Panel.
The presentation model can be customized for a specific user.
General impression of the system
The solution "Process Management" based on 1C: Enterprise 8 presents an extensive set of tools for building business processes of the company. There is a graphical editor, tools for monitoring / improving business processes, and custom panels for visual display of indicators.
KPI here is not just an optional “appendage”, but an element of controlling the company's process model.
All this is implemented with the scrupulousness inherent in the products of the 1C line. For example, the construction of each stage of the process chain requires the introduction of a large amount of related data.
ELMA BPM Suite
ELMA is a BPM class system and at the same time a platform for developing modules and solutions aimed at various aspects of the business. The ELMA-based KPI module serves to visually display employee performance indicators, which are considered in relation to the strategic goals of the company.
A complete business solution that combines BPM functionality, process metrics, strategy management tools and staff motivation tools is offered in the ELMA BPM Suite .
Let's consider what functionality is supplied by the developer as part of this package.
Modeling
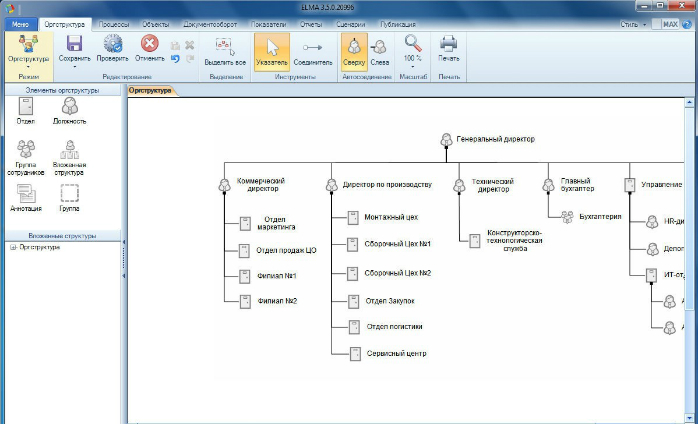
ELMA Designer is a configurator that graphically displays the organizational structure of a company. To do this, the user has at his disposal a whole set of simple geometric shapes and elements.
The Designer also forms the company's strategic goals and KPI indicators assigned to certain employees and departments. Logically interconnected, indicators form a tree of indicators.
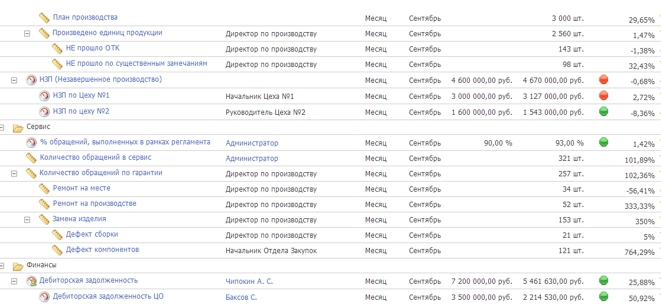
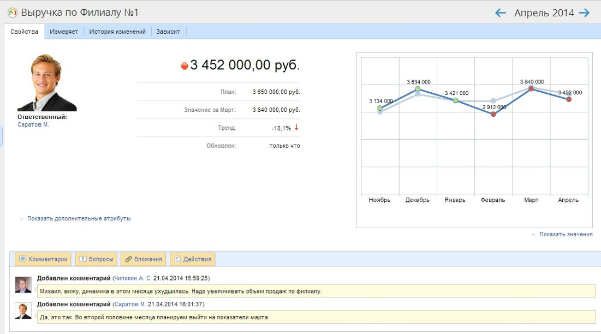
Dashboards and analytics
The ELMA system has convenient dashboards with graphs and tables that show the dynamics of changes for both all and selected indicators:
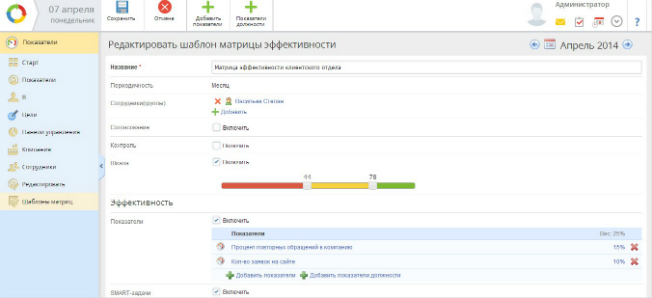
The sum of the employee’s indicators reflects its overall performance. This is implemented in such an element of the system as the “Performance Matrix”, in addition to key indicators, which includes a tool for monitoring the implementation of SMART tasks (priority tasks set for a specified period), the level of performing discipline and the leader’s assessment.
The weight of these parameters, the set of key indicators, the frequency of their accounting, and other elements of the performance matrix are configured separately for each user / user group by the system administrator:
SMART tasks are a tool that deserves special attention.
As I said above, it serves to set priority and strategically significant tasks for employees. Already at the stage of formulating the task, it is possible to link it to a specific strategic goal of the company. This emphasizes the importance of the result achieved by the employee for the success of the entire company:
Thus, ELMA logically links the company's strategy and SMART tasks, which are one of the components of the employee performance matrix.
All components of the efficiency matrix in their entirety affect the size of the employee bonus, being one of the most effective means of motivating staff.
Now about how goals and indicators are displayed in the web interface.
Process Control with KPI
For each process, you can assign a set of indicators and metrics that will serve as controllers of its execution:
For processes, you can configure color indicators, each of which is associated with a specific indicator.
The processes that are executed in the normal mode are marked in green in the Process Monitor, “lagging” or “problematic” in yellow and red, respectively:
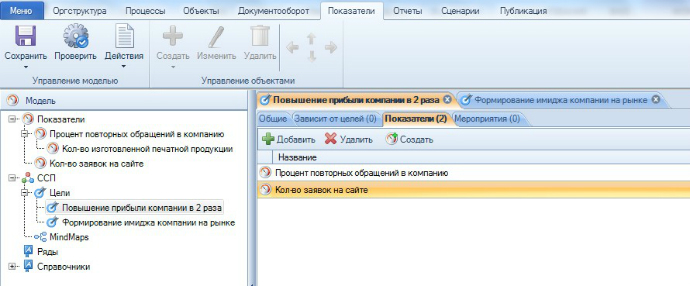
Link strategic goals and KPI
The Goals Map graphically shows the areas of activity and strategic goals of the company for the current period. The level of “nesting” of the goal map depends on how extensive the organizational structure of the company is. Each unit has its own goals, and they reflect the specifics of its activities:
General impression of the system
ELMA in the BPM Suite delivery option is a complete system for modeling, management and control of business processes.
The developers of the product devote much attention to accounting for KPI indicators, which is reflected in such components of the system as performance indicators that are flexibly customizable in accordance with the organizational structure, company processes and tied to strategic goals, performance matrix, SMART tasks. The dynamics of indicators is reflected using graphics and custom dashboards. All these tools allow you to control the quality of business processes.
Business studio
The system of business modeling of enterprise processes, interesting in its functionality and execution. Developer - domestic IT vendor GK "Modern management technologies." The range of tasks that Business Studio allows to solve includes modeling and controlling business processes, designing BSC strategic goals with reference to KPI indicators for employees and departments, simulation modeling and analysis of the company's balance, support for QMS.
Modeling
The system supports popular notations for creating business process models: IDEF0, BPMN, EPC, Basic Flowchart, Cross Functional Flowchart. Using the block diagrams and other graphic elements, the structure of the business process is modeled:
Process Analysis with KPIs
The system has such a mechanism for tracking dynamics as controlling processes:
Dashboards and analytics
The system has convenient dashboards for familiarizing yourself with company indicators:
as well as tools for analyzing key performance indicators associated with them, both your own and company departments: The
dynamics of changes in these indicators are clearly visible in the relevant diagrams:
Relationship of strategic indicators and KPI
The strategic map clearly shows the lines of activity, goals and indicators of the company.
However, in order to study the dynamics of various indicators, you need to delve into them. In my opinion, this makes it difficult to form a holistic picture of what is happening in the company
General impression of the system
The Business Studio system has developed functionality for modeling and analyzing business processes using indicators, charts, and reports. However, management tools and process improvements are not provided for in it.
ARIS Express 2.4
The program for modeling business processes and enterprise management from the German company Software AG . Available for free download on the developer's site. It does not require the user programming skills and special knowledge in the field of IT, which is especially important for small companies, students studying the basics of enterprise management.
Despite the fact that the system is free, it includes a complete set of tools for describing processes. The main features of the free system are as follows:
Modeling
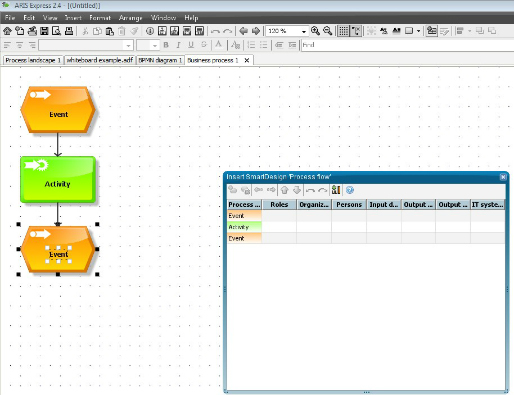
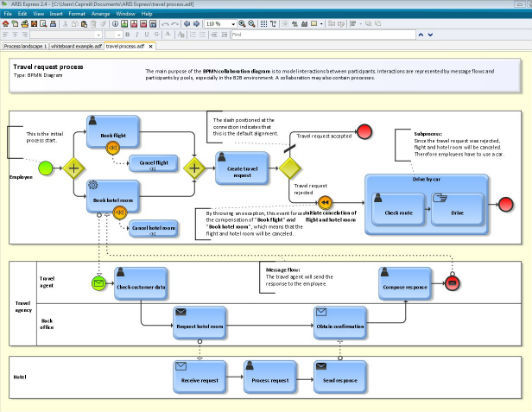
Convenient environment for modeling business processes using flowcharts (takes into account entities such as events, actions and positions):
Graphical environment for building process logic and hierarchy (process landscape):
Approval, processing of requests and documents are arranged in accordance with the organizational company structure and process model:
ARIS Express 2.4 developers did not ignore such an aspect as personnel performance indicators.
Dashboards and analytics
In the free delivery are not provided. But in the version of the ARIS Business Strategy product there are dashboards for tracking KPI and BCS.
Link strategic goals with KPI
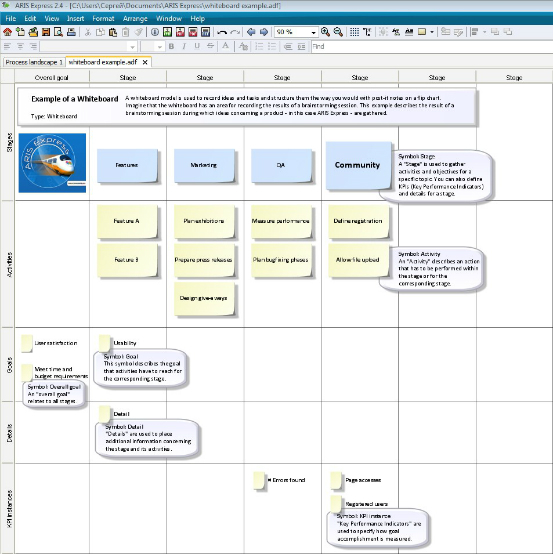
The Whiteboard component (an analogue of a conventional writing board with a marker) sets the company's KPIs in accordance with the competence of an employee or unit, and strategic goals. Formulate employee performance indicators using elements such as KPI Instance (in translation - “KPI indicator options”).
Impression of the system
ARIS Xpress is a free simulation system with a simple and intuitive interface. That is why it is used in teaching students the basics of describing business processes and small companies. However, it cannot be called a full-fledged BPM system, since there are no tools for managing, improving and controlling business processes in it.
Conclusion
So, KPI accounting tools are an important structural component of BPM systems, combining the means of forming a company’s strategy and indicators to track how effectively this strategy is being implemented.
Each of the integrated BPM + KPI solutions has its own functional specifics. Some of them are universal business solutions that can adapt to the specifics of almost any company, while others are focused on narrow target groups. A number of systems offer the user the full functionality of BPM and KPI, a number of others are, in fact, only process configurators.
One of the tasks of KPI tools in a BPM system is process control. Not all systems presented in the review have implemented this; there are also differences in implementation methods.
The relationship between strategic goals and performance indicators is implemented differently.
Brief results on the considered systems are given in the table:
| System | Type of system | Display strategic goals | Employee Dashboard | Ability to adjust processes on the go | Mobile Support |
 | Business Process Modeling System | Strategic map | Plan-factual analysis by area of responsibility | not | not |
 | Business modeling system | Tab “Control”, goals and indicators | Module "Control" | not | not |
 | The system of managing business processes, indicators and interaction in the company | A detailed map of the goals of the company, its divisions and activities | Performance matrix | there is | yes there is an elma solution for the ipad |
 | System for modeling and analysis of business processes | Strategic map | Employee card | there is | not |
 | Business Process Modeling System | Cause and effect diagram | Charts | not | yes iPad |
 | Automation and business process management system | Hierarchy of goals | Head Panel | there is | yes iPad |