Interactive map for a web application in a couple of hours
- Tutorial
In the last article, I briefly talked about the capabilities of kepler.gl, a new open source tool for visualizing and analyzing large geo-data sets.
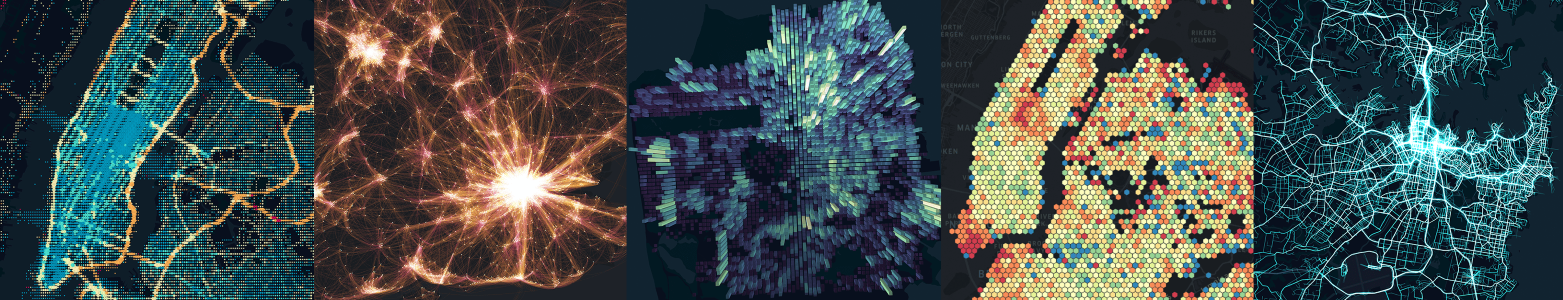
Figure 1. Variants of maps created with kepler.gl (by Uber)
This web application allows you to create an informative, and most importantly, colorful interactive map based on arbitrary sets of geo-data in minutes. However, the question arises what to do with it next? How to share the results with colleagues, friends or customers?
Compare alternatives
All the "magic" of kepler.gl occurs on the client, so the application offers only 2 ways to share your results with others:
- save the visualization as a static image (losing the ability to interact with the map)
- export the created configuration and data in the form of files and send them to all interested parties with instructions on how to load the received data in kepler.gl to view the created map
Fortunately, kepler.gl is not only a web tool, but also a React component, with which you can quickly create a demo site with your visualizations or integrate them into an existing web application.
Note. Processing and aggregating data on the fly, kepler.gl often requires a lot of resources. Therefore, it is worth being especially careful when integrating it into mobile applications.
This use of kepler.gl will allow:
- Do not complicate the process of viewing the visualization (just send a link to your application)
- Do not give access to the original data sets in an explicit form (as required by the 2 base case)
- limit user-accessible formats for interacting with visualizations (for example, disable self-tuning of filters or data display methods)
- save all desired formats of interaction with the card (tooltip, zoom, switching the card mode, etc.)
The last of the considered options will require additional efforts on the part of the creator of geo-visualization and will not be able to do without programming. However, as you will soon see, it will not be difficult to implement it either.
Create a demo application
It's time to move from theory to practice. In order to introduce you to the main stages of integrating kepler.gl into your code, I made a small demo application.
It allows the user to view information about paid Moscow parking in one of two modes - general or aggregated. At the same time, the application only allows you to view the visualizations we create, switch between them, and work with the map in read-only mode. All source code and live version is available on GitHub .
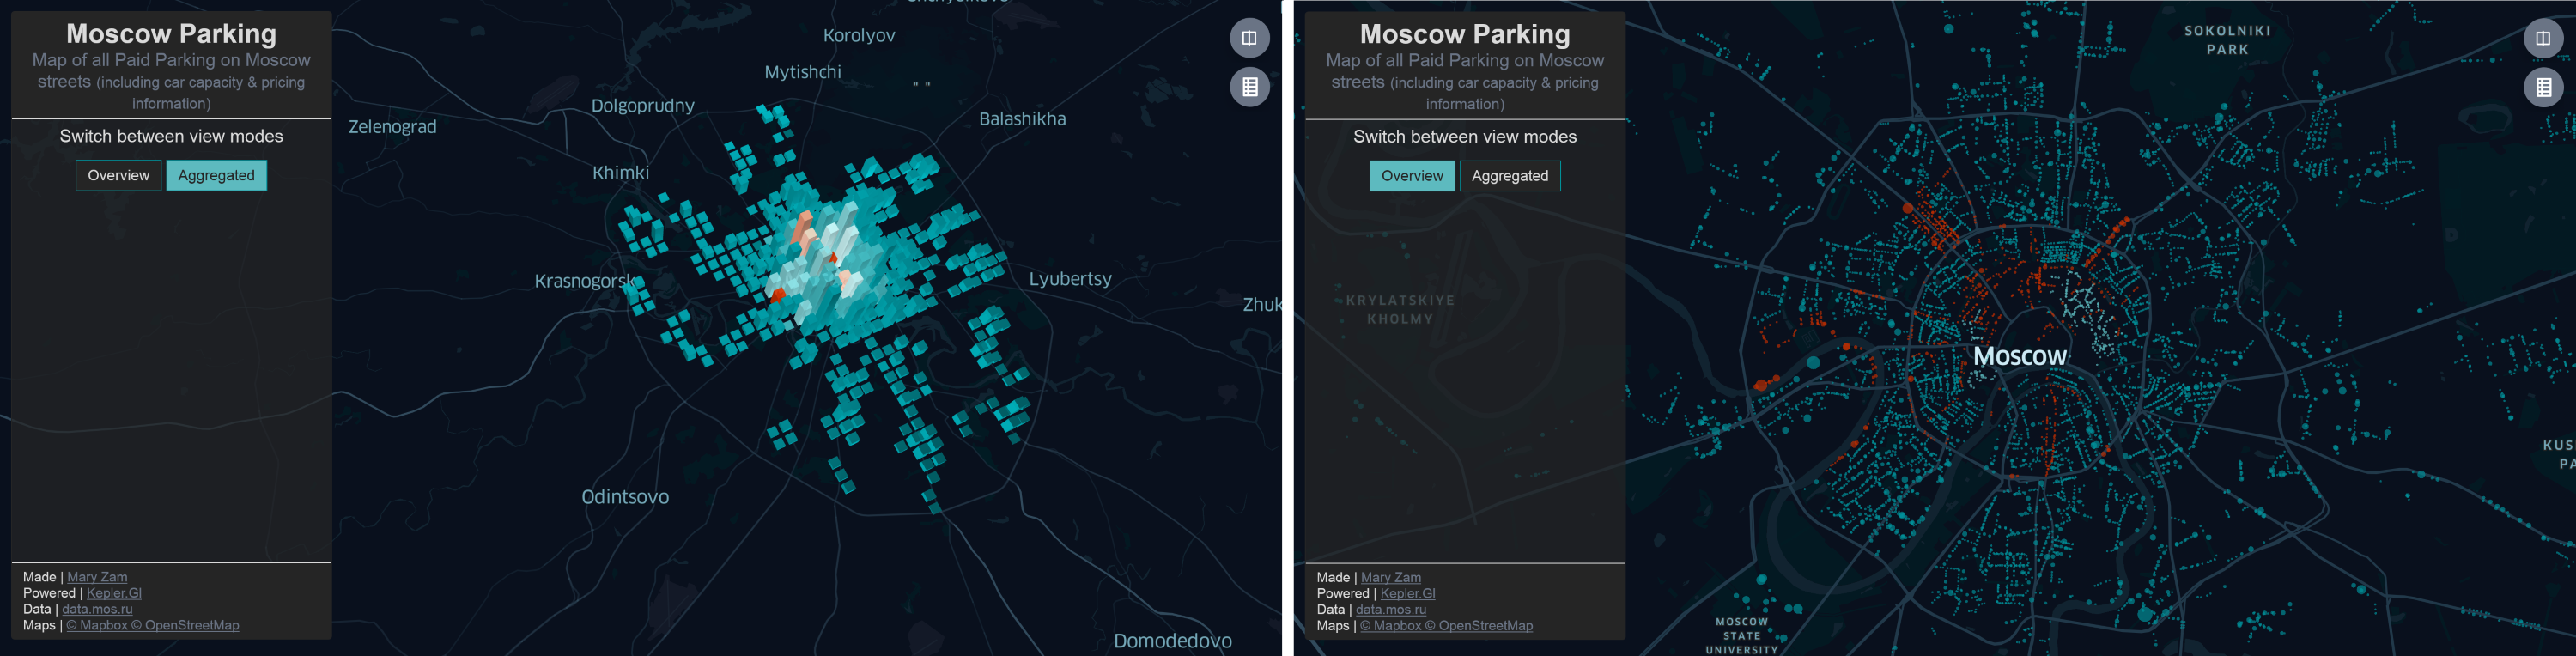
Figure 2. Two map views provided by the demo application
To create this demo, I used my own project template. However, if you decide to “play” with kepler.gl yourself, but you have not yet developed personal preferences, I recommend you use create-react-app , which will significantly reduce the time to create the basis for your future application.
Add kepler.gl to the project
Kepler.gl is a React component that uses Redux to store and manage its state. In order to add it to the project, it is enough to install the corresponding npm-package:
npm install --save kepler.glThis npm package includes:
- a set of UI components and factories that allow them to be overridden by their own components
- predefined methods for adding / changing data used and how to display it
- Redux reducer necessary for their work
Configure Redux repository for kepler.gl
Kepler.gl uses Redux to manage its state in the process of creating and updating maps. Therefore, before using the KeplerGl component, we will need to add an appropriate reducer to the application's reducer.
import { combineReducers } from'redux';
import keplerGlReducer from'kepler.gl/reducers';
import appReducer from'./appReducer';
const reducers = combineReducers({
  keplerGl: mapReducer,
  app: appReducer,
});
exportdefault reducers;
It is important to remember that by default the KeplerGl component will provide the user with all the available options for self-editing, downloading, updating and filtering data. To limit the set of actions allowed to the user, you need to transfer information about the map mode (for reading or editing) and the available map controls in the initial state parameters:
const mapReducer = keplerGlReducer
    .initialState({
         uiState: {
              readOnly: true,
              mapControls: {
                  visibleLayers: {
                      show: false
                  },
                  toggle3d: {
                       show: false
                  },
                  splitMap: {
                       show: true
                  },
                  mapLegend: {
                       show: true,
                       active: false
                  }
             }
        }
   });
We will also need to install react-palm , which kepler.gl uses to control side effects, and add taskMiddleware from this npm package to the Redux repository of our application:
import {createStore, applyMiddleware, compose} from'redux';
import {taskMiddleware} from'react-palm';
import reducers from'./reducers';
const initialState = { };
const middlewares = [ taskMiddleware ];
const enhancers = [applyMiddleware(...middlewares)];
exportdefault createStore(
  reducers,
  initialState,
  compose(...enhancers)
);
Note. Currently, the Uber Engineering team is actively working on a new version of kepler.gl in which there will be no dependence on react-palm.
By default, kepler.gl expects its state object to be located at the top state level of the entire application and is accessible by the name keplerGl. If the storage Redux configuration is different from the expected one, then for the corresponding React component to work correctly, it is enough to explicitly specify the location of its state in the hierarchy using the getState property.
We build the React-component KeplerGl
For fast rendering of maps with a large number of displayed elements (up to millions of geo-points!), Kepler.gl uses the desk.gl-WebGL framework for data visualization, and MapBox-Open Source geo-platform, providing a convenient API and wide possibilities for customizing the maps created . Therefore, one of the required parameters passed to the KeplerGl component is the API token for accessing the MapBox service.
To obtain a token, you need to register at www.mapbox.com . MapBox provides a choice of several different tariff plans, but for small applications, a free version with 50,000 views per month will suffice.
After creating an account, you need to go to the tokens section and form a public key to access the service.
Set the resulting token to the appropriate environment variable:
export MapboxAccessToken=<your_mapBox_token>Now you can proceed to the creation of a React component to display information about paid parking. In our case, it will be just a wrapper over the KeplerGl component, which takes the dimensions of the map as parameters:
import React from'react';
import KeplerGl from'kepler.gl';
const mapboxAccessToken = process.env.MapboxAccessToken;
const ParkingMap = (props) => (
    <KeplerGlid="parking_map"mapboxApiAccessToken={mapboxAccessToken}width={props.width }
          height={props.height }
    />
);
export default ParkingMap;
Add ParkingMap to the app. At this stage, instead of information about parking lots, a map is displayed without any information, because we have not yet transmitted the data on the basis of which our visualizations are built.
We load data and configurations of the card
In order to display your data on the map, you need to transfer a set of data to KeplerGl, on the basis of which the map will be created, and the desired configuration of the final visualization. This can be done using one of two methods - addDataToMap or updateVisData.
The first method allows you not only to load the required data set and fully set / update the configuration of the corresponding instance of the KeplerGl component, including the visualization settings (visState) and maps (mapState), as well as the style of the map used (mapStyle).
As a parameter of the method addDataToMap takes an object containing the following information:
- used data sets for building visualization
- additional configuration options (options)
- configuration data, including mapState, mapStyle, visState
addDataToMap({
    datasets: { … }
    options: { … }
    config: {
        mapState { … },
        mapStyle { … },
        visState: { … }
    }
});
Note. The data from the configuration object always takes precedence over the settings passed in the “options” object.
The updateVisData method allows updating only used datasets without completely changing the configuration of the component used. As a parameter, it is the same as the first method accepts an object that contains information about a new set or data set and the “options” parameter to update some map display settings.
Card Initialization
Thus, for the initial data load, we need the addDataToMap method. In the demo application that is being created, the database of paid parking lots in Moscow is downloaded when you first access the application with a separate request. The received initial data must be prepared for loading into KeplerGl. In most cases, one of the predefined processors that port csv / json data to the data format supported by kepler.gl is sufficient for this.
exportfunctionloadParkingData(mapMode) {
        return(dispatch) => {
            dispatch( requestParkingData() );
            fetch(demoDataUrl)
                    .then(response => response.text())
                    .then(source => {
                            dispatch( getParkingData() );
                const data = Processors.processCsvData(source);
                const config = getMapConfig(mapMode);
                const datasets = [{ info, data }];
                dispatch(
                    wrapTo('parking_map',
                        addDataToMap({
                            datasets,
                            config
                        })
                    ));
            });
        };
}
Switching between modes
To switch between map views, we need to define another action function. Since in the current version of KeplerGl there is no simple way to change only the map configuration without affecting the data, the addDataToMap method will also be the most appropriate method for switching between modes:
exportfunctiontoggleMapMode(mode) {
    return(dispatch, getState) => {
            const config = getMapConfig( mode );
            const datasets =  getDatasets(getState());
            dispatch(
               wrapTo('parking_map',
                     addDataToMap({
                          datasets,
                          config
                     })
               ));
            dispatch( setMapMode(mode) );
        };
}
The dataset parameter is mandatory, so every time when switching the map view mode we will retransmit the original data set loaded at the start of the application. The card configuration information will be updated every time. In this article I will not elaborate on how the getMapConfig and getDatasets helper methods are implemented, the source code of which you can view on GitHub.
Note. Currently, the KeplerGl API is very limited and designed for the most basic cases (adding and updating data). At the same time, the developers themselves recognize that the current version does not provide an effective method for updating configurations only or for real-time data updating. However, we should not forget that the project is in the stage of active development and there is hope for a speedy expansion of its functionality.
Customize the map elements
KeplerGl includes not only a container with geo-visualization, but also map controls, a tooltip, a sidebar for managing the displayed data, a dialog box for loading data in csv, json or geojson format, etc. At the same time, each of the listed components can be easily replaced with its own version using the dependency injection system.
In order to replace the base component with its customized version is enough:
- import default component factory
- define a new factory returning a custom component
- embed a new factory using the injectComponents method
In the demo application we are creating, we don’t want to allow the user to independently configure the view mode, filter the existing one or load new data.
In theory, it is enough to indicate that the KeplerGl component is in read only mode, which appeared only in version 0.0.27. However, even in this version, all controls are still displayed to the user for the first few moments before the map is loaded, and then hidden. To avoid this, we can explicitly replace unwanted components with a null component using the injectComponents method:
import React from'react';
import {
    injectComponents,
    ModalContainerFactory,
    SidePanelFactory,
} from'kepler.gl/components';
// define null factory to don not render any unnecessary componentsconst NullComponent = () =>null;
const nullComponentFactory = () => NullComponent;
const KeplerGl = injectComponents([
   [ModalContainerFactory, nullComponentFactory],
   [SidePanelFactory, nullComponentFactory],
]);
exportdefault KeplerGl;
Conveniently, KeplerGl not only allows you to replace basic components with customized ones, but using the withState method, you can add additional actions and state parameters for new components.
How to use multiple cards simultaneously
If you plan to use several different KeplerGL components within the same application, then each of them in the parameters must specify a unique id, which is required to add / update data and configurations of each of the maps:
const wrapToParking = wrapTo(' parking_map');
dispatch(
    wrapToParking(
        addDataToMap({
            datasets,
            config
        })
    ));
An alternative is to use the connect function from Redux and the forwardTo function from kepler.gl. In this case, it is sufficiently simple for the corresponding dispatcher function to specify the id of the corresponding card:
import KeplerGl from'kepler.gl';
import { forwardTo, toggleFullScreen } from'kepler.gl/actions';
import {connect} from'react-redux';
const MapContainer = props => (
  <div>
        <button onClick=() => props.keplerGlDispatch(toggleFullScreen())/>
        <KeplerGl id="foo" />
  </div>
)
const mapStateToProps = state => state
const mapDispatchToProps = (dispatch, props) => ({
    dispatch,
    keplerGlDispatch: forwardTo(‘foo’, dispatch)
});
Conclusion
KeplerGl allows you to add colorful, interactive maps to a web application based on React. Thanks to the use of the desk.gl component, it can easily display millions of geo-points in a convenient format for viewing and analyzing them.
The wide possibilities for customizing not only created visualizations, but also map styles, as well as user interaction formats, make KeplerGl a very attractive tool for creating complex cartographic visualizations and dashboards.
However, limited to basic API scripts, processing data on the client, and using MapBox without being able to select another source of maps, reduces the number of projects for which this tool can be used.
But do not forget that today the project is still very young and is in the active phase of development, so that many of these shortcomings may become irrelevant in the near future.
useful links
- Full demo code
- Introduction to Kepler.Gl on Habr
- The kepler.gl repository on github
- Official documentation on kepler.gl [ru]
- Tutorial on kepler.gl on Vis.Academy [en]