March 12, 2014 at 17:32
Monitoring Information Security Events with ZABBIX

When I first saw Zabbix, I thought, why not try to use it as a solution for monitoring information security events. As you know, in the enterprise’s IT infrastructure there are many different systems that generate such a stream of information security events that it is simply impossible to view them all. Now in our corporate monitoring system there are hundreds of services that we observe with a great degree of detail. In this article, I consider the features of using Zabbix as a solution for monitoring information security events.
What allows Zabbix to solve our problem? About the following:
- Maximum automation of inventory processes, vulnerability management, compliance with security policies and changes.
- Real-time protection of corporate resources through automatic monitoring of information security.
- The ability to get the most reliable picture of network security.
- Analysis of a wide range of complex systems: network equipment, such as Cisco, Juniper, Windows, Linux, Unix, MSQL, Oracle, MySQL, etc., network applications and web services.
- Minimization of audit costs and security control.
In the article I will not consider all of the above, we will only touch on the most common and simple questions.
Training
So, for starters, I installed the Zabbix monitoring server. We will use the FreeBSD OS as a platform. I think that there is no need to tell in detail about the installation and configuration process, rather detailed documentation in Russian is on the developer's website, starting from the installation process to describing all the system capabilities.
We will assume that the server is installed, configured, as well as configured web-frontend to work with it. At the time of writing, the system is running OS FreeBSD 9.1, Zabbix 2.2.1.
MS Windows Server Security Event Monitoring
Using the Zabbix monitoring system, you can collect any available information from Windows system logs with an arbitrary degree of detail. This means that if Windows writes an event to the log, Zabbix “sees” it, for example by Event ID, text, or binary mask. In addition, using Zabbix, we can see and collect a huge number of events interesting for security monitoring, for example: running processes, open connections, drivers loaded into the kernel used by dll, logged in via the console or remote user access, and much more.
All that remains is to identify the events that occur during the realization of the threats we expect.
When establishing a solution for monitoring IS events in the IT infrastructure, one should take into account the need to choose a balance between the desire to track everything in a row and the ability to process a huge amount of information on IS events. Here Zabbix opens up great possibilities for choice. Zabbix key modules are written in C / C ++, the speed of recording from the network and processing of monitored events is 10 thousand new values per second on a more or less ordinary server with a correctly configured DBMS.
All this gives us the opportunity to monitor the most important security events on the monitored host on Windows.
So, for starters, consider a table with Event ID, which, in my opinion, can obviously be used to monitor information security events:
IB events Windows Server Security Log
| Description of EventID | 2008 server | 2003 server |
| Clearing the audit log | 1102 | 517 |
| Account Login Successful | 4624 | 528, 540 |
| Account Failed to Log In | 4625 | 529-535, 539 |
| User account created | 4720 | 624 |
| Trying to reset your account password | 4724 | 628 |
| Disabled user account | 4725 | 629 |
| User account deleted | 4726 | 630 |
| Secure Local Security Group Created | 4731 | 635 |
| Member added to protected local group | 4732 | 636 |
| Removed member from protected local group | 4733 | 637 |
| Deleted Secure Local Security Group | 4734 | 638 |
| Secure Local Security Group changed | 4735 | 639 |
| User account changed | 4738 | 642 |
| User account locked | 4740 | 644 |
| Account Name Has Been Changed | 4781 | 685 |
I pay attention to local security groups, but in more complex AD schemes it is necessary to consider the same general and global groups.
In order not to duplicate information, more details about critical events can be found in the article:
http://habrahabr.ru/company/netwrix/blog/148501/
Methods of monitoring events of information security MS Windows Server
Consider the practical application of this task.
To collect data, you need to create a new data item:
Ключ: eventlog[Security,,,,1102|4624|4625|4720|4724|4725|4726|4731|4732|4733|4734|4735|4738|4781]
Тип элемента данных: Zabbix агент (активный)
Тип информации: Журнал (лог)
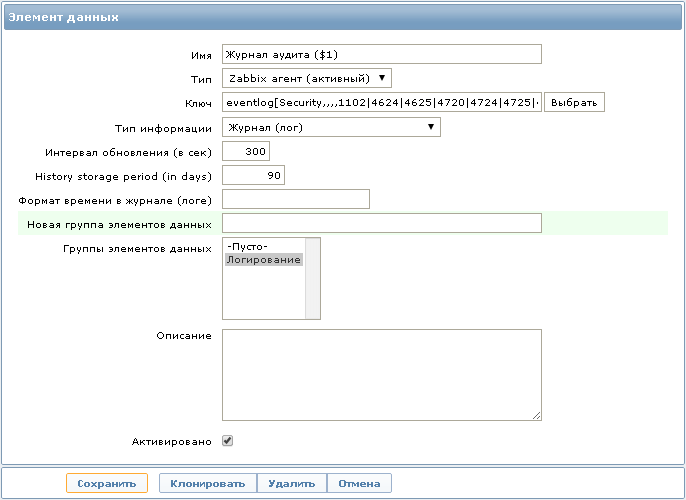
If desired, for each Event ID, you can create a separate data element, but I use several Event IDs in one key to store all the records in one place, which allows me to quickly search for the necessary information without switching between different data elements.
I want to note that in this key, we use the Security event log as a name.
Now that we have received the data item, we need to configure the trigger. A trigger is a Zabbix mechanism that allows you to signal that any of the monitored events has occurred. In our case, this is an event from the server log or MS Windows workstation.
Now everything that will record the audit log with the specified Event ID will be transferred to the monitoring server. Specifying a specific Event ID is useful in that we get only the necessary information, and nothing more.
Here is one of the trigger expressions:
{Template Windows - Eventlog 2008:eventlog[Security,,,,1102|4624|4625|4720|4724|4725|4726|4731|4732|4733|4734|4735|4738|4781].logeventid(4624)}=1&{Template Windows - Eventlog 2008:eventlog[Security,,,,1102|4624|4625|4720|4724|4725|4726|4731|4732|4733|4734|4735|4738|4781].nodata(5m)}=0
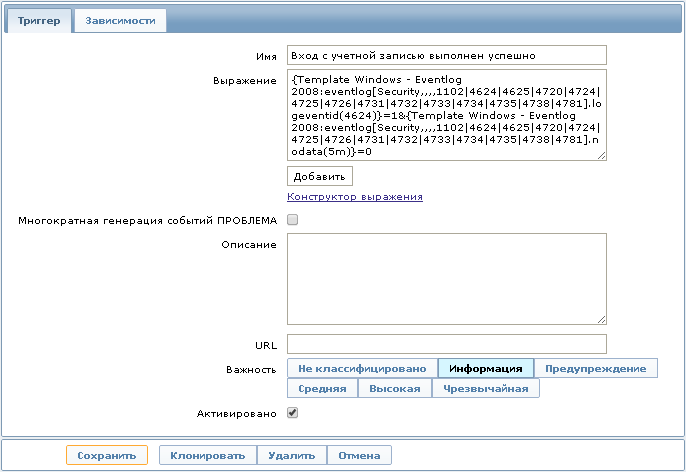
This expression will allow you to display on the Dashboard the information that “Logging in with the account was successful”, which corresponds to Event ID 4624 for MS Windows Server 2008. The event will disappear after 5 minutes if no re-login was made during this time.
If you need to track a specific user, for example, “Administrator”, you can add regexp verification to the trigger expression:
&{Template Windows - Eventlog 2008:eventlog[Security,,,,1102|4624|4625|4720|4724|4725|4726|4731|4732|4733|4734|4735|4738|4781,,skip].regexp(Администратор)}=1
Then the trigger will work only if you log in to the system specifically under the account with the name “Administrator”.
PS
We considered the simplest example, but more complex constructions can also be used. For example, using login types, error codes, regular expressions, and other parameters.
Thus, tons of messages generated by Windows systems will be checked by Zabbix, not our eyes. We can only look at the Zabbix Dashboard.
Additionally, I have configured to send notifications by e-mail. This allows you to quickly respond to events, and not miss events that occurred, for example, after hours.
Unix systems security event monitoring
Zabbix monitoring system also allows you to collect information from the log files of the Unix family OS.
IB events on Unix systems suitable for everyone
Such security problems of the Unix family systems are all the same attempts to select passwords for accounts, as well as the search for vulnerabilities in authentication tools, for example, such as SSH, FTP and others.
Some critical events on Unix systems
Based on the foregoing, it follows that we need to monitor the actions associated with adding, changing and deleting user accounts in the system.
Also an important fact will be tracking login attempts. Changes to key files like sudoers, passwd, etc / rc.conf, contents of directories /usr/local/etc/rc.d presence of running processes, etc.
Security Monitoring Methods on Unix Systems
Consider the following example. You need to track logins, failed login attempts, password guessing attempts in the FreeBSD system using the SSH protocol.
All information about this is contained in the log file /var/log/auth.log.
By default, the rights to this file are 600, and it can only be viewed with root privileges. We'll have to sacrifice a little local security policy, and allow this group of users to read this file zabbix:
Change the file permissions:
chgrp zabbix /var/log/auth.log
chmod 640 /var/log/auth.log
We will need a new data item with the following key:
log[/var/log/auth.log,sshd,,,skip]
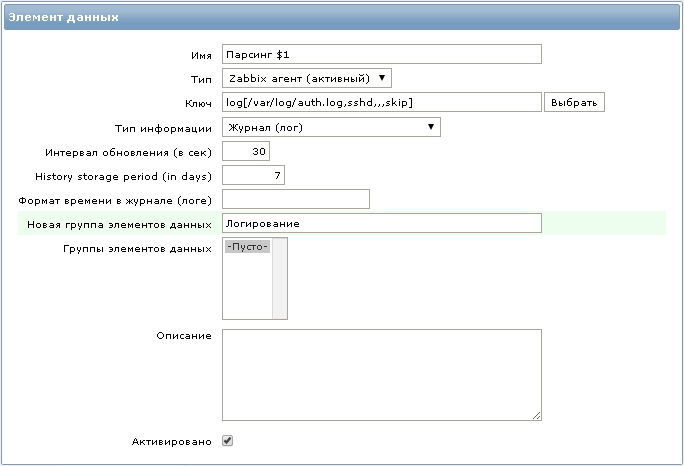
All lines in the /var/log/auth.log file containing the word “sshd” will be sent by the agent to the monitoring server.
Next, you can configure a trigger with the following expression:
{Template FreeBSD - SSH:log[/var/log/auth.log,sshd,,,skip].regexp(error:)}|{Template FreeBSD - SSH:log[/var/log/auth.log,sshd,,,skip].regexp(Wrong passwordr:)}&{Template FreeBSD - SSH:log[/var/log/auth.log,sshd,,,skip].nodata(3m)}=0
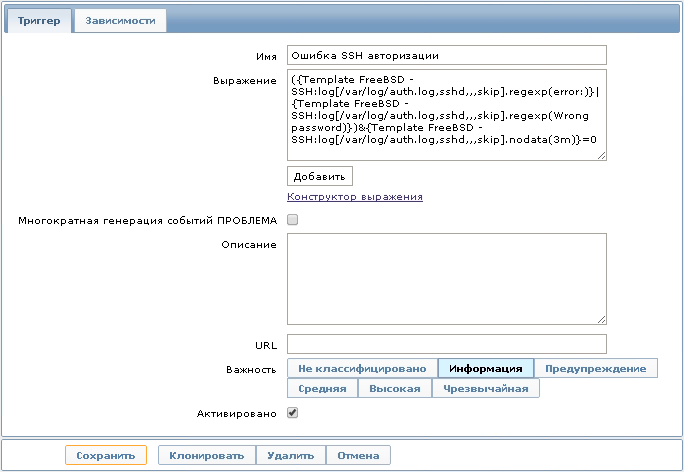
This expression is defined as a problem when entries in the log file appear that are selected by the regular expression “error:”. Having opened the history of the received data, we will see errors that occurred during authorization using the SSH protocol.
Here is an example of the last value of the data element that triggers this trigger:

Consider another example of security monitoring in FreeBSD:
Using the Zabbix agent, we can verify the checksum of the / etc / passwd file.
The key in this case will be as follows:
vfs.file.cksum[/etc/passwd]
This allows you to control account changes, including changing the password, adding or removing users. In this case, we will not know what specific operation was performed, but if no one has access to the server except you, then this is an occasion for a quick response. If you need to conduct a more detailed policy, then you can use other keys, for example, user parameters.
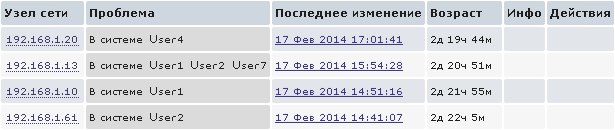
For example, if we want to get a list of users who are currently logged on to the system, you can use this user parameter:
UserParameter=system.users.list, /bin/cat /etc/passwd | grep -v "#" | awk -F\: '{print $$1}'
And, for example, configure the trigger to change in the resulting list.
Or you can use such a simple parameter:
UserParameter=system.users.online, /usr/bin/users
So we will see on the Dashboard who is currently in the system:
Monitoring IS events on network devices
Using Zabbix, you can also very effectively monitor IB events on Cisco and Juniper network devices using SNMP. Data transmission from devices is carried out using the so-called traps (SNMP Trap).
From the point of view of information security, the following events can be distinguished that need to be monitored - changes in equipment configurations, execution of commands on the switch / router, successful authorization, failed login attempts, and much more.
Monitoring methods
Consider again the authorization example:
As a stand, I will use the GNS3 emulator with the Cisco 3745 router. I think many people are familiar with this scheme.
First, we need to configure sending SNMP traps from the router to the monitoring server. In my case, it will look like this:
login block-for 30 attempts 3 within 60
login on-failure log
login on-success log
login delay 5
logging history 5
snmp-server enable traps syslog
snmp-server enable traps snmp authentication
snmp-server host 192.168.1.1 public
We will send events from Syslog and authentication ladders. I note that successful and unsuccessful authorization attempts are written exactly in Syslog.
Next, you need to configure the reception of the SNMP traps we need on the monitoring server.
Add the following lines to snmptt.conf:
EVENT clogMessageGenerated .1.3.6.1.4.1.9.9.41.2.0.1 "Status Events" Normal
FORMAT ZBXTRAP $ar $N $*
SDESC
EDESC
In our example, we will catch the Syslog ladders.
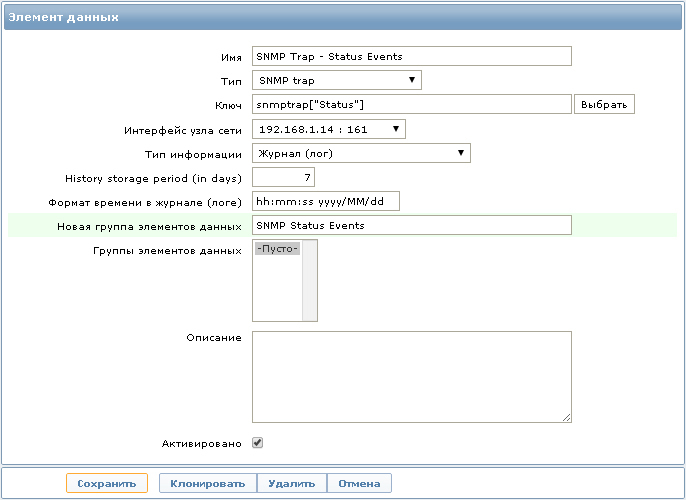
Now you need to configure the data item to collect statistics with the following key:
snmptrap[“Status”]
If the ladder is not configured on the monitoring server, then the following entries will appear in the server log:
unmatched trap received from [192.168.1.14]:...
As a result, information about login attempts with detailed information (user, source, localport and reason in case of failure) will be reflected in the received log:

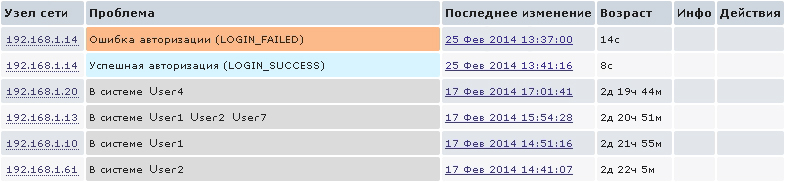
Well, you can configure the trigger to display the event on the Dashboard:
{192.168.1.14:snmptrap["Status"].regexp(LOGIN_FAILED)}&{192.168.1.14:snmptrap["Status"].nodata(3m)}=0
In combination with the previous paragraph, we will have information on such a plan on the Dashboard:
Similarly to the above example, you can monitor a large number of events occurring on Cisco routers, for the description of which one article is clearly not enough.
I want to note that the above example will not work on Cisco ASA and PIX products, since work with authorization logging is organized somewhat differently there.
Juniper and Syslog
As another example, we will examine authorization monitoring in JunOS 12.1 for Juniper devices.
Here we cannot use SNMP traps, because there is no support for sending traps from Syslog messages. We need a Unix-based Syslog server, in our case it will be the same monitoring server.
On the router, we need to configure Syslog sending to the storage server:
system syslog host 192.168.1.1 authorization info
Now all authorization messages will be sent to the Syslog server, of course you can send all messages (any any), but we do not need an excess of information, we send only the necessary.
Next, go to the Syslog server.
We look at tcpdump if messages are coming:
tcpdump -n -i em0 host 192.168.1.112 and port 514
12:22:27.437735 IP 192.168.1.112.514 > 192.168.1.1.514: SYSLOG auth.info, length: 106
By default, in the syslog.conf settings, everything that comes with auth.info should be written to /var/log/auth.log. Next, we do everything similarly to the example with monitoring inputs in Unix.
Here is an example of a line from the log:

It remains only to configure the trigger for this event in the same way as it was considered in the example with authorization on a Unix server.
PS
In this way, you can track a lot of events, among which are: saving the device configuration (commit), entering and exiting configuration editing mode (edit).
I also want to note that in a similar way it is possible to monitor on Cisco devices, but the method with SNMP traps seems faster and more convenient for me, and the need for an intermediate Syslog server is eliminated.
Conclusion
In conclusion, I want to note that I will be happy to accept the comments and additions to this article, as well as interesting suggestions for using information security event monitoring using Zabbix.
Thanks for attention. :)