Android development in NetBeans IDE without plugins. Part 2
- Tutorial
We continue the experiment we started on setting up the NetBeans IDE for programming for Android. Last time, we managed to create a project in NetBeans, configure the build system, and also make the application launch automatically. In addition, we looked a little at how the build system is built from the inside. In the second part of the article, we will go further and see how in NetBeans you can debug, create library projects, as well as add libraries to projects and work with unit tests.
Interestingly, there are two ways to debug NetBeans. The first method will not even require any witchcraft in ant. The second one will be a little more complicated to set up, but in some cases it comes in handy, and even more like what is in Eclipse.
Before you start doing something, you need to think about a tool called monitor. It is located in a folder
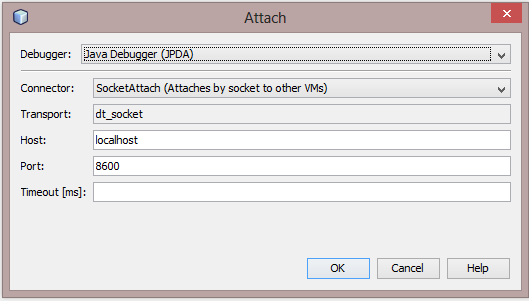
After the monitor is open, you need to start the application, if it is not already running, and see through which port you need to connect to the debugger. The port is written opposite the application. By default, they have an 860x circuit. You can also click one of the applications to assign port 8700 to it. After that, in NetBeans you need to connect to this port through the Attach Debugger command. We select the parameters Socket Attach, localhost, the necessary port ... And that's it, you can safely debug further.
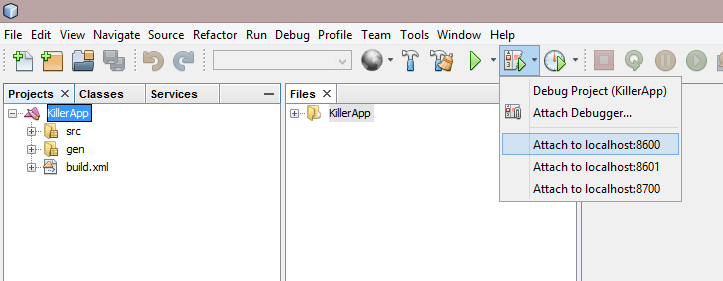
The button in the panel remembers recently entered configurations, so the next time you don’t even have to enter anything.
I pay special attention to the fact that monitor is called not only to look at ports. It also acts as an intermediary in connecting to the virtual machine, so if it is not running, it will not work to connect at random to port 8600.
This debugging method has the advantage that you can connect and disconnect at any time. This is important because with a connected debugger, Dalvik VM starts to slow down noticeably. Sometimes this is not critical, but not always, so the ability to reach a certain point of execution in a program without a debugger is sometimes not at all superfluous.
There is another tool that helps you connect the debugger at a specific point. You can, of course, create a breakpoint by condition, but, as I said, with a connected debugger, everything does not work very well. Therefore, you can insert a call in the code
But sometimes you need to start debugging at the time the program starts. You can use the same call to the aforementioned method, or you can configure NetBeans a second way to start debugging.
The second method will act in the same way as in Eclipse: we start debugging, and the application itself starts. After that, it waits for the debugger to connect, and only then continues to run. NetBeans will help us here. If you try to debug (
The file starts by loading properties from a file
Now you can figure out what this file does. The main task here is
After that, you can run the application itself. In a previous article, we already did this from ant using the command line. To do this, use the command
The file
Thus, after all these frauds
I myself use the second method much less often than the first, due to the fact that, as I said, when connecting the Dalvik debugger, the VM starts to render slow-thinking, so getting to the debugged area in the application becomes longer. But, if the problem occurs when you start the application, this method is just what you need.
The library can be a precompiled jar file, or it can be a separate Android project that needs to be compiled before being included in the project. They are connected, respectively, in different ways.
In the case of a precompiled file, there are very few steps:
In the case of the library project, everything is a little trickier. You can add it with a command (and this is the official way), or you can add it with a line in the configuration file. For those who like the official way , we need the following command: Let's try to add, for example, the support library v7 appcompat, which Google has made for those who want to see the action bar on versions of Android up to 3.0. It is just distributed not as a precompiled jar-file, but as a library project, because there are additional resources. Let's say that it lies in the same folder as our main project. All! You can already compile the project. If we look at the file , we will find a line in this configuration file
Actually, that’s all that that team did. In exactly the same way you can add new library without any command, the main thing just do not forget to increase the number of libraries to yedinichku:
Of course, as with the precompiled file, you must remember to add the source folders of the library project mentioned in the project in the Java Sources Classpath, as well as the libraries that it uses (if we also use them). That is, it is worth adding folders
What if we want to create our own project? Creating a library project is exactly the same as creating a regular project with the exception that you need a slightly different command:
The main difference is that it is entered
As you know, in Android, unfortunately, you cannot embed unit tests directly into a project, and you need to create a separate project for this action. Like creating a library project, all the steps are very similar to creating a regular project, but a little more nuances. You will need the following command: Projects for tests are usually created in a subfolder of the main project, so we will create such a project from the main project folder: Next, you can continue creating a new project in NetBeans in the same way as in the case of a regular project. But this time, we can leave the item in the third step when we assign ant tasks to different menu items. But now it’s worth removing and leaving only , since we still have nothing to launch here.
For a regular project, after that we added files related to launching the application, but this time we do not need it. But what can be done is to add files that will help us debug tests and run them selectively.
First you need to generate a file for additional jobs in NetBeans. We are interested in running individual files, debugging and debugging individual files. All these actions can be generated by clicking on
The task is
Then there were tasks in which we need to perform debugging. In order to do it, you need to start testing first, indicating to wait for the debugger, and then connect. But there is a small snag: testing starts with a lock, and we need to run another task. The mission will save us
Now we can summarize what we have done. In total, a very good amount of opportunities was obtained:
Projects are created by one command from the command line and a couple of additional files that are universal for each project, so everything is quite simple in terms of labor costs. What we are missing compared to what is already in Eclipse or Android Studio:
Editing XML files is not so critical, but, of course, without a WYSIWYG editor, it's pretty sad to edit the interface. Therefore, I personally import the project into Eclipse and edit the interface there when required.
I also want to say a few words about the applicability of such tools. In the comments to the previous article, similar questions arose, so once again I remind you: this is an experiment. If there is an official build system through ant that is independent of the IDE, then it was difficult for me to resist and not try to use it to configure a tool that was not originally designed to work with Android.
In addition, in fact, it is not necessary to use NetBeans to use this system. After setting up the project, you can simply type in the command line, for example,
Debugging
Interestingly, there are two ways to debug NetBeans. The first method will not even require any witchcraft in ant. The second one will be a little more complicated to set up, but in some cases it comes in handy, and even more like what is in Eclipse.
Method number 1
Before you start doing something, you need to think about a tool called monitor. It is located in a folder
/tools After the monitor is open, you need to start the application, if it is not already running, and see through which port you need to connect to the debugger. The port is written opposite the application. By default, they have an 860x circuit. You can also click one of the applications to assign port 8700 to it. After that, in NetBeans you need to connect to this port through the Attach Debugger command. We select the parameters Socket Attach, localhost, the necessary port ... And that's it, you can safely debug further.
The button in the panel remembers recently entered configurations, so the next time you don’t even have to enter anything.
I pay special attention to the fact that monitor is called not only to look at ports. It also acts as an intermediary in connecting to the virtual machine, so if it is not running, it will not work to connect at random to port 8600.
This debugging method has the advantage that you can connect and disconnect at any time. This is important because with a connected debugger, Dalvik VM starts to slow down noticeably. Sometimes this is not critical, but not always, so the ability to reach a certain point of execution in a program without a debugger is sometimes not at all superfluous.
There is another tool that helps you connect the debugger at a specific point. You can, of course, create a breakpoint by condition, but, as I said, with a connected debugger, everything does not work very well. Therefore, you can insert a call in the code
Debug.waitForDebugger(). As soon as the program reaches this method, it will stall, and execution will continue only after connecting the debugger. But sometimes you need to start debugging at the time the program starts. You can use the same call to the aforementioned method, or you can configure NetBeans a second way to start debugging.
Method number 2
The second method will act in the same way as in Eclipse: we start debugging, and the application itself starts. After that, it waits for the debugger to connect, and only then continues to run. NetBeans will help us here. If you try to debug (
CTRL+F5), NetBeans will offer to generate an ant-file, which will tell him how it should be done in our project. That is what we need. After that, a file is nbprojectopened in the project subfolder ide-file-targets.xml, the contents of which need to be replaced with the following:The file starts by loading properties from a file
debug.propertiesthat you need to drop into the same folder with the following contents:jpda.host=localhost
jpda.address=8700
jpda.transport=dt_socket
Now you can figure out what this file does. The main task here is
debug-nbthat NetBeans starts when debugging starts, and it depends on the tasks -init, -launch-monitorand -launch-debug. There is -initnothing particularly interesting, the task simply loads and checks the variables from the file debug.properties. But now it’s -launch-monitormore convenient: after all, we need to start the monitor, if it is not already running, and this task just takes on the task. There is a good task in ant that allows you to see if a program is listening on a specific port or not socket. By this symptom, you can just determine whether the monitor is working or not. If not, then you need to start it and wait (taskwait-for) After starting, it’s still worth waiting two seconds for the monitor to start accepting connections (the value may need to be slightly adjusted depending on the specific configuration of the equipment). After that, you can run the application itself. In a previous article, we already did this from ant using the command line. To do this, use the command
adb shell am start -a android.intent.action.MAIN -n <пакет приложения>/<активность>. This time we will analyze the command a little more. adb shellIs a command that allows you to work directly with the command line inside Android. am- This is an activity manager who has a pretty impressive range of features; You can read about them in the official documentation . We only need a command startto start the desired activity, which we indicate after the key -n, and the key-asets, as has probably become clear, an intention. The file
custom_rules.xmlalready has a job that gives you need to run parameters: -find-main-activity. This time we need to start the application in the same way as last time, but with a key -Dso that after starting the application does not immediately continue to work, but first wait for the debugger. Thus, after all these frauds
debug-nbhave been completed, everything is ready to start : monitor is running, the application is running and the debugger is waiting. It remains only to connect it using the task nbjpdaconnect. As the name implies, this task is purely specific to NetBeans.I myself use the second method much less often than the first, due to the fact that, as I said, when connecting the Dalvik debugger, the VM starts to render slow-thinking, so getting to the debugged area in the application becomes longer. But, if the problem occurs when you start the application, this method is just what you need.
Adding Libraries and Creating Library Projects
The library can be a precompiled jar file, or it can be a separate Android project that needs to be compiled before being included in the project. They are connected, respectively, in different ways.
In the case of a precompiled file, there are very few steps:
- You need to drop the file into the folder of the
libsmain project folder. - In the project properties on the Java Sources Classpath tab, you must add the file path. Actually, you don’t have to do this, but then the IDE will not tell us the code from this library, which negates the benefits of using the IDE.
In the case of the library project, everything is a little trickier. You can add it with a command (and this is the official way), or you can add it with a line in the configuration file. For those who like the official way , we need the following command: Let's try to add, for example, the support library v7 appcompat, which Google has made for those who want to see the action bar on versions of Android up to 3.0. It is just distributed not as a precompiled jar-file, but as a library project, because there are additional resources. Let's say that it lies in the same folder as our main project. All! You can already compile the project. If we look at the file , we will find a line in this configuration file
android update project -p <путь к проекту> -l <путь к библиотеке относительно проекта>
android update project -p KillerApp -l ../AndroidCompatibilityPackage-v7-appcompat
project.propertiesandroid.library.reference.1=../AndroidCompatibilityPackage-v7-appcompat
Actually, that’s all that that team did. In exactly the same way you can add new library without any command, the main thing just do not forget to increase the number of libraries to yedinichku:
android.library.reference.2, android.library.reference.3and so on. Of course, as with the precompiled file, you must remember to add the source folders of the library project mentioned in the project in the Java Sources Classpath, as well as the libraries that it uses (if we also use them). That is, it is worth adding folders
src, genand jar files in the libslibrary project folder . What if we want to create our own project? Creating a library project is exactly the same as creating a regular project with the exception that you need a slightly different command:
android create lib-project -n <имя проекта> -t android-<уровень API> -p <путь к проекту> -k <пакет программы>
The main difference is that it is entered
lib-projectinstead project. In addition, you do not need to specify the name of the main activity, since the library does not have to be launched directly. Further, the creation of the project continues as for a regular project.Creating projects for tests
As you know, in Android, unfortunately, you cannot embed unit tests directly into a project, and you need to create a separate project for this action. Like creating a library project, all the steps are very similar to creating a regular project, but a little more nuances. You will need the following command: Projects for tests are usually created in a subfolder of the main project, so we will create such a project from the main project folder: Next, you can continue creating a new project in NetBeans in the same way as in the case of a regular project. But this time, we can leave the item in the third step when we assign ant tasks to different menu items. But now it’s worth removing and leaving only , since we still have nothing to launch here.
android create test-project -p <путь к проекту> -n <название проекта> -m <путь к основному проекту относительно проекта для тестов>
android create test-project -p tests -n KillerAppTest -m ..
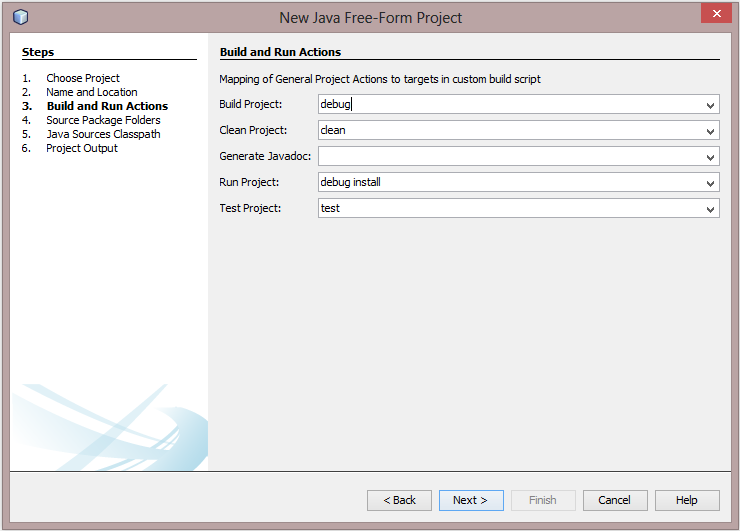
testRun Projectlaunchdebug installFor a regular project, after that we added files related to launching the application, but this time we do not need it. But what can be done is to add files that will help us debug tests and run them selectively.
First you need to generate a file for additional jobs in NetBeans. We are interested in running individual files, debugging and debugging individual files. All these actions can be generated by clicking on
CTRL+F6, CTRL+F5and CTRL+SHIFT+F5. After that, nbprojectyou need to upload the files to the folder again, as when adding debugging to a regular project in the second way, only the file ide-file-targets.xmlwill be slightly different. The beginning of the file is the same as in the case of debugging a regular project, so I do not copy the entire file. Those interested can watch it on BitBucket. But then we have other tasks:Must set property 'run.class' Running tests in ${run.class}... Must set property 'debug.class' Debugging tests in ${debug.class}... The task is
run-selected-file-in-srcneeded to run individual tests. It uses a macro run-tests-helperthat is defined in the Android build system with additional parameters. In fact, all that this macro does is launch a command adb shell am instrumentwith parameters for testing the program (yes, this is again the activity manager). We add arguments to the command launch -e class <тестируемый класс>, so the device will not run all the tests indiscriminately, but rather focus on a specific file. Then there were tasks in which we need to perform debugging. In order to do it, you need to start testing first, indicating to wait for the debugger, and then connect. But there is a small snag: testing starts with a lock, and we need to run another task. The mission will save us
parallelthat runs different jobs together. The result is framed as a macro so that you can control with what parameters testing is called. Accordingly, our debugging tasks simply invoke it, with additional parameters, if necessary.Total
Now we can summarize what we have done. In total, a very good amount of opportunities was obtained:
- Full assembly and launch of projects;
R.javaManual generation ;- Launching debugging projects;
- Adding libraries and library projects;
- Creation of projects for testing;
- Running individual tests with debugging capabilities;
- Tips and autocomplete.
Projects are created by one command from the command line and a couple of additional files that are universal for each project, so everything is quite simple in terms of labor costs. What we are missing compared to what is already in Eclipse or Android Studio:
- Interface editing;
- Editing XML files with hints;
- Go to resource declaration.
Editing XML files is not so critical, but, of course, without a WYSIWYG editor, it's pretty sad to edit the interface. Therefore, I personally import the project into Eclipse and edit the interface there when required.
I also want to say a few words about the applicability of such tools. In the comments to the previous article, similar questions arose, so once again I remind you: this is an experiment. If there is an official build system through ant that is independent of the IDE, then it was difficult for me to resist and not try to use it to configure a tool that was not originally designed to work with Android.
In addition, in fact, it is not necessary to use NetBeans to use this system. After setting up the project, you can simply type in the command line, for example,
ant debug install launchto build and run the project. And, unlike a self-made script assembly , it will be a complete assembly - exactly the same as Eclipse with ADT does: with the generation of interfaces from AIDL, BuildConfig, RenderScript, zipalign, ProGuard and all the rest. As for using it to program in NetBeans, this, of course, is already an amateur. But, in any case, I personally was very interested in conducting this experiment and I hope that others were interested in reading about it.