Sensu - monitoring framework
- Tutorial

A bit of history
In 2011, a movement emerged in the DevOps environment, united under the hashtag #monitoringsucks and criticized existing monitoring systems for lack of flexibility. What exactly did not suit them is perfectly illustrated by this presentation .
In short - people want a certain API standard for interaction between monitoring components, and of the appearance of these components themselves, in order to build flexible and smart monitoring from them.
The result of this wave of discontent was a massive discussion of problems and drawing attention to interesting utilities such as Sensu and Riemann .
In 2013, the hashtag in the community has changed - now it's #monitoringlove. This happened due to the development of opensource monitoring utilities.
Of the new utilities, Sensu is of most interest. I did not seriously consider Riemann, because at the moment it does not have any means to ensure fault tolerance, and I don’t really like the idea of writing a config on Clojure.
It is about Sensu that I will talk about in this article, I will describe the basic principles of work and give an example of solving a typical monitoring task.
Key facts about Sensu:
* Written in Ruby, uses EventMachine (I would prefer Python, but okay).
* Configs in JSON
* Can use plugins from Nagios.
* It works through RabbitMQ, in PUSH mode, when clients themselves send the
results of checks to the server as soon as they are ready.
* There are DEB, RPM and even MSI packages.
* There are modules for puppet and cookbook for Chef.
The image below shows the operation of Sensu. In my opinion, everything is very logical, and such a work scheme gives scaling and fault tolerance out of the box.
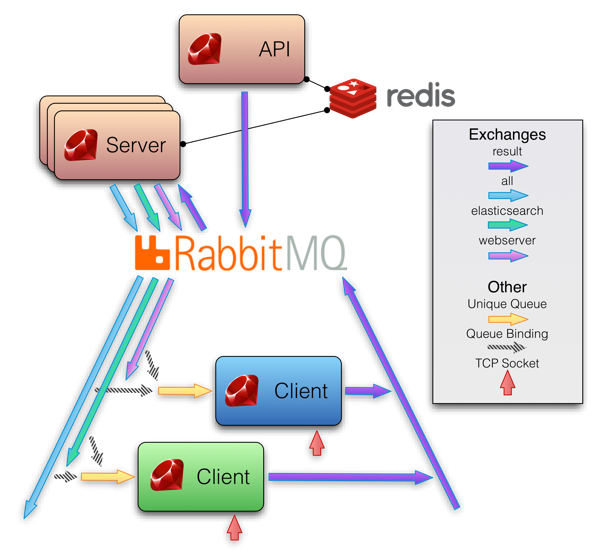
The system consists of three main components: sensu-server, sensu-api, and sensu-clients. Sensu-dashboard is also available. The installation is trivial and covered in detail in the documentation, for the latest version 0.12 currently availablehere . As I mentioned, there are deb, rpm, and msi packages.
Basic concepts
In order to understand how all this works, you need to understand the terminology. I do not aim to translate the official documentation, but I want to give basic concepts so that it is clear what will be discussed in the future.
We have the following entities:
Client
This is a certain server with installed and configured sensu-client, which publishes information about itself in RabbitMQ and is thus registered in the Sensu monitoring system. From the Sensu server, he receives a set of checks, and performs them, adding the result to RabbitMQ.
For self-identification, he needs a configuration that looks something like this (taken from the documentation):
{
  "client": {
    "name": "i-424242",
    "address": "127.0.0.1",
    "subscriptions": [
      "production",
      "webserver",
      "mysql"
    ]
  }
}
Everything is pretty obvious, with the exception of “subscriptions”. Subscriptions are a list of the roles associated with this server and determine the list of checks performed on it. More fine-tuning is described in the official documentation , from the useful you can add any fields from which values can be used in the checks, as well as the time interval that must elapse to generate an event about the client leaving offline.
Check
Checks determine the commands that will be run on clients and their parameters. Fully compatible with Nagios plugins, i.e. use exit code as a criterion for the success of the check, and STDOUT or STDERR as a data source. Checks are configured in the sensu-server configuration, a typical check looks like this (example from the documentation):
{
  "checks": {
    "chef_client": {
      "command": "check-chef-client.rb",
      "subscribers": [
        "production"
      ],
      "interval": 60
      "handlers": [
        "pagerduty",
        "irc"
      ]
    }
  }
}
Of interest here are again subscriptions and handlers. Subscriptions determine which clients this command will run on.
A set of handlers determine the list of commands that will be executed when processing data from this check. We will talk about them further.
It is worth noting that the check can be a “metric”, i.e. data from its STDOUT will always be simply passed to handlers. This way you can send the metrics data somewhere to store or draw graphs (for example, in Graphite). Details in the documentation .
Handlers
Handlers determine the commands that will be run on the monitoring server when data from the checks arrives, and their parameters. For example, this handler, when receiving a non-zero exit code from some check, will execute the command
mail -s 'sensu event' [email protected](example from the documentation):{
"handlers": {
"mail": {
"type": "pipe",
"command": "mail -s 'sensu event' [email protected]"
}
}
}
Everything is obvious here, there are a lot of handlers in the plugin repository . You can send in Pagerduty, and send letters, and in Graylog2 send in gelf. Details in the documentation .
All of the above is already enough to build a working system. There are also mutators, extensions and APIs, but this is not important for us now.
Getting to the fun part
Sensu is positioned precisely as a "monitoring framework", and this means that "out of the box" there is nothing familiar about enterprise systems like Zabbix in it. All functionality is added thanks to plugins.
Let's try to do something useful. Let's take a simple task - to check against Redis on clients, in case of problems display an alert on the Dashing panel , and also send a message to Graylog2 and email to [email protected] for history. And also take metrics from Redis and send them to Graphite for storage, and then perform checks on the aggregated values of keys too.
Clients have addresses 192.168.1.2N, Graphite is deployed on 192.168.1.80:8082, RabbitMQ and Redis are also on 192.168.1.80. Graylog2 listens on 192.168.1.81, Dashing is also deployed there.
Configuration
Let's start with the client configuration.
Let's say we have N servers in the role of redis.
The client configuration looks like this:
/etc/sensu/config.json
{
  "client": {
    "graphite_server": "192.168.1.80:8082",
    "address": "192.168.1.2N",
    "name": "clientN",
    "subscriptions": [
      "redis"
    ]
  }
  "rabbitmq": {
    "vhost": "/sensu",
    "host": "192.168.1.80",
    "password": "password",
    "port": 5672,
    "user": "sensu"
  }
}
and is hosted on each of N clients.
All other configuration files are only on the Sensu server.
Basic settings:
/etc/sensu/conf.d/settings.json
{
  "api": {
    "host": "192.168.1.80",
    "port": 4567
  },
  "redis": {
    "host": "192.168.1.80",
    "port": 6379
  },
  "rabbitmq": {
    "vhost": "/sensu",
    "host": "192.168.1.80",
    "password": "password",
    "port": 5672,
    "user": "sensu"
  },
  "mailer": {
    "mail_from": "[email protected]",
    "smtp_port": "25",
    "mail_to": "[email protected]",
    "smtp_address": "localhost"
  },
  "dashing": {
    "auth_token": "YOUR_AUTH_TOKEN",
    "host": "http://192.168.1.81:8088"
  },
  "gelf": {
    "server": "192.168.1.81"
    "port": "12201",
  }
}
As you can see, we have configured not only Sensu itself, but also parameters for the dashing, gelf and mailer handlers.
Now we define these handlers ourselves:
/etc/sensu/conf.d/handlers.json
{
  "handlers": {
    "default": {
      "type": "set",
      "handlers": [
        "mailer",
        "dashing",
        "gelf"
      ]
    },
    "gelf": {
      "type": "pipe",
      "command": "/etc/sensu/handlers/gelf.rb"
    },
    "mailer": {
      "type": "pipe",
      "command": "/etc/sensu/handlers/mailer.rb"
    },
    "dashing": {
      "type": "pipe",
      "command": "/etc/sensu/handlers/dashing.rb"
    },
    "graphite": {
      "mutator": "only_check_output",
      "type": "amqp",
      "exchange": {
        "durable": true,
        "type": "topic",
        "name": "metrics"
      }
    }
  }
}
Everything is simple here. Notice that in Graphite we data helmet through AMQP. Handlers must be decomposed on the monitoring server in / etc / sensu / handlers.
Now configure the checks that will be performed on clients:
/etc/sensu/conf.d/checks.json
{
  "checks": {
    "redis_processes": {
      "interval": 60,
      "command": "/etc/sensu/plugins/processes/check-procs.rb -p redis -c 8 -C 0 -w 7 -W 1",
      "subscribers": [
        "redis",
      ],
      "handlers": [
        "default"
      ]
    },
    "redis_memory": {
      "dependencies": [
        "redis_processes"
      ],
      "command": "/etc/sensu/plugins/redis/check-redis-memory.rb -c 204800 -w 51200",
      "interval": 60,
      "subscribers": [
        "redis",
      ],
      "handlers": [
        "default"
      ]
    },
    "redis_metric": {
      "handlers": [
        "graphite"
      ],
      "interval": 60,
      "dependencies": [
        "redis_processes"
      ],
      "command": "/etc/sensu/plugins/redis/redis-graphite.rb --scheme stats.:::name:::.redis",
      "subscribers": [
        "redis",
      ],
      "type": "metric"
    },
    "redis_keys_from_graphite": {
      "interval": 60,
      "command": "/etc/sensu/plugins/graphite/check-data.rb -s :::graphite_server::: -t stats.:::name:::.redis.db0.keys -w 500 -c 900 -a 120",
      "subscribers": [
        "redis"
      ],
      "dependencies": [
        "redis_processes"
      ],
      "handlers": [
        "default"
      ]
    }
  }
}
Checks are performed by Sensu plugins, which must be decomposed into clients in / etc / sensu / plugins. For those who are familiar with Nagios, there is nothing new here, only the redis_metric metric is interesting, from which we put the data in Graphite, and then we get and check the data for the last 10 minutes in the redis_keys_from_graphite check. In general, almost every plugin has the --help switch, which gives a completely sane reference for use.
That's the whole configuration. Everything is clear, everything can be stored in the repository, and this is wonderful.
Of course, Dashing and Graphite need to be configured, but I will leave this outside the scope of the article. Instructions for setting up Sensu + Graphite can be found here , but with Dashing everything is clear.
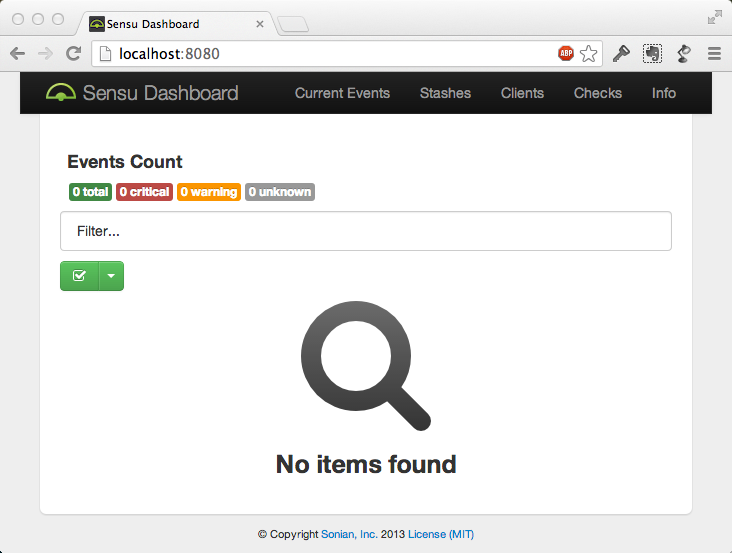
Sensu also has a simple dashboard on which you can see a list of clients, checks, and triggered alerts. Through the API and using the dashboard, you can turn off the generation of alerts for any hosts or checks, as well as see the general status of the system.
It looks something like this (the screen is not mine):
conclusions
As we can see, Sensu takes on only the role of the router and the organizer, and all the dirty work is done by external programs. This allows you to save the small size of the source code, and the overall simplicity of the system. Registration of clients through RabbitMQ allows you to get rid of the mechanism of "discovery" of clients, which is especially convenient for clouds. Scaling is very simple, an example of HA + load balancing can be seen here .
I have been using Sensu in production, in parallel with Zabbix, for about a month, well, in the test version, I used it for a couple of months. The flexibility of Sensu allowed me to configure monitoring of key parameters and project metrics with the output to the Dashing panel, while I have been using Zabbix for a very long time, and it is now engaged in more comprehensive monitoring. In general, for many projects, especially in the clouds, Sensu will be an excellent choice, as it allows you to flexibly route events, and is also well adapted to the dynamic nature of the clouds. In the presentations, I met the numbers of thousands of servers under the supervision of Sensu, so there are no problems with performance.
In conclusion, I want to point out the pros and cons of Sensu (all IMHO):
Cons Sensu
- Existing notification handlers are scanty on settings. This is now the main minus if you do not use services such as PagerDuty. The only solution is to write your cunning handler.
- The config is in json, not yaml.
- We need an external metric custodian, he is also a chart painter.
- Not too complete documentation. Fortunately, the project is simple, you can figure it out just by reading the code.
Pros Sensu
- The config can be stored in git, laid out everything with Chef / Puppet.
- Scalability.
- Fault tolerance.
- Flexibility in choosing a storage system.
- Support for Nagios plugins.
- Auto-connect clients.
- Subscription mechanism.
- Data is published by customers as they are generated.
- Test results can be flexibly sent to different handlers.