November 26, 2013 at 10:29
Stock Market Instrumentation: Trading Terminal
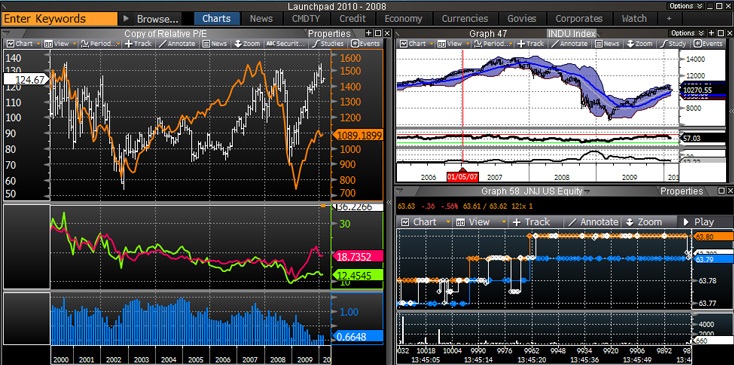
In previous articles, we touched on a rather interesting side of the stock market, namely, algorithmic or high-frequency trading, but, of course, the most traditional way of online trading on the exchange, as before, is the use of special trading terminals. We’ll talk about them today. Bloomberg terminal
Many brokers provide clients with the opportunity to carry out trading operations through web interfaces, however, in modern realities, when many traders adhere to the intraday trading style and every second of trading is important for them, the web interface is much inferior to a specialized trading terminal, as in general convenience work, and in the speed of drawing graphs or updating stock data.
At the moment, dozens of brokers are working in the Russian stock market. These include both banks that offer their customers access services to the exchange, and companies that engage exclusively in brokerage activities. The sizes of these companies also vary greatly, so not all of them can afford to develop their own software solutions for their customers.
Such brokers provide their customers with a popular trading program called QUIK. And those who can afford to develop their own software - go this way, because it provides great flexibility and independence. Some brokers offer customers both QUIK and terminals of their own design.

QUIK terminal interface
As a result, of course, the most common terminal for trading on the Russian market is QUIK, but since our company is just one of those developing our own software solutions, we will use the interface of the SmartX terminal we created to illustrate this and subsequent posts .
Consider the most important elements of the workspace in the trading terminal.
To work on the stock market, an investor needs to receive timely and accurate information on his account: the balance of the account, open, closed positions, available and blocked as a guarantee of funds - all this is critical for successful trading.

Account Manager
Information on the current price and other parameters of the security is presented in the quotation table, which each trader creates for himself and adds securities that are interesting to him.

Quotation table
Another element necessary for trading is a stock glass- i.e. table of applications for the purchase and sale of securities. The glass of the trading terminal is designed to assess the market supply and demand at a given time. Purchase orders with a given price (limited orders) are placed in the bid queue, and limited sales orders are placed in the offer queue.

Stock glass in the SmartX terminal. Bids are green for buyers, and bids for sellers are red (Offer). An additional column shows the cumulative volume of applications.
In addition to the quotation table and the stock exchange glass, the “All Transactions” window is often used. It is configured separately for each paper and is structured in several columns: transaction time, transaction price, transaction volume and its direction (Buy or Sell).
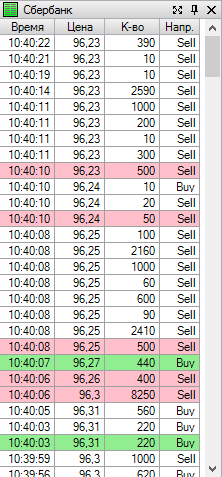
Window “All transactions. If the price after the transaction has not changed, the line is colored white, if it has grown, it is green, and if it has fallen, it is red.
To analyze the situation on the stock market, its trends and predict future price changes (“technical analysis”), many traders use price charts. There are several varieties of graphs.
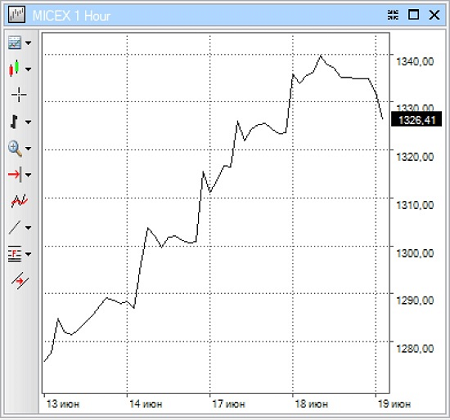
A line chart is a simple chart that shows how paper prices have changed over time. This format is not very interesting, because it does not give a complete picture of the course of trading and, therefore, is used only when the sequence of all transactions is displayed on the chart ( tick chart ) or to represent the price over a large time interval.
Next come two more popular types of charts - bar charts and candlesticks. Before considering them in more detail, you should understand the discretization of time on graphs. Each bar or candle represents a story for a specific interval or period of time. This story presents four prices of this interval - opening (Open), maximum (High) and minimum (Low) prices, as well as the end of the interval - closing (Close). The interval itself, at the same time, can be practically any - a week, a month, a quarter, or a day, hour, half an hour, five minutes, one minute, etc. Depending on the interval, the chart is called “daily”, “hourly”, “weekly”, etc.
Presentation of prices on charts using bars- in general, a separate bar consists of a vertical line and two “shelves” to the left and to the right of it. A vertical line connects the minimum and maximum prices. The shelf on the left corresponds to the opening price, on the right to the closing price. In the case when all four numbers Open, High, Low, Close are equal, the bar turns into a dash. This happens if during the time interval that the bar represents, only one transaction has occurred, it will also be the first and last, minimum and maximum.

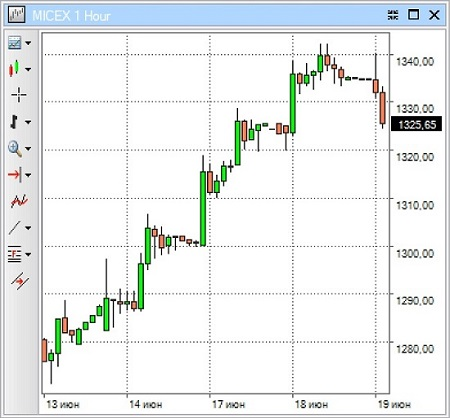
Presenting prices using candlesticks- This method originated in Japan three hundred years ago. It is based on the same four price parameters and a given time interval that are used in bar charts. A candle is a rectangle with two dashes at the top and bottom. A white (green) candle means that the closing was higher than the opening. In this case, the lower border of the rectangle (“the body of the candle”) will mean the opening of the time interval, and the upper border - closing. The dash at the bottom reflects the minimum price, and the top - the maximum. In the case of a black (red) candle, when the closing took place at prices lower than the opening prices, everything will be exactly the opposite.
The upper border of the candle body will be the opening, the lower - the closing, the dash on the top will reflect the maximum, and the lower - the minimum price.
Display in the form of candles is pleasing to the eye and easy to understand the current market situation. If the last candle is black (red), then the market falls, and if white - it grows.
Candles and bars can be formed not only by time (timeframe), but also by a fixed number of points in a candle / bar or by a given volume. We will talk in more detail about these features and technical analysis in general in one of the following articles, but for now we will move on to the process of trading on the exchange.
Before you start trading on the exchange, you need to familiarize yourself with some terms.
First of all, trading in any organized market is based on the execution of buy / sell orders with a certain number of contracts (securities on the stock market or futures, options - derivatives market contracts). That is, in general, on the stock exchange you cannot buy or sell an arbitrary amount of securities. Trading is carried out in batches that are multiples of the smallest possible number, which is called the lot .
Those. A lot of securities is the smallest amount of securities that can be sold or bought during an exchange session. The lot is determined for each security in the exchange specification and is usually equal to 1.10 or 100 securities. A lot of cheaper paper is larger, and expensive securities are traded in single lots. Over time, the price of paper can change significantly. Then the exchange can revise the specification and change the parameters of the lot, the size of its lot. The issuing company can also split its shares - such procedures are called split.
Another important concept is a security ticker (abbreviated name), which is assigned to any security at the beginning of trading on the exchange. For example, on the Moscow Exchange stock market, Sberbank shares have the SBER ticker, etc.
In order to buy, for example, stocks, a trader must notify the broker of his desire, which provides him with the opportunity to trade on a particular platform. Of course, this can also be done with a written order, but since we are still talking about online trading, of course, orders are submitted from the trading terminal.
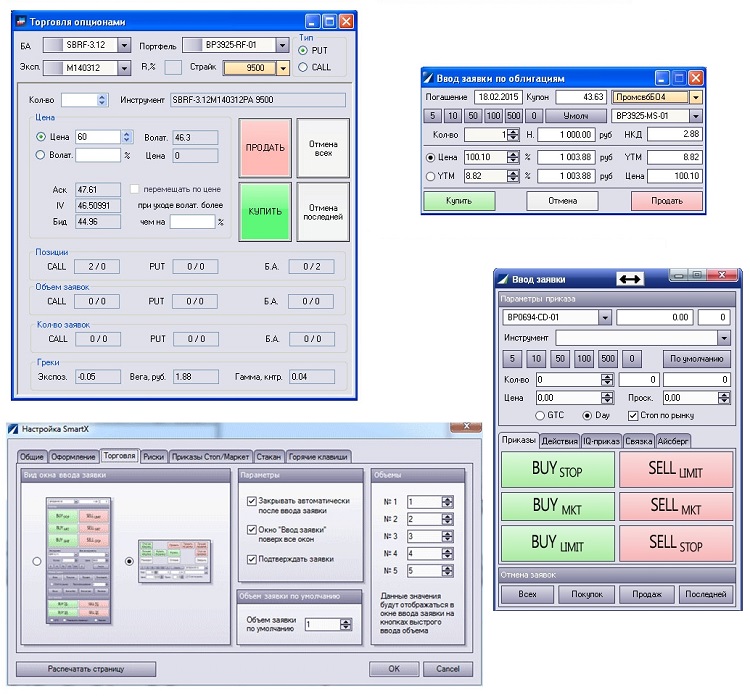
Windows for filing different types of applications in the trading terminal The
information in the order must absolutely unambiguously determine the specific security with which the transaction should be completed, the side of the transaction (purchase or sale) and the number of securities. If the information is insufficient, the application will not be accepted by the broker.
In addition, all applications are divided
As a result, the client can perform the following operations:
These are paired operations. The first pair is “buy-sell”, and the second is “sell without cover-buy”. Buy and sell without coverage - open a client's position on the selected paper, and sell and close short, respectively, close an existing position.
Uncoated sales are used in falling markets when the investor believes that the price of the paper will fall further. In this case, he, even if he does not have this paper, as if takes it “on loan” from the broker and sells it, and then buys it back when the price drops enough, and returns the paper to the broker. All these operations, of course, take place automatically, and the trader only needs to click the sell or buy button in the terminal.
The purchase of securities opens a long position, and the sale without coverage - a short position .
By the validity period, orders differ on orders:
Finally, orders are classified by type of action and are divided into market, limited and conditional orders:
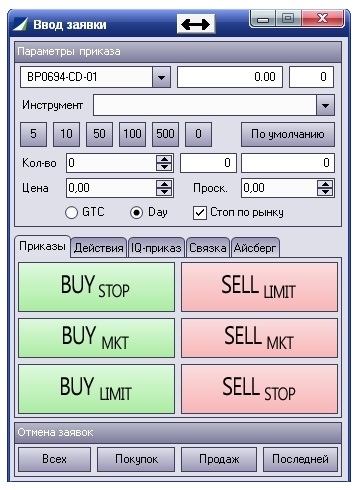
Order entry window in the SmartX terminal
Usually in trading terminals there is the option of setting up hot keys that speed up the entry of orders, as well as the function of confirming orders - sometimes, in order not to buy or sell by mistake that you didn’t want to buy or sell, the trader activates this opportunity , and when sending an application to the exchange, the terminal asks for confirmation.
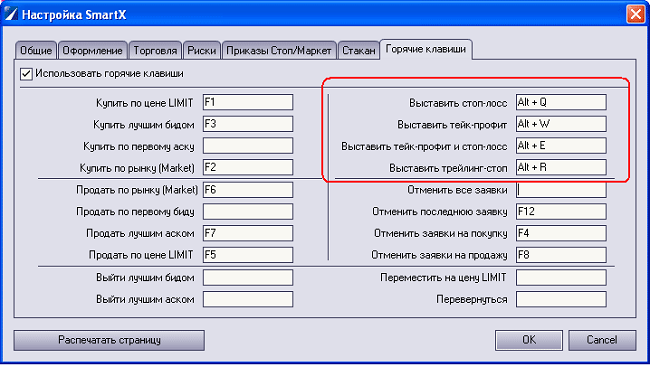
Of course, these are not all types of orders, there are also conditional exchange orders (iq-orders), but we will talk about them in one of the following articles.
Algorithmic trading is one of the main trends in the stock market in recent years. Therefore, it is not surprising that it is reflected in trading terminals, which, it would seem, do not know how to have special points of contact with exchange robots.
The developers of many trading terminals include automation capabilities of varying degrees of complexity. For example, our SmartX terminal implements the TradeScript programming language with many built-in functions, thanks to which it is possible to create mechanical trading systems directly in the terminal. Of course, this will not be a super-powerful trading robot, but it is quite possible to automate some tasks like opening a position after reaching certain parameters.

In addition to writing scripts, they can be tested on historical data using the back testing function. To test the script in real time, you can also use a special test circuit , where instead of real trading, trading is used at prices close to reality, but with virtual money.
We will consider the creation of mechanical trading systems in more detail in one of the following posts.
That's all for today! Thank you all for your attention, we will be happy to answer questions in the comments.
PS The II All-Russian Conference on Algorithmic Trading will be held very soon . If you are interested in this topic - then the event on the hub , come, it will be interesting.
Trading Terminals
At the moment, dozens of brokers are working in the Russian stock market. These include both banks that offer their customers access services to the exchange, and companies that engage exclusively in brokerage activities. The sizes of these companies also vary greatly, so not all of them can afford to develop their own software solutions for their customers.
Such brokers provide their customers with a popular trading program called QUIK. And those who can afford to develop their own software - go this way, because it provides great flexibility and independence. Some brokers offer customers both QUIK and terminals of their own design.
QUIK terminal interface
As a result, of course, the most common terminal for trading on the Russian market is QUIK, but since our company is just one of those developing our own software solutions, we will use the interface of the SmartX terminal we created to illustrate this and subsequent posts .
Consider the most important elements of the workspace in the trading terminal.
Bid and Account Information
To work on the stock market, an investor needs to receive timely and accurate information on his account: the balance of the account, open, closed positions, available and blocked as a guarantee of funds - all this is critical for successful trading.
Account Manager
Information on the current price and other parameters of the security is presented in the quotation table, which each trader creates for himself and adds securities that are interesting to him.
Quotation table
Another element necessary for trading is a stock glass- i.e. table of applications for the purchase and sale of securities. The glass of the trading terminal is designed to assess the market supply and demand at a given time. Purchase orders with a given price (limited orders) are placed in the bid queue, and limited sales orders are placed in the offer queue.
Stock glass in the SmartX terminal. Bids are green for buyers, and bids for sellers are red (Offer). An additional column shows the cumulative volume of applications.
In addition to the quotation table and the stock exchange glass, the “All Transactions” window is often used. It is configured separately for each paper and is structured in several columns: transaction time, transaction price, transaction volume and its direction (Buy or Sell).
Window “All transactions. If the price after the transaction has not changed, the line is colored white, if it has grown, it is green, and if it has fallen, it is red.
To analyze the situation on the stock market, its trends and predict future price changes (“technical analysis”), many traders use price charts. There are several varieties of graphs.
A line chart is a simple chart that shows how paper prices have changed over time. This format is not very interesting, because it does not give a complete picture of the course of trading and, therefore, is used only when the sequence of all transactions is displayed on the chart ( tick chart ) or to represent the price over a large time interval.
Next come two more popular types of charts - bar charts and candlesticks. Before considering them in more detail, you should understand the discretization of time on graphs. Each bar or candle represents a story for a specific interval or period of time. This story presents four prices of this interval - opening (Open), maximum (High) and minimum (Low) prices, as well as the end of the interval - closing (Close). The interval itself, at the same time, can be practically any - a week, a month, a quarter, or a day, hour, half an hour, five minutes, one minute, etc. Depending on the interval, the chart is called “daily”, “hourly”, “weekly”, etc.
Presentation of prices on charts using bars- in general, a separate bar consists of a vertical line and two “shelves” to the left and to the right of it. A vertical line connects the minimum and maximum prices. The shelf on the left corresponds to the opening price, on the right to the closing price. In the case when all four numbers Open, High, Low, Close are equal, the bar turns into a dash. This happens if during the time interval that the bar represents, only one transaction has occurred, it will also be the first and last, minimum and maximum.
Presenting prices using candlesticks- This method originated in Japan three hundred years ago. It is based on the same four price parameters and a given time interval that are used in bar charts. A candle is a rectangle with two dashes at the top and bottom. A white (green) candle means that the closing was higher than the opening. In this case, the lower border of the rectangle (“the body of the candle”) will mean the opening of the time interval, and the upper border - closing. The dash at the bottom reflects the minimum price, and the top - the maximum. In the case of a black (red) candle, when the closing took place at prices lower than the opening prices, everything will be exactly the opposite.
The upper border of the candle body will be the opening, the lower - the closing, the dash on the top will reflect the maximum, and the lower - the minimum price.
Display in the form of candles is pleasing to the eye and easy to understand the current market situation. If the last candle is black (red), then the market falls, and if white - it grows.
Candles and bars can be formed not only by time (timeframe), but also by a fixed number of points in a candle / bar or by a given volume. We will talk in more detail about these features and technical analysis in general in one of the following articles, but for now we will move on to the process of trading on the exchange.
Trading operations
Before you start trading on the exchange, you need to familiarize yourself with some terms.
First of all, trading in any organized market is based on the execution of buy / sell orders with a certain number of contracts (securities on the stock market or futures, options - derivatives market contracts). That is, in general, on the stock exchange you cannot buy or sell an arbitrary amount of securities. Trading is carried out in batches that are multiples of the smallest possible number, which is called the lot .
Those. A lot of securities is the smallest amount of securities that can be sold or bought during an exchange session. The lot is determined for each security in the exchange specification and is usually equal to 1.10 or 100 securities. A lot of cheaper paper is larger, and expensive securities are traded in single lots. Over time, the price of paper can change significantly. Then the exchange can revise the specification and change the parameters of the lot, the size of its lot. The issuing company can also split its shares - such procedures are called split.
Another important concept is a security ticker (abbreviated name), which is assigned to any security at the beginning of trading on the exchange. For example, on the Moscow Exchange stock market, Sberbank shares have the SBER ticker, etc.
Trading Orders
In order to buy, for example, stocks, a trader must notify the broker of his desire, which provides him with the opportunity to trade on a particular platform. Of course, this can also be done with a written order, but since we are still talking about online trading, of course, orders are submitted from the trading terminal.
Windows for filing different types of applications in the trading terminal The
information in the order must absolutely unambiguously determine the specific security with which the transaction should be completed, the side of the transaction (purchase or sale) and the number of securities. If the information is insufficient, the application will not be accepted by the broker.
In addition, all applications are divided
- By type of action: on market, limited and conditional;
- Validity: 1 day (DAY) or until canceled (GTC, Good Till Cancel);
- By type of operation: buying, selling, selling without coverage and buying short selling.
As a result, the client can perform the following operations:
- Buy
- Sell:
- Sell uncoated or sell short (Sell Short / Open Short);
- Close short or buy back (CloseShort / BuyBack).
These are paired operations. The first pair is “buy-sell”, and the second is “sell without cover-buy”. Buy and sell without coverage - open a client's position on the selected paper, and sell and close short, respectively, close an existing position.
Uncoated sales are used in falling markets when the investor believes that the price of the paper will fall further. In this case, he, even if he does not have this paper, as if takes it “on loan” from the broker and sells it, and then buys it back when the price drops enough, and returns the paper to the broker. All these operations, of course, take place automatically, and the trader only needs to click the sell or buy button in the terminal.
The purchase of securities opens a long position, and the sale without coverage - a short position .
By the validity period, orders differ on orders:
- Immediate execution , when a transaction must be completed immediately if market conditions allow it, and cancel it or the balance if there are no such conditions at the time of an application to the market (FOK, Fill Or Kill).
- With the validity of the day (Day, D). Such orders are valid during the current trading session. If, for some reason, the order is not executed during this session, then it will not be placed at the next session and will be canceled.
- Valid until executed or until canceled by the investor (GTC) . The GTC (Good Till Cancel ) order, unlike the daytime ones, will be transferred to subsequent sessions and will be active until executed upon reaching the conditions of the transaction or until the investor cancels them.
Finally, orders are classified by type of action and are divided into market, limited and conditional orders:
- A market order (market order, market-order, MKT) requires execution under current market conditions. Those. it sounds like “ buy / sell NN lots of MMM paper by market ”. This means that the transaction will take place at the current price of paper or higher if the number of securities in the order exceeds the first offer in the stock exchange. In this case, the broker will execute the deal with the first offer, then with the second, third, etc. As a result, the price can go quite far from current market quotes.
- A limited order (LimitOrder, LMT) is distinguished by the market presence of two additional attributes - execution price and duration. Besides the security, quantity and side of the transaction? The client must indicate the price, not worse than this order must be executed ( Buy / sellNN lots of MMM paper at a price of 1000. Validity: day ). To buy or sell at a price of 1000 does not mean at all that the paper should be and will be bought for exactly 1000, it only means that the price will be no worse than 1000.
- Stop and stop limit orders (STOP, STOP-LIMIT) . These orders are most often used to close positions and protect the account from major losses. The stop order means that the order should be put on the market if and only if the price reaches a predetermined value. The stop-limit order is different in that when it is triggered, not a market order, but a limited one is displayed on the exchange.
Order entry window in the SmartX terminal
Usually in trading terminals there is the option of setting up hot keys that speed up the entry of orders, as well as the function of confirming orders - sometimes, in order not to buy or sell by mistake that you didn’t want to buy or sell, the trader activates this opportunity , and when sending an application to the exchange, the terminal asks for confirmation.
Of course, these are not all types of orders, there are also conditional exchange orders (iq-orders), but we will talk about them in one of the following articles.
Trade automation
Algorithmic trading is one of the main trends in the stock market in recent years. Therefore, it is not surprising that it is reflected in trading terminals, which, it would seem, do not know how to have special points of contact with exchange robots.
The developers of many trading terminals include automation capabilities of varying degrees of complexity. For example, our SmartX terminal implements the TradeScript programming language with many built-in functions, thanks to which it is possible to create mechanical trading systems directly in the terminal. Of course, this will not be a super-powerful trading robot, but it is quite possible to automate some tasks like opening a position after reaching certain parameters.
In addition to writing scripts, they can be tested on historical data using the back testing function. To test the script in real time, you can also use a special test circuit , where instead of real trading, trading is used at prices close to reality, but with virtual money.
We will consider the creation of mechanical trading systems in more detail in one of the following posts.
That's all for today! Thank you all for your attention, we will be happy to answer questions in the comments.
PS The II All-Russian Conference on Algorithmic Trading will be held very soon . If you are interested in this topic - then the event on the hub , come, it will be interesting.