Overview and design of modern electricity meters
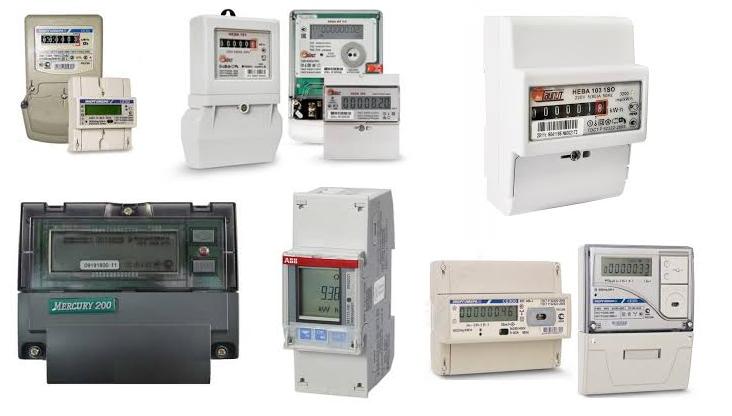
Recently, electronic meters have replaced electronic induction meters. In these counters, the counting mechanism is rotated not with the help of voltage and current coils, but with the help of specialized electronics. In addition, the means of counting and displaying readings can be a microcontroller and a digital display, respectively. All this has reduced the overall dimensions of the devices, as well as reduce their cost.
The structure of almost any electronic meter includes one or several specialized computational microcircuits that perform the basic functions of conversion and measurement. The input of such a chip receives information about the voltage and amperage from the corresponding sensors in analog form. Inside the chip, this information is digitized and converted in a certain way. As a result, at the output of the microcircuit, pulse signals are formed, the frequency of which is proportional to the current power consumption of the load connected to the meter. The pulses go to the counting mechanism, which is an electromagnet matched with gears on wheels with numbers. In the case of more expensive meters with a digital display, an additional microcontroller is used.
Consider several similar microcircuits and counter models that I came across.
The figure below shows one of the cheapest and most popular single-phase meters “NEVA 103” in an exploded view. As can be seen from the figure, the device is quite simple. The main board consists of a specialized chip, its body kit and a power stabilizer assembly based on a ballast capacitor. On the additional board there is an LED indicating the consumed load. In this case - 3200 pulses per 1 kW * h. It is also possible to remove pulses from the green terminal block located at the top of the meter. The counting mechanism consists of seven wheels with numbers, gearbox and electromagnet. It displays the calculated electricity with an accuracy of tenths of a kWh. As can be seen from the figure, the gearbox has a gear ratio of 200: 1. According to my remarks, this means “200 pulses per 1 kWh”. That is, 200 pulses, filed on the electromagnet, will contribute to the scrolling of the last red wheel for 1 full turn. This ratio is a multiple of the ratio for the LED indicator, which is not accidental. A gearbox with an electromagnet is placed in a metal box under two screens in order to protect it from interference by an external magnetic field.

In this counter model, the ADE7754 chip is used. Consider its structure.
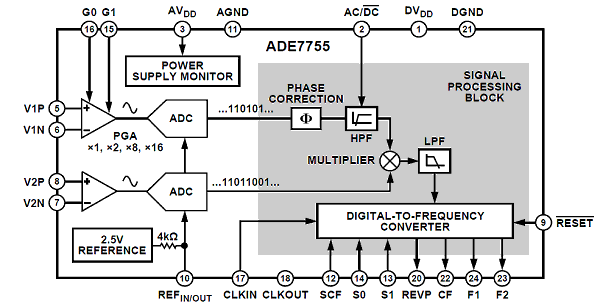
Pins 5 and 6 receive the analog signal from the current shunt, which is located on the first and second terminals of the meter (there is damage in the photo at this point). Pins 8 and 7 receive an analog signal proportional to the line voltage. Through pins 16 and 15, it is possible to set the gain of the internal op-amp, which is responsible for the current. With the help of ADC nodes, both signals are converted into a digital form and, passing through a certain correction and filtering, arrive at the multiplier. The multiplier multiplies these two signals, as a result, according to the laws of physics, at its output information is obtained about the current power consumption. This signal is sent to a specialized converter, which generates ready-made pulses to the counting device (pins 23 and 24) and to the control LED and the counting output (pin 22). Through pins 12,
The standard circuit diagram is practically the circuit of the counter under consideration.
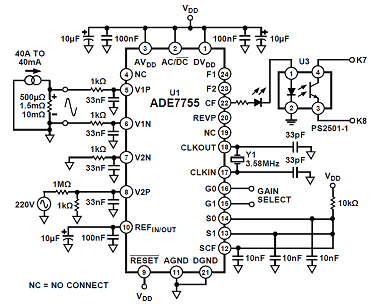
The common negative wire is connected to zero 220V. The phase enters the pin 8 through a divider on the resistors, which serves to reduce the level of the measured voltage. The signal from the shunt is fed to the corresponding inputs of the chip through resistors. In this test circuit, configuration pins 12-14 are connected to a logical unit. Depending on the meter model, they may have a different configuration. In this overview, this information is not so important. The LED indicator is connected to the corresponding pin in series with the optical isolation, on the other side of which a terminal block is connected to remove the counting information (K7 and K8).
From the same family of microcircuits, there are similar analogues for three-phase measurements. Most likely, they are built into cheap three-phase meters. As an example, the figure below shows the structure of one of these microcircuits, namely the ADE7752.
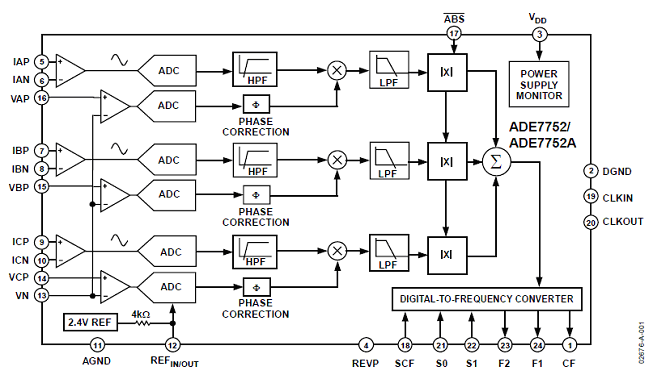
Instead of two ADC nodes, there are 6 of them: 2 for each phase. Negative inputs OU voltage combined together and displayed on pin 13 (zero). Each of the three phases is connected to its own positive input of the op-amp (pins 14, 15, 16). The signals from current shunts for each phase are connected by analogy with the previous example. For each of the three phases, a signal characterizing the current power is extracted using three multipliers. These signals, in addition to filters, pass through additional nodes that are activated through pin 17 and serve to enable the operation of the mathematical module. Then these three signals are summed, thus obtaining the total power consumption across all phases. Depending on the binary configuration of pin 17, the adder sums up either the absolute values of the three signals or their modules. This is necessary for those or other subtleties of measuring electricity, the details of which are not considered here. This signal is fed to a converter similar to the previous example with a single-phase meter. Its interface is also almost identical.
It is worth noting that the above chips are used to measure the active energy. More expensive meters can measure both active and reactive energy. Consider, for example, the ADE7754 chip. As can be seen from the figure below, its structure is much more complex than the structure of microcircuits from the previous examples.
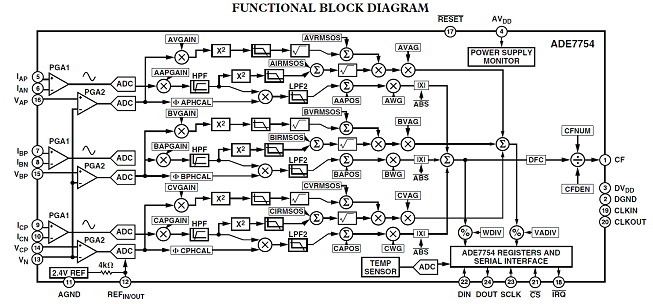
The microcircuit measures active and reactive three-phase electric power, has a SPI interface for connecting a microcontroller and a CF output (pin 1) for external recording of active electric power. All other information from the chip is read by the microcontroller through the interface. Through it, the configuration of the chip is carried out, in particular, the installation of numerous constants reflected in the structural diagram. As a result, this microcircuit, unlike the previous two examples, is not autonomous, and a microcontroller is required to construct a counter based on this microcircuit. It is possible to visually observe the nodes responsible for measuring active and reactive energy in the structural diagram. Everything is much more complicated here than in the previous two examples.
As an example, consider another interesting device: a three-phase meter of the “Energomera TsE6803V R32”. As can be seen from the photo below, this counter has not yet been exploited. He got me in a non-sealed form with minor mechanical damage outside. With all this, he was completely in working condition.

As you can see, looking at the main board, the device consists of three identical nodes (on the right), the power supply circuits and the microcontroller. On the bottom of the main board there are three identical modules on separate boards, one for each node. These modules are AD71056 chips with the minimum required weight. This microcircuit is a single-phase electricity meter.
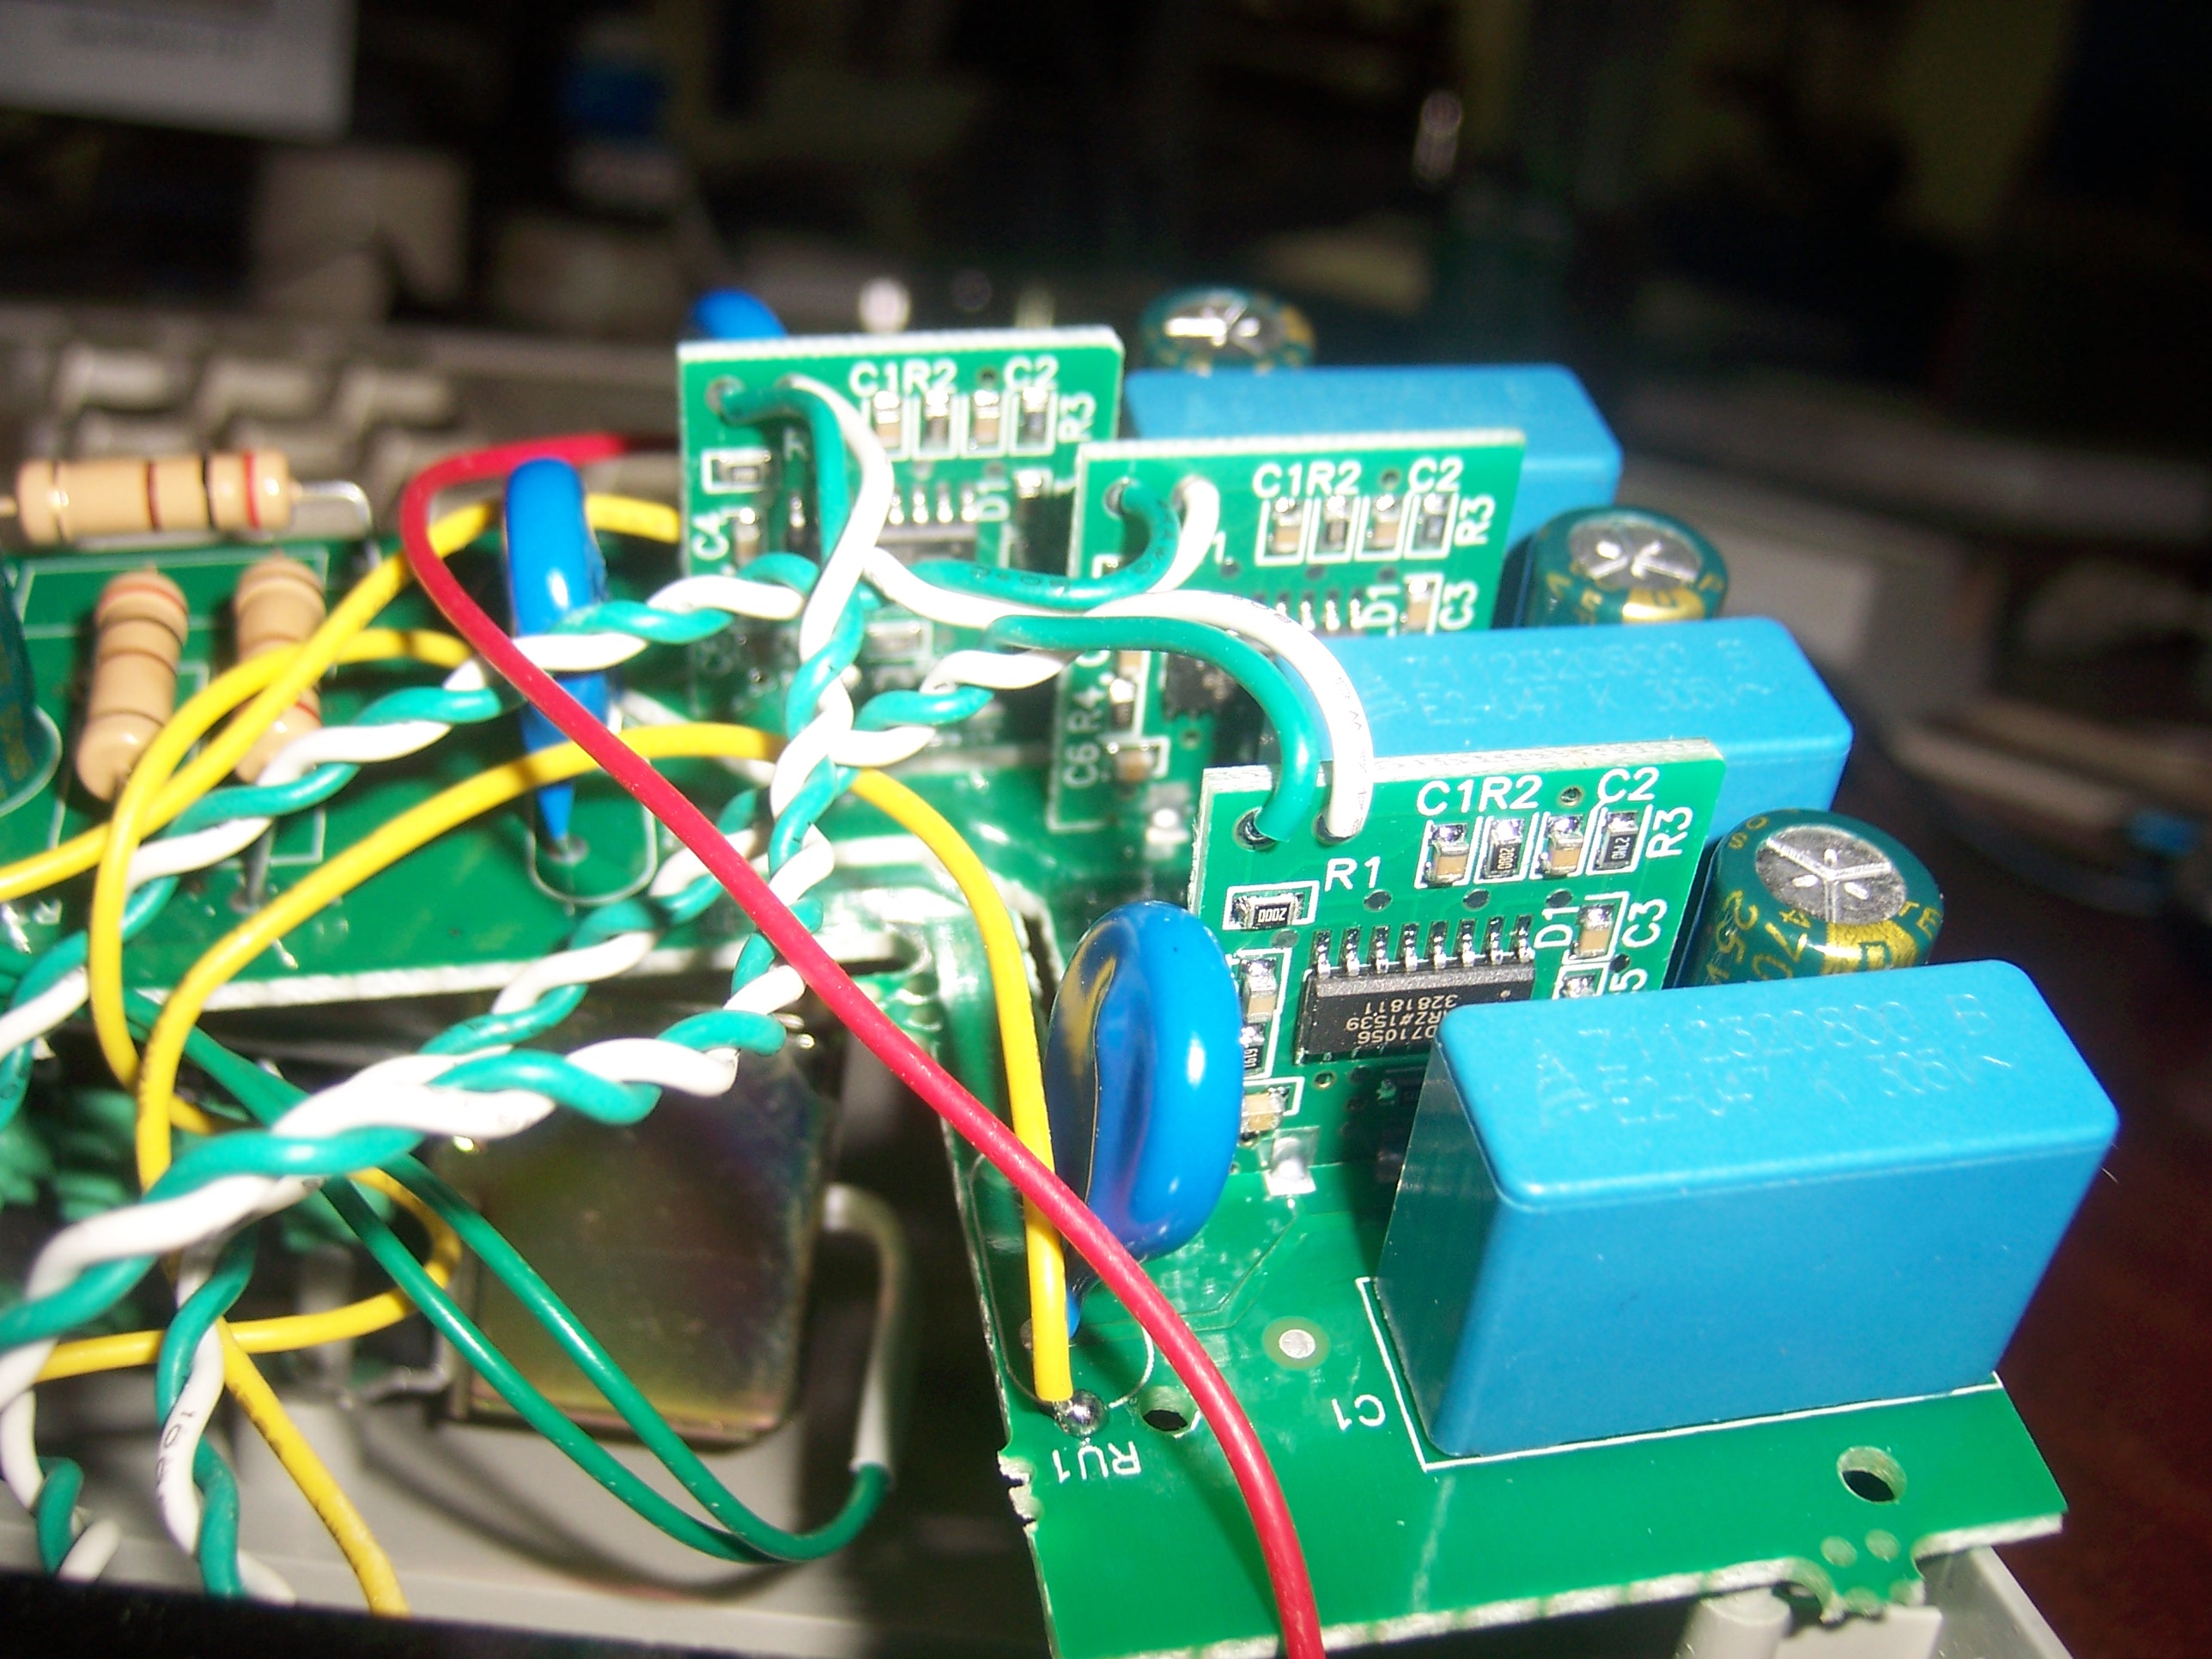
Modules are soldered vertically on the main board. Twisted wires connect current shunts to these modules.
For a couple of hours I managed to draw the electric circuit of the device. Consider it in more detail.
The right side of the diagram shows a single-phase module diagram, which was discussed above. The D1 chip of this AD71056 module is similar to the ADE7755 chip, which was previously considered. The fourth contact of the module receives 5V power, the third - voltage signal. From the second contact, information in the form of pulses about power consumption is removed through the CF output of the D1 chip. The signal from the current shunts enters through the contacts X1 and X2. The configuration inputs of the SCF chip, S1 and S0 in this case are located on pins 8-10 and are configured in "0,1,1".
Each of the three such modules serves respectively each phase. The signal for voltage measurement is fed to the module through a chain of four resistors and is taken from the zero terminal (“N”). It should be noted that the common wire for each module is its corresponding phase. But the common wire of the whole circuit is connected to the zero terminal. This tricky solution to provide power to each node of the scheme is described below.
Each of the three phases goes to the Zener diodes VD4, VD5 and VD6, respectively, then to the RC ballast circuits R1C1, R2C2 and R3C3, then to the zener diodes VD1, VD2 and VD3, which are connected with their zero anodes. From the first three zener diodes, the supply voltage for each module U3, U2 and U1 is removed, respectively, rectified by diodes VD10, VD11 and VD12. Chips-regulators D1-D3 are used to obtain a supply voltage of 5V. From the Zener diodes VD1-VD3, the supply voltage of the general circuit is removed, straightened by the diodes VD7-VD9, assembled at one point and fed to the regulator D4, from where 5V is removed.
The general scheme is microcontroller (MK) D5 PIC16F720. Obviously, it serves to collect and process information about the current power consumption received from each module in the form of pulses. These signals come from the U3, U2 and U1 modules to the MK pins RA2, RA4 and RA5 through optical isolators V1, V2 and V3, respectively. As a result, on pins RC1 and RC2, the MK generates pulses for the mechanical counting device M1. It is similar to the device discussed earlier, and also has a 200: 1 ratio. The coil resistance is high and is about 500 Ohms, which allows you to connect it directly to the MC without additional transistor circuits. On pin RC0, the MK generates pulses for the LED indicator HL2 and for an external pulse output at the XT1 connector. The latter is implemented through optical isolation V4 and the transistor VT1. In this counter model, the ratio is 400 pulses per 1 kWh. In practice, when testing this meter (after minor repairs), it was noticed that the electromagnetic coil of the counting mechanism operates synchronously with the flash of the HL2 LED, but one time (two times less). This confirms the correspondence of the ratio of 400: 1 for the indicator and 200: 1 for the counting mechanism, as mentioned earlier.
On the left there is a place for a 10-pin connector XS1, which serves for flashing, as well as for the UART of the MK interface.
Thus, the three-phase meter “Energomera TsE6803V R32” consists of three single-phase measuring microcircuits and a microcontroller processing information from them.
In conclusion, it is worth noting that there are a number of meter models that are much more complex in their functionality. For example, meters with remote control of indications on the power line, or even through a mobile communication module. In this article I reviewed only the simplest models and the basic principles of the construction of their electrical circuits. I apologize in advance for possibly incorrect terminology in the text, because I tried to express in simple language.