How does mapping of inaccessible territory with drones look like?
The Swiss company SenseFly demonstrated a successful method of mapping inaccessible territories using drones, showing that in a limited time it is possible to obtain a highly detailed model of a complex relief of a large area, which can be published immediately on the Internet.
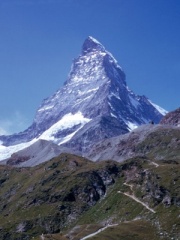 For mapping, the Matterhorn peak was chosen at a height of 4478 meters, located in the Swiss Alps on the border between Italy and Switzerland (this place is on Google Maps). Technically, the process itself looked something like this: a team of engineers, being at the top of the peak, launches several eBee drones, controlling the process of their flight along a given route using a tablet via GPS. Aircraft of this class themselves can perform aerial photography of an area of up to 10 km 2 (from one flight), allowing you to receive maps and terrain models with an accuracy of 5 cm at the post-processing stage, despite the fact that a modest camera is installed on board the drone by the standards of some modern phones in 16 megapixels. The wingspan of the drone is a little less than one meter - 96 cm, and weighs 700 grams.
As a result, to obtain the Matterhorn peak model, the drones needed to complete 11 flights, reaching a maximum altitude of 4707 meters and flying a total of about 264 km. All the aerial photography took 5 hours and 40 minutes, for which 2188 images were obtained.
How this process looked from the side of the team of surveyors, you can see the video below:
The post-processing stage of the results was the visualization of the obtained data. To do this, from the internal LAZ format (compressed format for describing point clouds), the data was converted to regular ASCII (using the LASTools tools ), and then visualized using the XP-Points JavaScript library , which can render points in the form of WebGL models.
The result can be viewed on the gif-image under the spoiler, or immediately go to the interactive model (requires a browser with WebGL support) - it is noteworthy that 300 million points are displayed (the size of the source file with them is 26682.732 Kb):
Also on the mosaic image of the shooting results, the difference in image quality between the existing aerial photography and the obtained by robotic methods is clearly visible:

It is noteworthy that all the GIS tools used for processing are free and freely available on github .
[ Source ]
For mapping, the Matterhorn peak was chosen at a height of 4478 meters, located in the Swiss Alps on the border between Italy and Switzerland (this place is on Google Maps). Technically, the process itself looked something like this: a team of engineers, being at the top of the peak, launches several eBee drones, controlling the process of their flight along a given route using a tablet via GPS. Aircraft of this class themselves can perform aerial photography of an area of up to 10 km 2 (from one flight), allowing you to receive maps and terrain models with an accuracy of 5 cm at the post-processing stage, despite the fact that a modest camera is installed on board the drone by the standards of some modern phones in 16 megapixels. The wingspan of the drone is a little less than one meter - 96 cm, and weighs 700 grams. As a result, to obtain the Matterhorn peak model, the drones needed to complete 11 flights, reaching a maximum altitude of 4707 meters and flying a total of about 264 km. All the aerial photography took 5 hours and 40 minutes, for which 2188 images were obtained.
How this process looked from the side of the team of surveyors, you can see the video below:
The post-processing stage of the results was the visualization of the obtained data. To do this, from the internal LAZ format (compressed format for describing point clouds), the data was converted to regular ASCII (using the LASTools tools ), and then visualized using the XP-Points JavaScript library , which can render points in the form of WebGL models.
The result can be viewed on the gif-image under the spoiler, or immediately go to the interactive model (requires a browser with WebGL support) - it is noteworthy that 300 million points are displayed (the size of the source file with them is 26682.732 Kb):
Matterhorn
Also on the mosaic image of the shooting results, the difference in image quality between the existing aerial photography and the obtained by robotic methods is clearly visible:
It is noteworthy that all the GIS tools used for processing are free and freely available on github .
[ Source ]