KDD 2018, first day, tutorials

Today in London one of the main Data Science conferences of the year started, I will try to promptly talk about what was interesting to hear.
The start was nervous: on the same morning, a mass meeting of Jehovah's Witnesses was organized in the same center, so finding the KDD registration desk was not easy, and when I finally found it, the line was 150-200 meters long. However, after ~ 20 minutes of waiting, I received a coveted badge and recovered to a master class.
Privacy in data analysis
The first workshop was devoted to the preservation of privacy in the analysis of data. I was late for the beginning, but, apparently, I didn’t lose anything much - they told about how important privacy is and how attackers can not use the disclosed private information well. They say, by the way, quite respected people from Google, LinkedIn and Apple. As a result, the master class left a very positive impression, the slides are all available here .
It turns out that the concept of Differential Privacy has been around for quite some time , the idea of which is to add noise, which makes it difficult to establish true individual values, but retaining the possibility of restoring common distributions. Actually, there are two parameters:
e- how difficult it is to disclose data, andd- how distorted the answers are. In the original concept, it is assumed that between the analyst and the data there is a kind of intermediate link - “Curator”, it is he who processes all requests and forms the answers so that the noise hides private data. In reality, the Local Differential Privacy model is often used, in which user data remains on the user's device (for example, a mobile phone or PC), but when responding to developer requests, the application sends a data packet from a personal device that does not allow to find out what This particular user replied. Although combining responses from a large number of users, you can accurately restore the overall picture.
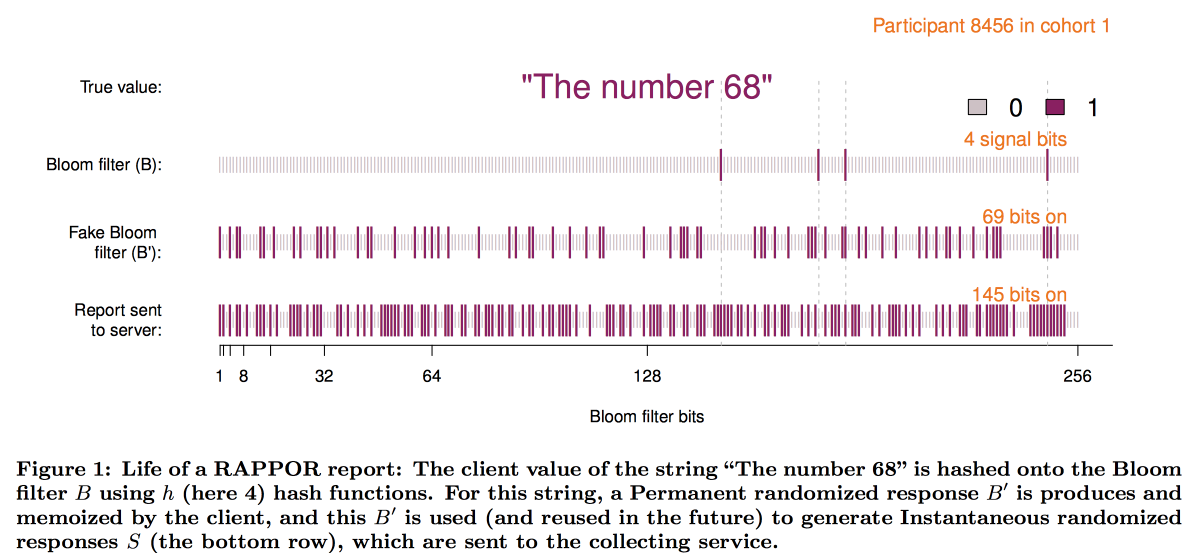
A good example: the survey "did you have an abortion." If you conduct a survey "in the forehead," then no one will tell the truth. But if you organize the survey as follows: “throw a coin, if there is an eagle, then throw again and say yes to the eagle, but no to tails, otherwise answer the truth,” it is easy to restore the true distribution while maintaining individual privacy. The development of this idea was the Google RAPPOR (RAndom statistics Privacy-Preserving Ordinal Report) mechanics of collecting sensitive statistics used to collect data on the use of Chrome and its forks.
Immediately after the release of Chrome in open source, a sufficiently large number of people wanted to create their own browser with a redefined home page, a search engine, their own advertising dice, etc.. Naturally, users and Google were not happy about it. Further actions are generally understandable: to find out the most common substitutions and press down administratively, but it was unexpected ... Chrome’s privacy policy did not allow Google to collect and collect information about setting up the user's home page and search engine :(
To overcome this limitation, they created a RAPPOR that works like this:
- Data on the home page is recorded in a small, about 128 bits, bloom-filter.
- Permanent white noise is added to this bloom filter. Permanent = the same for this user, without noise being saved by multiple requests, it would be possible to reveal the user's data.
- Over the constant noise, the individual noise generated for each request is superimposed.
- The resulting bit vector is sent to Google, where the decoding of the overall picture begins.
- First, by statistical methods we subtract from the overall picture the effect of noise.
- Next, we build the bit vectors of candidates (the most popular sites / search engines in principle).
- Using the resulting vectors as a basis, we construct a linear regression to restore the picture.
- We combine linear regression with LASSO to suppress irrelevant candidates.
Schematically, the construction of the filter is as follows:
The experience of implementing RAPPOR was very positive, and the number of private statistics collected with its help is rapidly increasing. Among the main success factors, the authors identified:
- The simplicity and clarity of the model.
- Open and documented code.
- The presence on the final graphs of the boundaries of errors.
However, this approach has a significant limitation: it is necessary to have lists of candidate answers for decryption (that is why O is Ordinal). When Apple began to collect statistics about the words used in text messages and Emoji, it became clear that this approach is not suitable. As a result, at the WDC-2016 conference, one of the top new announced features in iOS was the addition of differential privacy. The combination of a sketch-structure with added noise was also used as a basis, but many technical problems had to be solved:
- The client (telephone) should be able to build and accommodate this response in a reasonable time.
- Further, this response should be packaged in a limited-size network message.
- On the Apple side, all this should be aggregated in a reasonable time.
As a result, we arrived at the scheme using count-min-sketch to encode words, then randomly select only the answer from one of the hash functions (but with fixing the choice for the user / word pair), transform the vector using the Hadamard transform and send one meaningful “bit” for the selected hash function.
To restore the result on the server, it was also necessary to review the candidate hypotheses. But it turned out that with a large dictionary size it is too difficult even for a cluster. It was necessary to somehow heuristically choose the most promising areas of search. The experiment with the use of bigrams as starting points, from which a mosaic can then be assembled, was unsuccessful - all the bigrams were about equally popular. The bigram + word hash approach solved the problem, but led to a breach of privacy. As a result, we stopped at the prefix trees: the statistics were collected on the initial parts of the word and then on the whole word.
Nevertheless, analysis of the privacy algorithm used by Apple by the research community has shown that with long-term statistics collection, privacy can still be compromised.
LinkedIn was in a more difficult situation with his research on the distribution of user wages. The fact is that differential privacy works well when we have a very large number of dimensions, otherwise it is not possible to reliably subtract noise. In the same salary survey, the number of reports is limited, and LinkedIn decided to take a different path: combine technical cryptography and cybersecurity tools with the concept of k-Anonymity : user data is considered to be sufficiently disguised if submitted by a bundle with k answers with the same input attributes (for example, location and profession), differing only in the target variable (salary).
As a result, a complex pipeline was built, in which different services send pieces of data to each other, constantly encrypting them so that the entire machine cannot open them entirely. As a result, users are divided by attributes into cohorts, and when the cohort reaches the minimum size, its statistics go to HDFS for analysis.
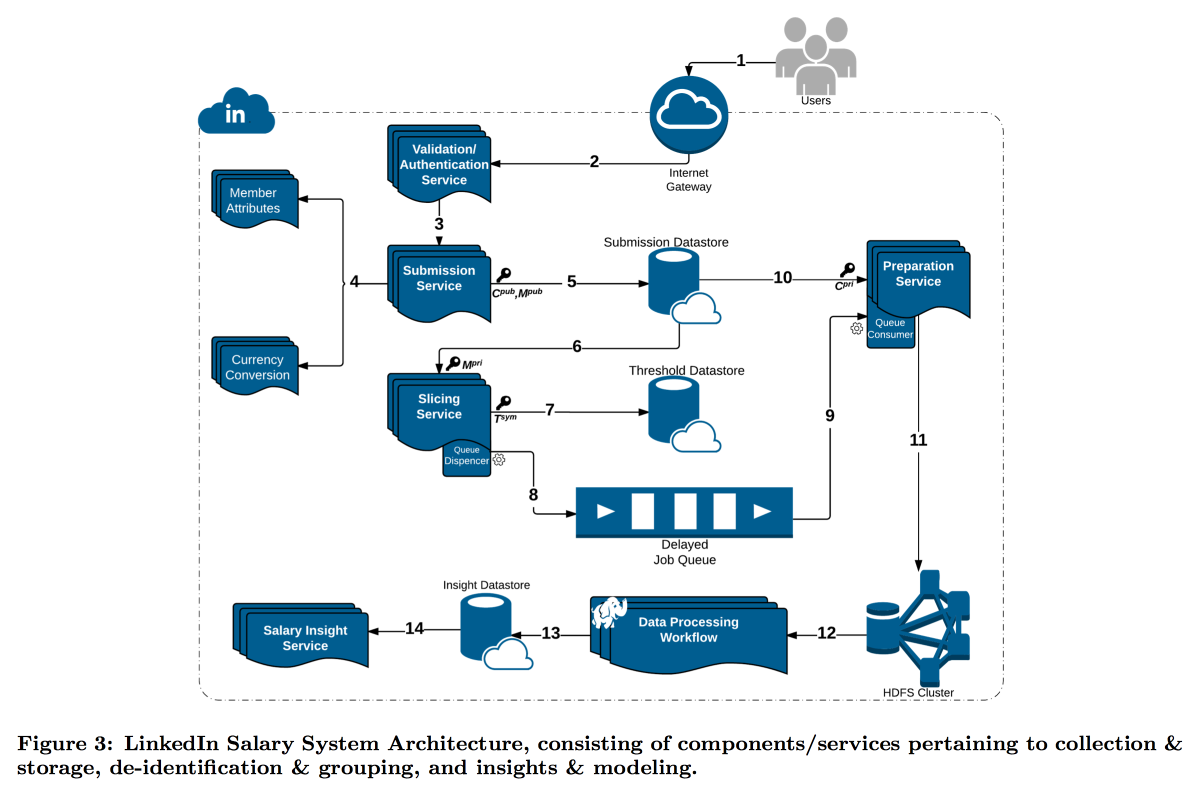
Timestamp deserves a special attention: it must also be anonymized, otherwise you can find out by someone's log of visits, whose answer is this. But I don’t want to completely clean up the time, because it is interesting to follow the dynamics. As a result, we decided to add timestamp to the attributes on which the cohort is built, and to average its value in it.
The result was an interesting premium feature and some interesting open questions:
The GDPR suggests that, upon request, we should be able to delete all user data, but we tried to hide it so much that we now cannot find whose data it is. Having data on a large number of different slices / cohorts, it is possible to isolate correspondences and expand the list of open attributes.
This approach works for data of large dimensionality, but does not work with continuous data. Practice shows that simply sampling data is not a good idea, but Microsoft at NIPS2017 offered a solution on how to work with it. Unfortunately, the details did not have time to disclose.
Big graph analysis
The second master class in analyzing large graphs began in the afternoon. Despite the fact that the guys from Google also led him, and there were more expectations from him, he liked much less - they talked about their closed technologies, now falling into banalism and general philosophy, now plunging into wild details without even having formulated the task. Nevertheless, some interesting aspects could catch. Slides can be found here .
First of all, I liked the scheme called ego-network clustering , I think it is possible to build interesting solutions based on it. The idea is very simple:
- We consider the local graph from the point of view of a specific user, BUT minus him.
- Cluster this graph.
- Next, we “clone” the top of our user by adding an instance to each cluster and not connecting them with edges.
In a similarly transformed graph, many problems are solved more easily and the ranking algorithms work cleaner. For example, it is much easier to partition such a graph in a balanced way, and when ranking in the recommendation of friends, the bridge nodes are much less noisy. It was for the task of recommending that ENC friends were reviewed / promoted.
But in general, ENC was just an example; in Google, a whole department deals with the development of algorithms on graphs and delivers them to other departments as a library. The library's declared functionality is impressive: the dream library for SNA, but everything is closed. At best, individual blocks can try to reproduce the articles. It is alleged that the library has hundreds of deployments within Google, including on graphs with more than a trillion edges.
Then it was about 20 minutes of advertising campaign model MapReduce, as if we ourselves do not know how cool it is. After that, the guys showed that many complex tasks can be solved (approximately) using the Randomized Composable Core Sets model. The basic idea is that the data on the edges are randomly spread over N nodes, they are drawn into memory and the problem is solved locally, after which the results of the decision are transmitted to the central machine and aggregated. It is argued that in this way good approximations for many problems can be obtained cheaply: connectivity components, minimum spanning forest, max matching, max coverage, etc. In some cases, in this case, both the mapper and reduce solve the same problem, but they may be slightly different. A good example of how cleverly to call a simple solution to be believed.
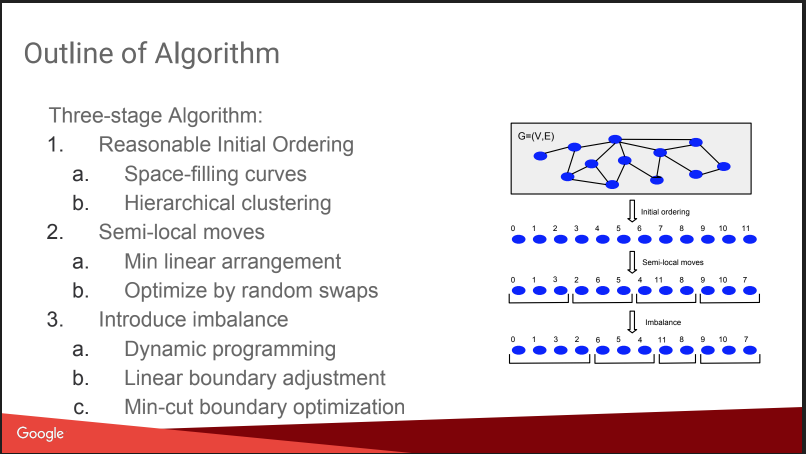
Then there was a conversation about what I was coming here for: about Balanced Graph Partitioning. Those. how to cut the graph into N parts so that the parts are approximately equal in size, and the number of links inside the parts is much higher than the number of external links. If you are able to solve such a problem well, then very many algorithms become simpler, and even A / B tests can be run more efficiently, with compensation for the viral effect. But the story disappointed a little, everything looked like a “dwarf plan”: assign numbers based on hierarchical affine clustering, move, add imbalance. Without details. About this on KDD there will be a separate report from them later, I will try to go. Plus there is a blog post .
Nevertheless, they gave a comparison with some competitors, some of them are open: Spinner ,UB13 from FB, Fennel from Microsoft, Metis . You can look at them too.
Then a little talked about the technical details. They use several paradigms of working with graphs:
- MapReduce over Flume. I didn’t know that this is possible - Flume isn’t written on the Internet either to collect, but not to analyze data. I think that this is an intragular perversion. UPD: I found out that this is really Google’s internal product, which has nothing in common with Apache Flume, there is some of its ersatz in the cloud called dataflow
- MapReduce + Distributed Hash Table. They say that it helps to significantly reduce the number of rounds of MR, but in the internet about this technique is also not so much written, for example, here
- Pregel - they say they will die soon.
- ASYnchronous Message Passing - the coolest, fast and promising.
The ASYMP idea is very similar to Pregel:
- nodes are distributed, keep their state and can send a message to neighbors;
- a queue with priorities is built on the machine, what to send to (the order may differ from the order of addition);
- having received the message, the node can change or not change the state, when changing we send the message to the neighbors;
- finish when all queues are empty.
For example, when searching for connected components, we initialize all vertices to random weights U [0,1], and then start sending each other at least neighbors. Accordingly, having received their minimums from neighbors, we are looking for a minimum of them, etc., until the minimum stabilizes. They note an important point for optimization: collapse messages from one node (for this and turn), leaving only the last. They also talk about how easy it is to do disaster recovery, keeping the state of the nodes.
They say that very fast algorithms are built without problems, it seems to be true - the concept is simple and rational. There are publications .
As a result, the conclusion suggests itself: it is sad to go to stories about closed technologies, but some useful bits can be grasped.