WinDbg setup
WinDbg - allows you to debug user-level 32/64 bit applications, drivers, can be used to analyze emergency memory dumps, WinDbg supports automatic loading of debugging symbols, there is a built-in scripting language to automate the debugging process, you can download the debugger here .
May contain the following:
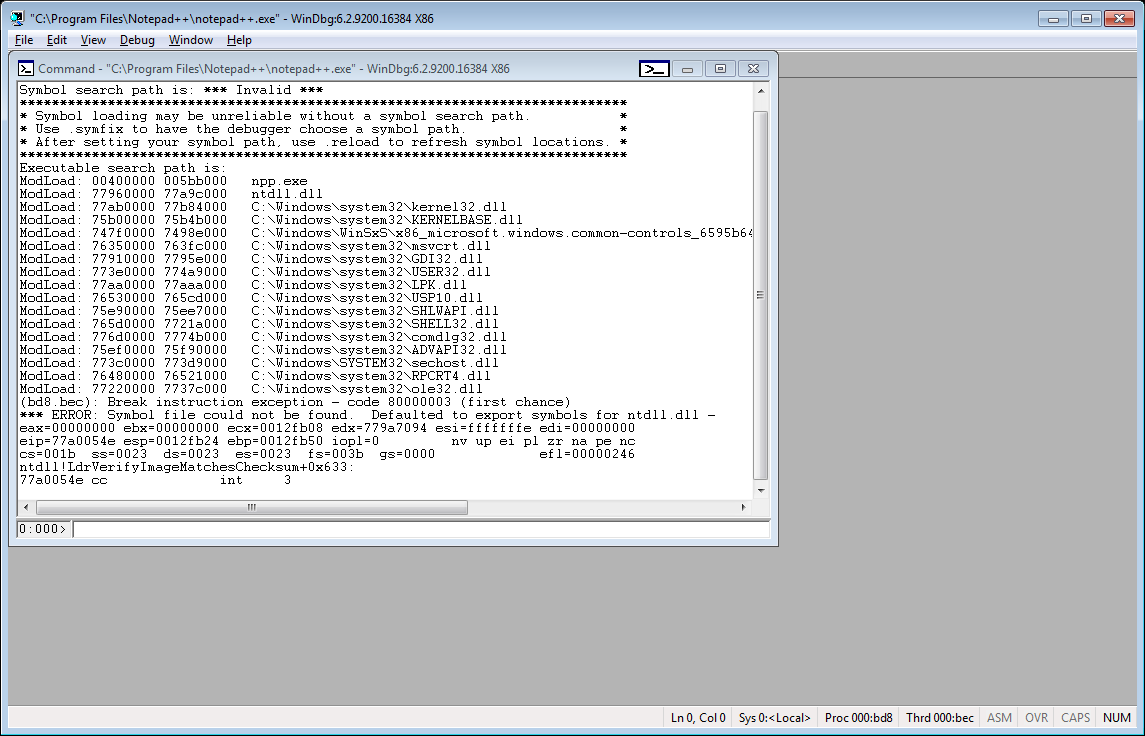
Each debugger has its own strengths, if you need to debug 64-bit applications or you need to debug the driver, then my choice falls on WinDbg. When you start WinDbg for the first time, we get a rather inconvenient workspace, which is what pushes those who use OllyDbg at the beginning.
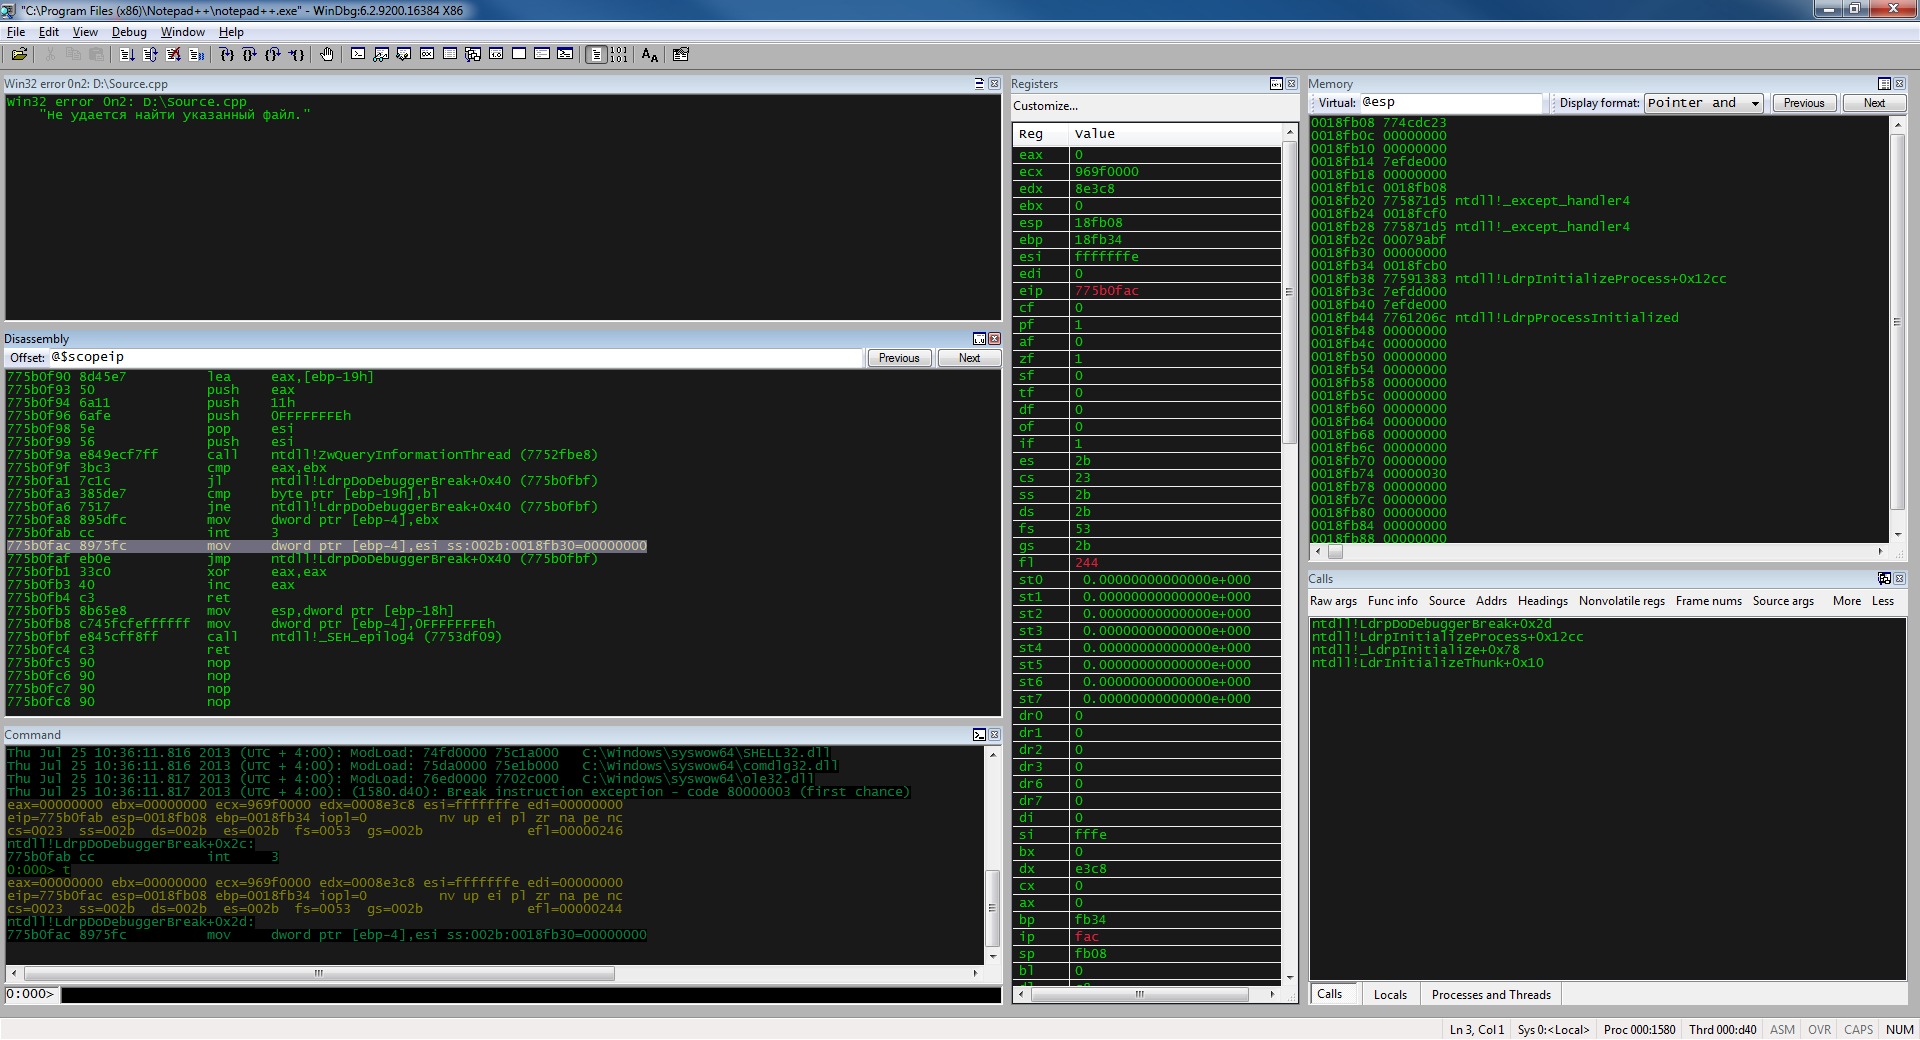
Specially for “pleasant” debugging, I made a sane workspace, with a convenient arrangement of windows and a dark color scheme, close to OllyDbg. You can download it here .
Debugging Extensions - uses the Wait Chain Traversal API to find "waiting" threads and automatically detects deadlocks.
Viscope - draws graphs for code.
Core Analyzer - shows memory analysis and displays the relationship of each object.
pykd - allows you to use python as a language to automate debugging and analysis.
! exploitable - automatic dump analysis and risk assessment.
windbgshark - WinDbg integration with wireshark.
ollymigrate - the plugin allows you to "transfer" debugging from one debugger to another (Supported debuggers: OllyDbg1, OllyDbg2, Immunity Debugger, WinDbg, IDA Pro)
blwdbgue - highlighting in the command window.
WinDbg Highlighted - highlighting asm instructions in the disassembler and command window.
Common WinDbg Commands - A complete list of WinDbg commands grouped thematically.
WinDbg Hotkeys - A list of available hotkeys.
WinDbg Tutorials is a series of Microsoft debugging articles.
WinDbg Uncovered - The project teaches debugging and analysis using WinDbg.
Crash Dump Analysis Poster - dump analysis cheat sheet.
Kate Butenko blog - a blog that describes how to work with crash dumps, memory leaks.
Workspace
May contain the following:
Current Session Information
- All breakpoints.
- Open source files (if any).
- All "aliases" of the user.
Debug Settings
- The path to debugging symbols.
- The path to the debugged application.
- The path to the source folder.
- Debug kernel settings.
- Logging Settings.
GUI Settings
- Font
- The position of the windows relative to the desktop.
- All open windows.
- Register window options.
- Color options for each window.
- Set flags for windows (Calls windows, Locals window, Watch Window).
Each debugger has its own strengths, if you need to debug 64-bit applications or you need to debug the driver, then my choice falls on WinDbg. When you start WinDbg for the first time, we get a rather inconvenient workspace, which is what pushes those who use OllyDbg at the beginning.
Specially for “pleasant” debugging, I made a sane workspace, with a convenient arrangement of windows and a dark color scheme, close to OllyDbg. You can download it here .
List of frequently used commands
Execution control
- g - continue execution.
- p is the step through the function.
- t is the step inside the function.
- pa addr - step to the address.
- pc is the step to the next call.
- pt is the step to the next return.
- pct - step to the next call or return.
Breakpoints
- bp - set a breakpoint, for example bp nt! NtCreateFile.
- bl is a list of breakpoints.
- bd - <number> remove the breakpoint at number.
- bc - <number> clear the breakpoint at number.
- ba is the access breakpoint.
- be - breakpoint for execution.
- bw is the breakpoint on the record.
- sxe ld: kernel32 - breakpoint on loading the module DLL.
Dump
- d <address> - memory dump at the address (b-byte; w-word; d-dword).
- dd <register> - a dump of the contents of the register.
- ddp <address> - dump the contents of the address.
- u <address> - disassemble by address.
Miscellaneous
- .load <dll name> - loads the add-on for WinDbg.
- ! peb - a dump of the Process Environment Block.
- ! teb - dump of Thread Environment Block.
- ! lmi kernel32 - dump information modulo.
- k - show call stack.
- r - show registers.
- x *! - A complete list of modules.
- lm - list of base modules.
- dt <structure name> - show structure if there are debugging symbols.
- .extmatch / D / e ntdll * - show all exported functions for the library.
- ! dlls - show loaded modules.
- ! process 0 0 explorer.exe - get the EPROCESS structure
- ? 0x2D - get the representation of a number in decimal system.
- s -u 0x00000000 L? 0xffffffff "trythis" - search for a string in memory.
- eu addr "trythi1" - change the line at the address.
- .sympath .SRV * D: \ symbols * http: //msdl.microsoft.com/download/symbols/ - download address of the necessary debugging symbols.
- ! token - show privilege information.
- .tlist - show all running processes.
useful links
Extensions
Debugging Extensions - uses the Wait Chain Traversal API to find "waiting" threads and automatically detects deadlocks.
Viscope - draws graphs for code.
Core Analyzer - shows memory analysis and displays the relationship of each object.
pykd - allows you to use python as a language to automate debugging and analysis.
! exploitable - automatic dump analysis and risk assessment.
windbgshark - WinDbg integration with wireshark.
ollymigrate - the plugin allows you to "transfer" debugging from one debugger to another (Supported debuggers: OllyDbg1, OllyDbg2, Immunity Debugger, WinDbg, IDA Pro)
blwdbgue - highlighting in the command window.
WinDbg Highlighted - highlighting asm instructions in the disassembler and command window.
Help
Common WinDbg Commands - A complete list of WinDbg commands grouped thematically.
WinDbg Hotkeys - A list of available hotkeys.
WinDbg Tutorials is a series of Microsoft debugging articles.
WinDbg Uncovered - The project teaches debugging and analysis using WinDbg.
Crash Dump Analysis Poster - dump analysis cheat sheet.
Kate Butenko blog - a blog that describes how to work with crash dumps, memory leaks.
Only registered users can participate in the survey. Please come in.
What debugger do you use for user-level applications?
- 23.1% WinDbg 99
- 41.9% OllyDbg 179
- 20.3% GDB 87
- 42.1% Visual Studio Debugger 180
- 1.1% LLDB 5
- 2.1% IDB 9