July 19, 2013 at 22:59
Map with projections from Proj4js to Canvas
Idea
I decided to write a post about the now-popular Canvas from HTML5 and about my dbCartajs project using it. Why Canvas? A bit of history. Previously, to create images illustrating various computational models (for example, drawing a circle along the radius and center in coordinates, drawing a polygon with the number of vertices N and area S, drawing a circle on a sphere, etc.), I and my colleagues at the institute used various controls from different development environments: PictureBox of their VB6, QPainter and QCanvas from Qt, Canvas from Tk and, finally, image creation using mapfile from MapServer. Later, after exploring the power of HTML5, I decided to switch to using Canvas and Web development with JavaScript. Convenient - only a browser is needed for debugging and development. Gathering my strength and armed with documentation from the W3C, I rewrote some of the functionality of the components, which we use in our work in JavaScript, putting this into the dbCartajs project on GitHub. The code is implemented as a dbCarta object to use it as a widget on pages without copying parts of the source code.
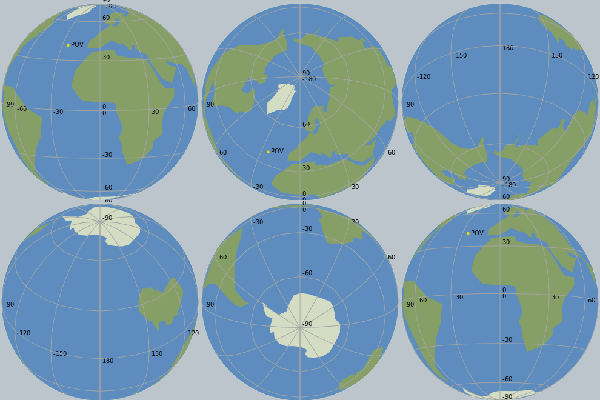
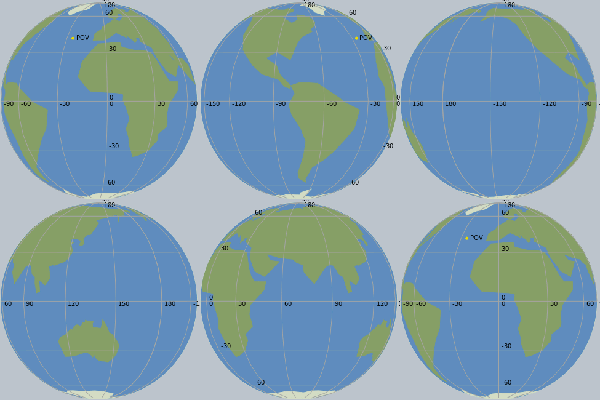
Widgets with dbCarta
Actually, dbCartajs is ideally ported from the dbCarta project to googlecode implemented in Python and Tkinter.
How it works
dbCartajs uses Canvas to output objects by coordinates (longitude, latitude in degrees) or points (points). The project includes the Proj4js library that implements recalculation of cartographic projections. From it, several projections are configured for use - these are spherical nsper, ortho, laea and the Mercator (like the popular Google Maps - Google Mercator). By default, a canvas with an aspect ratio of width-height of 2: 1 is used, which corresponds to the flat projection of longlat from Proj4js. If proj4js-combined.js is loaded, other projections are available via the changeProject or initProj interfaces of the dbCarta object.
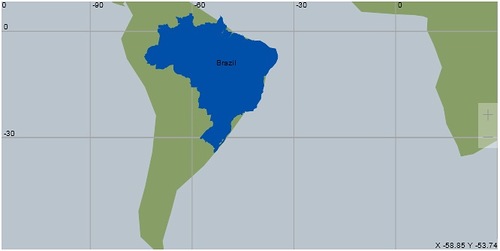
Projection Mercator
Of course, not all Canvas features are implemented in dbCartajs, but I tried to pay attention to some. The first is fonts. When scaling, they do not change. The second is the use of the isPointInPath method, which allows you to implement an analogue of using the MAP, AREA, and IMG elements. And third, the ability to combine objects from different projections. In the StarrySky demo, the nsper spherical projection is used to derive the boundaries of the Earth, the contours of the continents, and the flat projection longlat is used to output stars and orbits of spacecraft. To change projections, use the initProj methods (with projection parameters for Proj4js) or changeProject (without parameters).
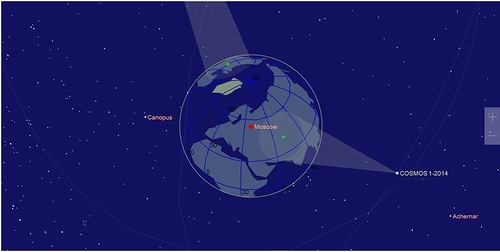
Projection alignment in StarrySky.
About management
Moving on the map is available by click (a point is centered on the click within the map). Map scaling is carried out through the scaleCarta interface or by the ± buttons located on the right. In spherical projections, the rotation of the globe is carried out through the initProj interface.
Where to look
Examples of the project can be found on the website dbcartajs.appspot.com . Sources available in GiHub project dbCartajs .