Introducing IBM Tivoli Monitoring
Hi, Habrahabr!
Today I will tell you about one of the IBM products for monitoring servers and applications. I have always closely monitored publications on the topic of monitoring, and according to my feelings, they have recently sharply decreased. Well, I’ll try to somehow fill this annoying gap.
Why exactly ITM (IBM Tivoli Monitoring) you ask, it just so happened that for several years I have been implementing and configuring this product and want to share my impressions of working with it.

If you are interested in getting to know ITM or just want to see what is hidden behind this mysterious window, then I ask for it under habrakat.
Let's get started with the system architecture.
IBM engineers did not reinvent the wheel and went on a proven path.
Architecture of IBM Tivoli Monitoring

I do not want to load readers with unnecessary details, therefore I will outline everything in large strokes. There is a main monitoring server TEMS (Tivoli Enterprise Monitoring Server), portal server TEPS (Tivoli Enterprise Portal Server), monitoring agents and a database (DB2, MSSQL, Oracle or embedded Derby) in which all information is stored.
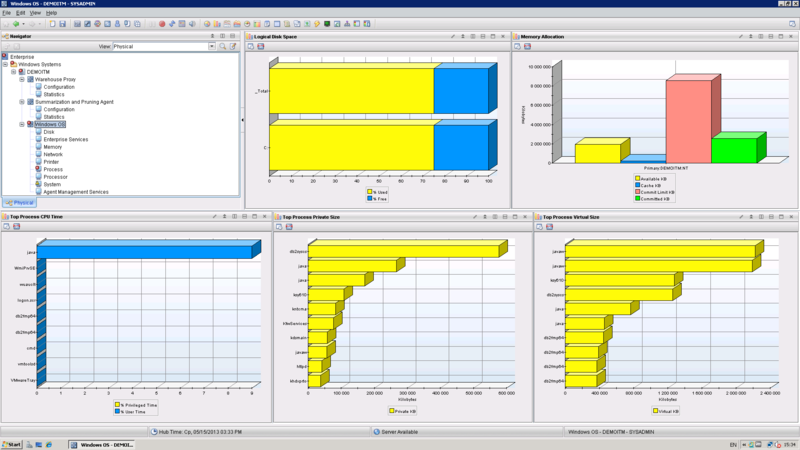
Everything works like a Swiss watch in the system’s operation, at least in my practice there hasn’t been a single case where a system put into commercial operation failed (maybe customers are hiding something?). Agents collect information and transmit it to the monitoring server, then on the monitoring server this information is analyzed, and when thresholds are exceeded, situations are triggered. To the user, all this beauty is accessible through the client to the portal server, which is called TEP (Tivoli Enterprise Portal) and is available in the desktop and browser versions.
Tivoli Enterprise Portal Interface
In general, I will say the following about architecture:
- Good scalability, reliability and ease of distribution / management of agents from the center
- Updating the system in some cases can lead to even the most calm and peaceful person.
Next, I would like to introduce you to the main features of ITM.
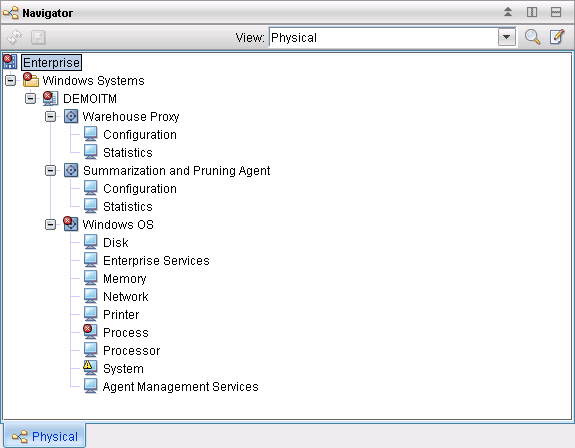
It is not at all difficult to guess that this is the main function of any monitoring system. For the collection of information, as I said, agents are responsible. Most of them are installed on the server that needs to be monitored, however, there are agents collecting parameters remotely. I will not list the list of agents in the article - you can familiarize yourself with it on the IBM website and, believe me, there are a lot of them. Well, for especially sophisticated customers, you can always develop a unique agent that will cover any needs, for this there is Agent Builder.
Managed Systems and Agents
After the parameters arrive in TEMS, their values are compared with threshold values and situations are triggered when the threshold is exceeded. Of course, all thresholds can be changed at your discretion and create new situations.
Active situations

All this is good, and when problems arise, administrators can quickly solve them, but sometimes the occurrence of a problem can be completely avoided. For predictive analysis purposes, ITM uses TPA (Tivoli Performance Analyzer). I anticipate that most readers will have some doubts about its performance, I was skeptical before meeting TPA and thought that everything would work, to put it mildly, not as the manufacturer promised. But I’ll tell you - it works, yes, you need a lot of information for analysis, i.e. I cannot build an accurate forecast on the data for the week, but overall I have a positive impression of TPA.
I will outline the main points for implementing the monitoring function:
- A large number of monitoring agents and the ability to develop their own agents. A rather voluminous set of pre-configured situations
is supplied with the agents - I won’t go into details, but when installing some agents I have to restart the TEMS / TEPS software part, which cannot but upset
A very useful feature because we all know how management loves reporting.
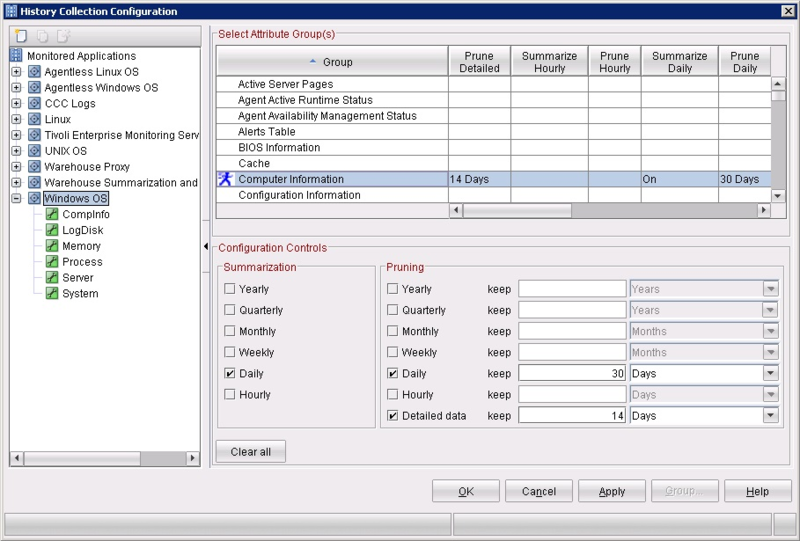
Historical information is collected in the Warehouse database, and then various reports are built on the basis of this information. The averaging and purification of historical data is handled by the Summarization & Pruning agent. Cognos acts as a reporting engine; reports are managed through the Tivoli Integrated Portal - this is a single portal for managing all Tivoli products, at least that's how it is positioned. Historical information is also used for predictive analysis, which I mentioned in the previous section.
Historical information collection configuration
I have no complaints about collecting historical information, everything works as it should.
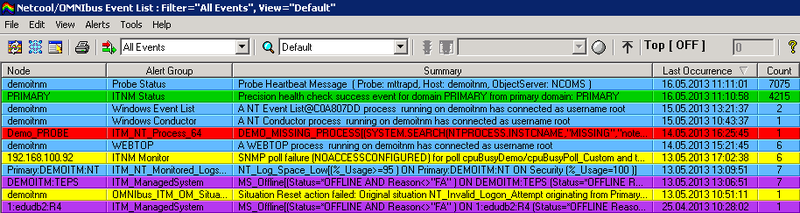
You can integrate with a wide range of products. It can be monitoring systems, event processing information systems, in general, any systems that, one way or another, serve to work with situations, events or monitoring parameters. The logical continuation for working with situations is their transfer to the event information processing system. In the Tivoli line, it's Netcool / OMNIbus.
The processing system of event information
Next is possible to integrate with Service Desk systems and quality control systems to provide services, for example, TBSM (Tivoli Business Service Manager) - Habre has a small article .
As for integration, I can say the following:
- A large number of supported systems "out of the box" and, if desired, ITM integrates with almost any product
- I thought about the minuses for a long time. Yes, integration does not always go smoothly, but on the whole I can’t single out significant shortcomings.
Well, on this optimistic note, I will be rounded.
I tried to describe the system as concisely and objectively as possible. In order not to bore readers with a large number of technical details, I described the work in general terms and behind the scenes there remained a huge layer of interesting solutions, which I may write about in future articles. And in conclusion, I want to summarize - this is my vision of what ITM currently represents.
- Monitoring system for a huge number of heterogeneous components of the information infrastructure
- Suitable for monitoring both small and huge infrastructure
- Contains everything you need to create reports of any complexity
- Integrates seamlessly with most systems
- Not the cheapest and most demanding software resources
Today I will tell you about one of the IBM products for monitoring servers and applications. I have always closely monitored publications on the topic of monitoring, and according to my feelings, they have recently sharply decreased. Well, I’ll try to somehow fill this annoying gap.
Why exactly ITM (IBM Tivoli Monitoring) you ask, it just so happened that for several years I have been implementing and configuring this product and want to share my impressions of working with it.
If you are interested in getting to know ITM or just want to see what is hidden behind this mysterious window, then I ask for it under habrakat.
Let's get started with the system architecture.
Architecture.
IBM engineers did not reinvent the wheel and went on a proven path.
Architecture of IBM Tivoli Monitoring
I do not want to load readers with unnecessary details, therefore I will outline everything in large strokes. There is a main monitoring server TEMS (Tivoli Enterprise Monitoring Server), portal server TEPS (Tivoli Enterprise Portal Server), monitoring agents and a database (DB2, MSSQL, Oracle or embedded Derby) in which all information is stored.
Everything works like a Swiss watch in the system’s operation, at least in my practice there hasn’t been a single case where a system put into commercial operation failed (maybe customers are hiding something?). Agents collect information and transmit it to the monitoring server, then on the monitoring server this information is analyzed, and when thresholds are exceeded, situations are triggered. To the user, all this beauty is accessible through the client to the portal server, which is called TEP (Tivoli Enterprise Portal) and is available in the desktop and browser versions.
Tivoli Enterprise Portal Interface
In general, I will say the following about architecture:
- Good scalability, reliability and ease of distribution / management of agents from the center
- Updating the system in some cases can lead to even the most calm and peaceful person.
Next, I would like to introduce you to the main features of ITM.
Monitoring server and application settings.
It is not at all difficult to guess that this is the main function of any monitoring system. For the collection of information, as I said, agents are responsible. Most of them are installed on the server that needs to be monitored, however, there are agents collecting parameters remotely. I will not list the list of agents in the article - you can familiarize yourself with it on the IBM website and, believe me, there are a lot of them. Well, for especially sophisticated customers, you can always develop a unique agent that will cover any needs, for this there is Agent Builder.
Managed Systems and Agents
After the parameters arrive in TEMS, their values are compared with threshold values and situations are triggered when the threshold is exceeded. Of course, all thresholds can be changed at your discretion and create new situations.
Active situations
All this is good, and when problems arise, administrators can quickly solve them, but sometimes the occurrence of a problem can be completely avoided. For predictive analysis purposes, ITM uses TPA (Tivoli Performance Analyzer). I anticipate that most readers will have some doubts about its performance, I was skeptical before meeting TPA and thought that everything would work, to put it mildly, not as the manufacturer promised. But I’ll tell you - it works, yes, you need a lot of information for analysis, i.e. I cannot build an accurate forecast on the data for the week, but overall I have a positive impression of TPA.
I will outline the main points for implementing the monitoring function:
- A large number of monitoring agents and the ability to develop their own agents. A rather voluminous set of pre-configured situations
is supplied with the agents - I won’t go into details, but when installing some agents I have to restart the TEMS / TEPS software part, which cannot but upset
Collection of historical information.
A very useful feature because we all know how management loves reporting.
Historical information is collected in the Warehouse database, and then various reports are built on the basis of this information. The averaging and purification of historical data is handled by the Summarization & Pruning agent. Cognos acts as a reporting engine; reports are managed through the Tivoli Integrated Portal - this is a single portal for managing all Tivoli products, at least that's how it is positioned. Historical information is also used for predictive analysis, which I mentioned in the previous section.
Historical information collection configuration
I have no complaints about collecting historical information, everything works as it should.
Integration.
You can integrate with a wide range of products. It can be monitoring systems, event processing information systems, in general, any systems that, one way or another, serve to work with situations, events or monitoring parameters. The logical continuation for working with situations is their transfer to the event information processing system. In the Tivoli line, it's Netcool / OMNIbus.
The processing system of event information
Next is possible to integrate with Service Desk systems and quality control systems to provide services, for example, TBSM (Tivoli Business Service Manager) - Habre has a small article .
As for integration, I can say the following:
- A large number of supported systems "out of the box" and, if desired, ITM integrates with almost any product
- I thought about the minuses for a long time. Yes, integration does not always go smoothly, but on the whole I can’t single out significant shortcomings.
Well, on this optimistic note, I will be rounded.
Conclusion
I tried to describe the system as concisely and objectively as possible. In order not to bore readers with a large number of technical details, I described the work in general terms and behind the scenes there remained a huge layer of interesting solutions, which I may write about in future articles. And in conclusion, I want to summarize - this is my vision of what ITM currently represents.
- Monitoring system for a huge number of heterogeneous components of the information infrastructure
- Suitable for monitoring both small and huge infrastructure
- Contains everything you need to create reports of any complexity
- Integrates seamlessly with most systems
- Not the cheapest and most demanding software resources