How are the technical indicators in the stock markets
Anyone who has ever been interested in stock or cryptocurrency markets has seen these additional lines. And you probably heard opinions from experienced traders that they do not work and how they do not use anything. But to many, they are very helpful and my trading terminal, which I lazily look at once a day, looks something like the image below.
How are they all arranged? And who can this be useful? You should definitely read this if:

A technical indicator is most often a window, weight or recurrent function of prices and volumes that come from the exchange in the array of candlesticks TOHLCV (unix time, open, high, low, close, volume). Various filtering, highs, lows or other indicators can also be used as a basis for subsequent calculations.
Moving Average (SMA)
When implementing indicators it is very convenient to use the functional programming approach. For example, a moving average is just the average of each value of a sliding window function at the closing price.
where the mean () function is the average value, the window parameter is the window size, and rolling () is a combination of the window function, which for each current array cell produces an array of the last n elements, and an operation that minimizes the window into a number.
The moving average is a lagging indicator and helps determine the trend. It is drawn by overlaying over the price chart and the first values are usually usually discarded.
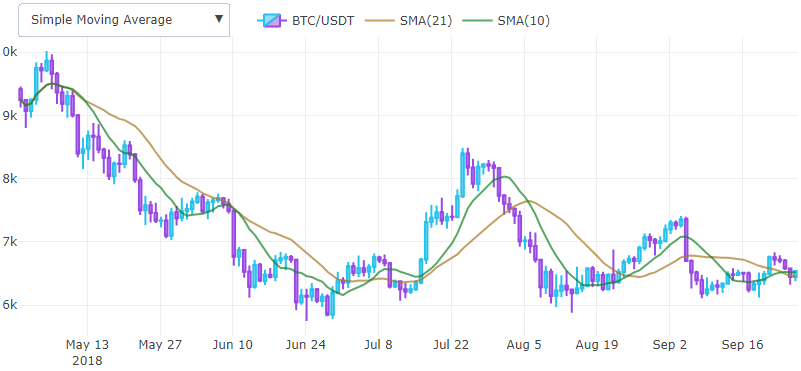
Usually consider a pair of indicators and a point when an indicator with a short window crosses the indicator with a long window from below is considered as a potential entry point, and from above - an exit. In practice, an exponentially weighted moving average is used more often, using a weighted window function to reduce the lag effect.
Standard Deviation (STDEV)
If we replace the mean () function with the root of the variance sd () in the previous version, then we obtain the already-squared root-mean-square deviation.
Dispersion is considered to be the usual way known in all, most often without Bessel correction. It is also the root of the dispersion that is used, since the dispersion itself is measured in square rubles / dollars.
Bollinger Bands (BB)
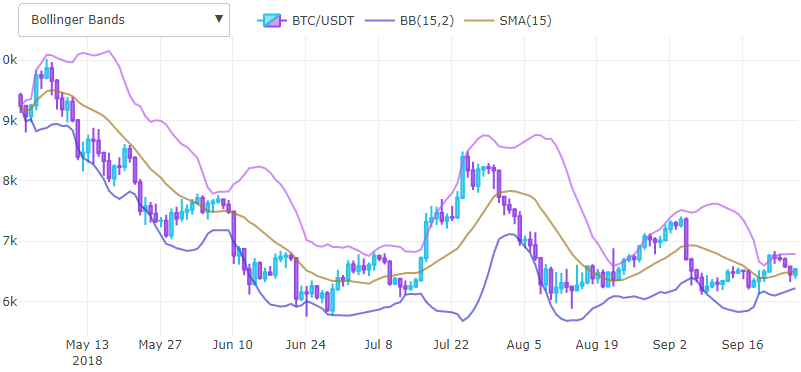
Thus, we have already received two basic indicators that can already be combined and get new ones. For example, if we add up the moving average and standard deviation point by point, while multiplying by 2, we get the upper part of the Bollinger band, and if we subtract the lower part.
In the code it will look like this.
where the function is pointwise, does nothing else, except by elementwise collecting one of the two arrays using the operation given to it.
Bollinger Bands help determine a lull before a large price movement, and are used as a tool for conveniently displaying volatility on a chart, do not display the standard deviation overlay on the same chart as the price, so it is convenient to postpone it from the moving average.
Exponentially Weighted Moving Average (EMA)
How can I reduce the latency of a moving average? Since, when calculating it, n last closing prices are added, it is possible to understand what can be added with some weight, reducing the contribution of old prices. Thus, we come to the formula of a weighted window function.
if a and choose some constant less than one, we get infinitely decreasing weight, if we add prices starting from the newest one.

You can greatly simplify the calculations if you ignore the contribution of the tails . By extending the window size to its entire length, you can get a recursive definition.
In the end, we need to choose some value as a smoothing constant. You can show that if you takethe center of mass of the weight graphs EMA and SMA above becomes the same. In the code, it all looks much simpler.
In general, this is the same moving average, but more sensitive.

Efficiency of use depends on your experience and settings used. For example, on this site, the parameters are quite well chosen.
The convergence / divergence of moving averages (MACD)
Gerald Appel in 1979 came up with one of the most simple and at the same time effective oscillators of price points. It converts two EMA trend indicators into a moment indicator, taking the best from two worlds. That is, he, roughly speaking, finds a derivative. It is drawn in a separate window with two lines and a histogram, and not an overlay like the previous ones. In fact, there are much more indicators that are drawn in a separate window, but this may be some other time.
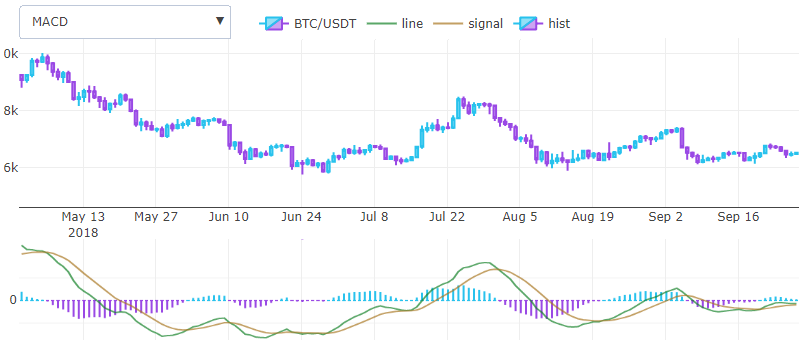
The calculation formula is quite simple, two ema with a dyn and a short window are taken, for example, 26 and 12 units, and subtracted, the resulting line will be the desired indicator. Taking from this difference another ema with a step of 3 units, we obtain a signal line. The histogram that Gerald added later is calculated by the difference between the two previous results and is essentially a weighted average.
Testing indicators, normalized root-mean-square error.
Having accurate tables with indicator values, you can qualitatively test your calculation. There are various ways of determining the measure of error between two functions, but practice has shown that the normalized root-mean-square error, which is considered as
works best, both at small and large values. For example, bitcoin in dollars can cost $ 20,000 and the difference of $ 10 is not critical, at the same time, one altcoin can be calculated by several satoshi.
Conclusion
In a few lines you can express basic indicators, if you plan to perform their analysis by machine learning, then to determine the ideal entry points, I advise you to pay attention to the ZigZag indicator, which is not useful for trading, but extremely useful as a teacher. It should also be borne in mind that for trading you need to choose the most dissimilar indicators and try to change their input parameters. You can try to automatically change them over time, since the most effective parameters tend to change.
Sources used
1. StockCharts - a list of algorithms with test data in tables
2. Cryptowatch - well-tuned parameters of indicators
3. Github - source code
How are they all arranged? And who can this be useful? You should definitely read this if:
- You use them in your trade.
- You are planning to write a trading robot
- Do you want to implement a trading strategy yourself?
A technical indicator is most often a window, weight or recurrent function of prices and volumes that come from the exchange in the array of candlesticks TOHLCV (unix time, open, high, low, close, volume). Various filtering, highs, lows or other indicators can also be used as a basis for subsequent calculations.
Moving Average (SMA)
When implementing indicators it is very convenient to use the functional programming approach. For example, a moving average is just the average of each value of a sliding window function at the closing price.
functionsma($close, window) {
  return rolling(x => mean(x), window, $close);
}
where the mean () function is the average value, the window parameter is the window size, and rolling () is a combination of the window function, which for each current array cell produces an array of the last n elements, and an operation that minimizes the window into a number.
functionrolling(operation, window, array) {
  let result = [];
  for (let i = 0; i < array.length; i++) {
    if (i + 1 < window) {
      result.push(NaN);
    } else {
      result.push(operation(array.slice(i + 1 - window, i + 1)));
    }
  }
  return result;
}
The moving average is a lagging indicator and helps determine the trend. It is drawn by overlaying over the price chart and the first values are usually usually discarded.
Usually consider a pair of indicators and a point when an indicator with a short window crosses the indicator with a long window from below is considered as a potential entry point, and from above - an exit. In practice, an exponentially weighted moving average is used more often, using a weighted window function to reduce the lag effect.
Standard Deviation (STDEV)
If we replace the mean () function with the root of the variance sd () in the previous version, then we obtain the already-squared root-mean-square deviation.
functionstdev($close, window) {
  return rolling(x => sd(x), window, $close);
}
Dispersion is considered to be the usual way known in all, most often without Bessel correction. It is also the root of the dispersion that is used, since the dispersion itself is measured in square rubles / dollars.
Bollinger Bands (BB)
Thus, we have already received two basic indicators that can already be combined and get new ones. For example, if we add up the moving average and standard deviation point by point, while multiplying by 2, we get the upper part of the Bollinger band, and if we subtract the lower part.
In the code it will look like this.
functionbb($close, window, mult) {
  let middle = sma($close, window);
  let upper = pointwise((a, b) => a + b * mult, middle, stdev($close, window));
  let lower = pointwise((a, b) => a - b * mult, middle, stdev($close, window));
  return { lower : lower, upper : upper};
}
where the function is pointwise, does nothing else, except by elementwise collecting one of the two arrays using the operation given to it.
Bollinger Bands help determine a lull before a large price movement, and are used as a tool for conveniently displaying volatility on a chart, do not display the standard deviation overlay on the same chart as the price, so it is convenient to postpone it from the moving average.
Note
У этого индикатора есть один недостаток — он использует экспоненциально взвешенные функции. Как упражнение, можете попробовать самостоятельно его преобразовать, не забывайте учитывать, что стандартное отклонение тоже нужно высчитывать экспоненциально взвешенно.
Exponentially Weighted Moving Average (EMA)
How can I reduce the latency of a moving average? Since, when calculating it, n last closing prices are added, it is possible to understand what can be added with some weight, reducing the contribution of old prices. Thus, we come to the formula of a weighted window function.
if a and choose some constant less than one, we get infinitely decreasing weight, if we add prices starting from the newest one.
You can greatly simplify the calculations if you ignore the contribution of the tails . By extending the window size to its entire length, you can get a recursive definition.
In the end, we need to choose some value as a smoothing constant. You can show that if you takethe center of mass of the weight graphs EMA and SMA above becomes the same. In the code, it all looks much simpler.
functionema($close, window, weight = null) {
  weight = weight ? weight : 2 / (window + 1);
  let ema = [ mean($close.slice(0, window)) ];
  for (let i = 1; i < $close.length; i++) {
    ema.push($close[i] * weight + ema[i - 1] * (1 - weight));
  };
  return ema;
}
In general, this is the same moving average, but more sensitive.
Efficiency of use depends on your experience and settings used. For example, on this site, the parameters are quite well chosen.
The convergence / divergence of moving averages (MACD)
Gerald Appel in 1979 came up with one of the most simple and at the same time effective oscillators of price points. It converts two EMA trend indicators into a moment indicator, taking the best from two worlds. That is, he, roughly speaking, finds a derivative. It is drawn in a separate window with two lines and a histogram, and not an overlay like the previous ones. In fact, there are much more indicators that are drawn in a separate window, but this may be some other time.
The calculation formula is quite simple, two ema with a dyn and a short window are taken, for example, 26 and 12 units, and subtracted, the resulting line will be the desired indicator. Taking from this difference another ema with a step of 3 units, we obtain a signal line. The histogram that Gerald added later is calculated by the difference between the two previous results and is essentially a weighted average.
functionmacd($close, wshort, wlong, wsig) {
  let line = pointwise((a, b) => a - b, ema($close, wshort), ema($close, wlong));
  let signal = ema(line, wsig);
  let hist = pointwise((a, b) => a - b, line, signal);
  return { line : line, signal : signal, hist : hist };
}
Testing indicators, normalized root-mean-square error.
Having accurate tables with indicator values, you can qualitatively test your calculation. There are various ways of determining the measure of error between two functions, but practice has shown that the normalized root-mean-square error, which is considered as
works best, both at small and large values. For example, bitcoin in dollars can cost $ 20,000 and the difference of $ 10 is not critical, at the same time, one altcoin can be calculated by several satoshi.
functionnrmse(f, g) {
  let sqrDiff = pointwise((a, b) => (a - b) * (a - b), f, g);
  returnMath.sqrt(mean(sqrDiff)) / (Math.max(...f) - Math.min(...f));
}
Conclusion
In a few lines you can express basic indicators, if you plan to perform their analysis by machine learning, then to determine the ideal entry points, I advise you to pay attention to the ZigZag indicator, which is not useful for trading, but extremely useful as a teacher. It should also be borne in mind that for trading you need to choose the most dissimilar indicators and try to change their input parameters. You can try to automatically change them over time, since the most effective parameters tend to change.
Sources used
1. StockCharts - a list of algorithms with test data in tables
2. Cryptowatch - well-tuned parameters of indicators
3. Github - source code