Finger Wavelet Compression
- Tutorial
Wavelets are now well known. Even inexperienced in mathematics people probably heard that with their help it is possible to compress images and videos while maintaining acceptable quality. But what is a wavelet? Wikipedia answers this question with a whole heap of formulas for which it is not so easy to see the essence.
Let's try using simple examples to figure out where the wavelets come from and how they can be used in compression. It is assumed that the reader is familiar with the basics of linear algebra, is not afraid of the words vector and matrix, and also knows how to multiply them. (And in the second part we will even try to program something.)
Image compression
Simplistically, an image is a table in the cells of which the colors of each pixel are stored. If we work with a black-and-white (or, more precisely, gray) image, then instead of color, the brightness values from the interval [0, 1] are placed in the cells. In this case, 0 corresponds to black, 1 to white. But it is inconvenient to work with fractions, so often the brightness values are taken integers from the range from 0 to 255. Then each value will occupy exactly 1 byte.
Even small images require a lot of memory to store. So, if we encode the brightness of each pixel with one byte, then the image of one frame in FullHD format (1920 × 1080) will take almost two megabytes. Imagine how much memory you need to store a half hour movie!
Therefore, images tend to compress. That is, encode in such a way that less storage is required. And while watching, we decode the data recorded in the memory and get the original frame. But this is only ideal.
There are many data compression algorithms. Their number can be judged by the formats supported by modern archivers: ZIP, 7Z, RAR, ACE, GZIP, HA, BZ2 and so on. It is not surprising that thanks to the active work of scientists and programmers, the degree of data compression has now come close to the theoretical limit.
The bad news is that for the image this theoretical limit is not so great. Try to save the photo (especially with a lot of small details) in PNG format - the size of the resulting file may upset you.
This is due to the fact that in images from the real world (photographs, for example), brightness values are rarely the same even for neighboring pixels. There are always the smallest vibrations that are elusive to the human eye, but which the compression algorithm is honestly trying to take into account.
Compression algorithms “love” when there is a pattern in the data. Long sequences of zeros are best compressed (the pattern is obvious here). In fact, instead of writing 100 zeros to the memory, you can simply write the number 100 (of course, with a note that this is exactly the number of zeros). The decoding program will “understand” that zeros were meant and reproduce them.
However, if in our sequence in the middle one suddenly appears, then one number 100 will not be limited.
But why code absolutely all the details? Indeed, when we look at a photograph, the overall pattern is important to us, and we will not notice slight fluctuations in brightness. So, when encoding, we can slightly change the image so that it is well encoded. In this case, the compression ratio will immediately increase. True, the decoded image will slightly differ from the original, but who will notice?
Haar Transformation
So, our goal is to transform the image so that it is well compressed by classical algorithms. Let's think about how to change it to get long chains of zeros.
"Real" images, such as photographs, have one feature - the brightness of neighboring pixels usually differs by a small amount. In fact, in the world you can rarely see sharp, contrasting differences in brightness. And if they are, then they occupy only a small part of the image.
Consider a fragment of the first row of brightnesses from the famous Lenna image (in the picture).

154, 155, 156, 157, 157, 157, 158, 156
It can be seen that the neighboring numbers are very close. To get the desired zeros, or at least something close to them, you can separately encode the first number, and then consider only the differences of each number from the previous one.
We get:
154, 1, 1, 1, 0, 0, 1, -2.
Already better! This method is actually used and is called delta coding. But he has a serious drawback - he is non-local. That is, you can’t take a piece of the sequence and find out which brightness in it is encoded without decoding all the values in front of this piece.
Let's try differently. We will not try to immediately get a good sequence, we will try to improve it at least a little.
To do this, we divide all the numbers into pairs and find the half-sums and half-differences of the values in each of them.
(154, 155), (156, 157), (157, 157), (158, 156)
(154.5, 0.5), (156.5, 0.5), (157, 0.0), (157, -1.0)
Why exactly half-sums and half-differences? And everything is very simple! Half-sum is the average value of the brightness of a pair of pixels. And half-difference carries information about the differences between the values in a pair. Obviously, knowing the half-sum of a and the half-difference of d, one can also find the values themselves: the
first value in the pair = a - d, the
second value in the pair = a + d.
This transformation was proposed in 1909 by Alfred Haar and bears his name.
And where is the compression?
The obtained numbers can be rearranged according to the principle “flies separately, cutlets separately”, dividing half-sums and half-differences:
154.5, 156.5, 157, 157; 0.5, 0.5, 0.0, -1.0.
The numbers in the second half of the sequence will usually be small (the fact that they are not integers, albeit not embarrassing). Why is that?
As we found out earlier, in real images, neighboring pixels rarely differ significantly from each other. If the value of one is great, then the other is great. In such cases, it is said that neighboring pixels are correlated.
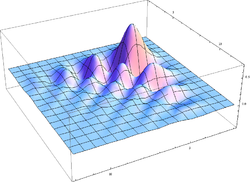
In fact, consider the first 2000 pairs of neighboring pixels and represent each pair as a point on the graph.

All points are aligned along one straight line. And so in almost all real images. The upper left and lower right corners of the image are almost always empty.
And now we will consider the chart in which points will be half-sums and half-differences.

It can be seen that the half differences are in a much narrower range of values. This means that you can spend less than one byte on them. Any, but compression.
Let's apply the math!
Let's try to write mathematical expressions that describe the Haar transformation.
So, we had a pair of pixels (vector)
 , and we want to get a pair
  .
. Such a transformation is described by a matrix
 .
. In fact
 , what we needed.
 An attentive reader must have noticed that the patterns of the dots on the last two graphs are the same. The only difference is turning at an angle of 45 °.
In mathematics, rotations and stretches are called affine transformations and are described just by multiplying the matrix by a vector. What we got above. That is, the Haar transformation is just turning the points so that they can be conveniently and compactly encoded.
True, there is one caveat. With affine transformations, the area of a figure can change. Not that it was bad, but somehow inaccurate. As is known, the coefficient of change in area is equal to the determinant of the matrix. Let's see what it is for the Haar transformation.

In order for the determinant to become equal to unity, it is enough to multiply each element of the matrix by
 . This will not affect the rotation angle (and, therefore, the “compressive ability” of the transformation).
 We get the matrix as a result

How to decode?
As is known, if a determinant of a matrix is not equal to zero, then for it there exists an inverse matrix that "cancels" its action. If we find the inverse matrix for H, then decoding will simply consist of multiplying vectors with half-sums and half-differences by it.

Generally speaking, finding an inverse matrix is not such a simple task. But maybe we can somehow simplify this task?
Let's take a closer look at our matrix. It consists of two row vectors:
 and
and  . Call them v 1 and v 2 .
 They have interesting properties.
First, their lengths are 1, that is
 . Here the letter T stands for transposition. Multiplying a row vector by a transposed row vector is a scalar product.
Secondly, they are orthogonal, that is
 .
. A matrix whose rows have the indicated properties is called orthogonal. An extremely important property of such matrices is that the inverse matrix for them can be obtained by simple transposition.

The validity of this expression can be verified by multiplying the H inverse matrix. On the diagonal, we get the scalar products of the vector rows by ourselves, that is 1. And outside the diagonals, the scalar products of the vector rows by each other, that is 0. As a result, the product will be equal to the identity matrix.
We love orthogonal matrices!
Increase the number of points
All of the above works well for two points. But what if there are more points?
In this case, one can also describe the transformation by a matrix, but larger in size. The diagonal of this matrix will consist of matrices H, so in a vector of initial values pairs will be selected to which the Haar transformation will be applied independently.

I.e. the original vector is simply processed independently in pairs.
Filters
So, when we know how to perform the Haar transformation, let's try to figure out what it gives us.
The resulting "half-sums" (due to the fact that we do not divide by 2, we have to use quotation marks) are, as we have already found out, the average values in pairs of pixels. That is, in fact, half-sums are a small copy of the original image! Reduced because half the amount is half as much as the original pixels.
But what are differences?
Half-sums average brightness values, that is, “filter out” random bursts of values. We can assume that this is some kind of frequency filter.
Similarly, differences “distinguish” inter-pixel “bursts” from values and eliminate the constant component. That is, they “filter out” the low frequencies.
Thus, the Haar transformation is a pair of filters that separate the signal into low-frequency and high-frequency components. To get the original signal, you just need to combine these components again.
What does this give us? Suppose we have a portrait photo. The low-frequency component carries information about the general shape of the face, about smooth differences in brightness. High-frequency is noise and small details.
Usually, when we look at a portrait, we are more interested in the low-frequency component, which means that during compression, some of the high-frequency data can be discarded. Moreover, as we found out, it usually has lower values, which means it is more compactly encoded.
The compression ratio can be increased by applying the Haar transform many times. In fact, the high-frequency component is only half of the entire set of numbers. But what prevents us from applying our procedure again to low-frequency data? After repeated use, high-frequency information will occupy already 75%.
Although we have so far talked about one-dimensional chains of numbers, this approach is well applicable for two-dimensional data. To perform a two-dimensional Haar transformation (or similar), you only need to perform it for each row and for each column.
After repeated application to, for example, photographs of the castle of Liechtenstein, we obtain the following figure.
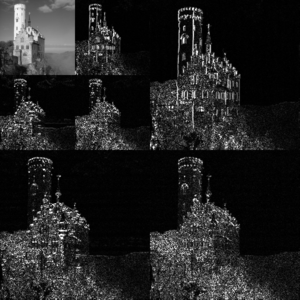
Black areas correspond to low brightness, that is, values close to zero. As practice shows, if the value is small enough, then it can be rounded or even zeroed out without much damage to the decoded picture.
This process is called quantization. And it is at this stage that a part of the information is lost. (By the way, the same approach is used in JPEG, only there, instead of the Haar transform, a discrete cosine transform is used.) By changing the number of nullable coefficients, you can adjust the compression ratio!
Of course, if you reset too much, then the distortions will become visible to the eye. Everything needs a measure!
After all these actions, we will have a matrix containing many zeros. It can be written line by line to a file and compressed by some kind of archiver. For example, the same 7Z. The result will be quite good.
Decoding is performed in the reverse order: we unpack the archive, apply the inverse Haar transform and write the decoded picture to a file. Voila!
Where is the Haar transformation effective?
When will the Haar transformation give the best result? Obviously, when we get a lot of zeros, that is, when the image contains long sections of the same brightness values. Then all differences will be reset to zero. This can be, for example, an x-ray, a scanned document.
It is said that the Haar transformation eliminates the constant component (it is also a moment of zero order), that is, translates constants to zeros.
But still in real photographs there are not so many areas with the same brightness. Let's try to improve the transformation so that it also resets the linear component. In other words, if the brightness values increase linearly, then they will also be reset to zero.
This task, and more complex ones (eliminating moments of higher orders), was solved by Ingrid Dobesi, one of the creators of the wavelet theory.
Transformation of Daubeshi
For our advanced conversion, there will already be few two points. Therefore, we will take four values, shifting each time by two.
That is, if the initial sequence is 1, 2, 3, 4, 5, 6, ..., N-1, N, then we take the fours (1, 2, 3, 4), (3, 4, 5, 6) etc. The last four “bites the sequence by the tail”: (N-1, N, 1, 2).
In the same way, we will try to build two filters: high-pass and low-pass. Each four will be replaced by two numbers. Since the fours overlap, the number of values after the conversion does not change.
In order to make it convenient to read the inverse matrix, we also require the orthogonality of the transformation. Then the search for the inverse matrix reduces to transposition
Let the brightness values in the four be x, y, z, t. Then we write the first filter in the form of

Four coefficients forming a row vector of the transformation matrix, while we are not aware.
In order for the row vector of the coefficients of the second filter to be orthogonal to the first, we take the same coefficients but rearrange them and change signs:

The transformation matrix will have the form.

The requirement of orthogonality is satisfied automatically for the first and second rows. We require that lines 1 and 3 be also orthogonal:

Vectors must have a unit length (otherwise the determinant will not be single): A

transformation should zero out a chain of identical values (for example, (1, 1, 1, 1)): A

transformation should zero out a chain of linearly increasing values (e.g. (1, 2, 3, 4)):

By the way, if this four is zeroed, then any other linearly growing or linearly decreasing ones will be reset. This can be easily verified by writing the corresponding equation and dividing all the coefficients by the first factor.
Got 4 equations linking the coefficients. Solving them, we get:

Substituting them into the matrix, we obtain the desired transformation. After applying it to photos, we get more zeros and small coefficients, which will compress the image more.
Another nice feature - artifacts after quantization will not be so noticeable.
This transformation is called the D4 wavelet (the reader is invited to independently solve the mystery of this alphanumeric name).
Other wavelets
Of course, we can not stop here, and demand the elimination of the parabolic component (second-order moment) and so on. As a result, we get the wavelets D6, D8 and others.
In order not to count everything manually, the odds can be viewed on Wikipedia .
Daubechies discovered a very interesting way of obtaining the coefficients of these transformations, but alas, this is already beyond the scope of our article.
Homework
To finally understand the basics, I suggest writing a program in your favorite language that opens the image, performs Haar (or even D4) conversion, quantizes the result, and then saves the result to a file. Try compressing this file with your favorite archiver. Shrinks well?
Try performing the inverse transform. How do you explain the nature of artifacts in the image?
Conclusion
So, we briefly examined the main ideas of the discrete wavelet transform.
Of course, many interesting mathematical details and practical applications of wavelet transforms were not considered in this article. But you cannot embrace the immensity. Yes, and much is difficult to explain without increasing the degree of matan. I hope that what was written turned out to be useful to someone.
Thanks for attention!
Continuation: Wavelet compression “on fingers”: practice .
Literature
There are many pretty good books that give a deeper understanding of wavelets. I recommend starting with the following:
- Welstead S. Fractals and wavelets for image compression in action. - M .: Triumph, 2003.
- Stark G.-G. The use of wavelets for DSP. - M .: Technosphere, 2007.