New cloud server control panel
- From RSS
News in one paragraph:
- updated control panel;
- fixed disk numbering;
- added a button for sending web interface bugs that can take screenshots of a web page;
- improved graphics;
- Arch linux templates.
Now about everything in more detail:
Interface
The bootstrap is now used as the basis for the interface. Thanks to twitter for this.
All operations (excluding several “dangerous” ones) are performed asynchronously (operations are also asynchronous, only with visual blocking of the panel), that is, they allow you to continue working with virtual machines.
Significantly accelerated the execution of many operations, and the general responsiveness of the interface.
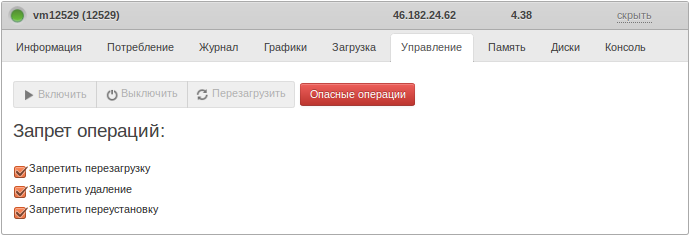
The ban on removing machines was extended to other operations that could lead to downtime:
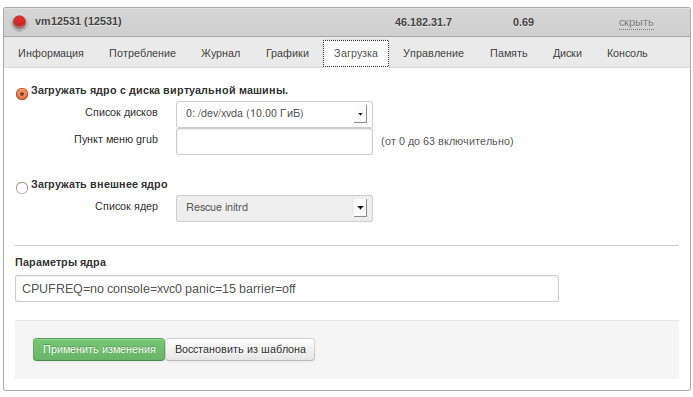
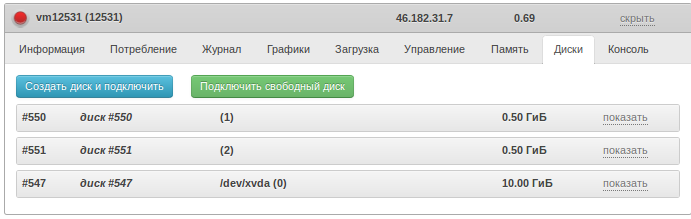
Disk numbering
Finally fixed. Until a certain point, the disk number was set equal to the number of the virtual machine. If there were two disks, or the disk was disconnected and connected to another machine, then ... In short, nothing good. Now everything is simple - each next disk gets the number +1 from the previous one.
Reviews
The “send feedback” button not only allows you to report an error on a web page, but also sends a screenshot of the current state of the browser window (with the ability to select or gloss over some interface elements). This should greatly facilitate the reporting of problems in deeply nested dialogs. (just in case: this button is intended for sending messages about the web interface, the JavaScript programmer is not able to repair virtual machines).
Please note: one block is highlighted in the picture and the other is shaded (which allows you to send a screenshot, covering up private data or other “not for disclose” information.

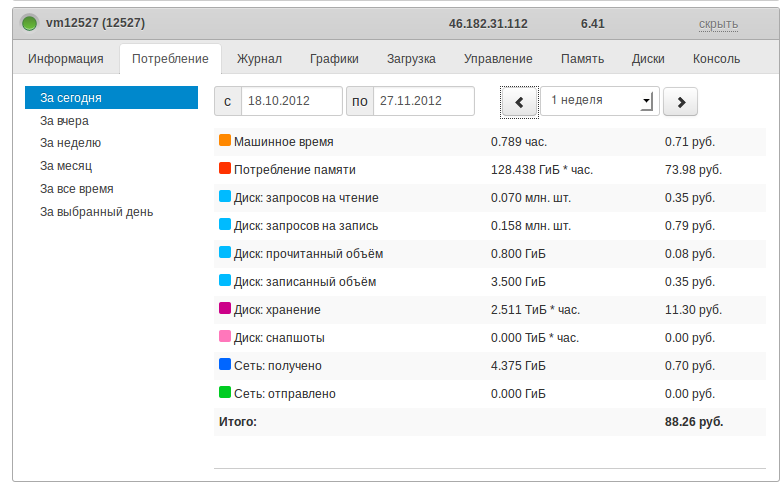
Consumption
Perhaps this can be considered the largest change from a user point of view. Previously, when a disk was disconnected from the machine, when viewing the history of the machine’s consumption in the past, it showed zeros by disk operations and location.
To explain the reasons for this, you need to look at how the accounting of virtual machines is organized:
Each object that makes up a virtual machine is calculated independently. Some (for example, disks) are generally separate services. A virtual machine consists of the following components: VM, VDI (disk), VBD (block device), VIF (network device). Each of these components has several resources, for the use of which a fee is charged as these resources are spent.

Each such component has an owner - it is the owner who pays for the resources used by the component. I must say that the funds are debited upon the fact of using the resources, that is, if the drive is disconnected from the machine, then the funds are still taken for its storage (space).
When a user looks at the general write-off on the account, he sees the amount of write-offs for all the components belonging to him (or belonged to him).
However, when a person opens the “consumption” tab of a virtual machine ”, we are faced with the task: what components relate to the virtual machine? For now (), that is, for the current state of the machine, the task is simple: what is connected, it applies.
And for the car last month, to which the drives were once connected, but now they are not? Until a certain point, we ignored this problem and showed write-offs in the past for the components of which the machine consists of “now”.
Thus, if a disk was disconnected from the machine (VBD was removed), then looking at the machine’s consumption in the past, we saw zeros at this place. Not very obvious, yes.
They decided to change this. Now we look at all the resources ever connected to a virtual machine. This gives reliable numbers in the case of remote drives.
I must say that we did not solve all the problems - if the disk was first connected to one machine, then it was disconnected for a couple of months, and after that it was connected to the second machine, then its consumption (space) will be shown for both machines.
This is only a grouping problem, that is, the total charges on the account do not change, but the display of consumption by car changes.
Well, the last change - we decided to make normal navigation in the past. They adapted the idea from cacti: you can set the interval at what time to watch, you can scroll forward / backward and set the paging step.
Graphs
We have implemented not only summation over remote objects, but also a similar “summation” for graphs, that is, after a drive is disconnected, its statistics are still available. Moreover, since we did the summation, now we have aggregated IO graphs for several disks at once.
Well, at the same time, we realized the opportunity to show several charts at the same time.

Arch linux
We have added support for Arch Linux. Both 32 and 64 bits. I'm not sure if it can be considered a server distribution, and whether the concept of stable applies to it. Use at your own risk.