Evaluate the developer based on objective data.
Unfortunately, we do not live in an ideal world, where every developer has an ideal and balanced level of performance, while focusing on tasks and thinking through them in and out. Team interaction is also not always arranged in such a way that all team members work with maximum efficiency. As with many problems in general, early diagnostics in a development team can save resources, lead nerves and create a good working atmosphere.
In a small team, a team leader may try to judge everything on the basis of subjective feelings, but the larger the company, the more important it is to use objective data and metrics. Alexander Kiselev ( AleksandrKiselev ) and Sergey Semenov in their report on TeamLead Confshowed how to use the data that you have already accumulated, where to get additional data, and that all of them together can help to identify non-obvious problems. And even, having accumulated the experience of many colleagues, they offered solutions.
About speakers: Alexander Kiselev and Sergey Semenov in IT, we have more than 8 years. Both have gone from a developer to a timlid and on to a product manager. They are currently working on the GitLean analytical service, which automatically collects analytics from team development teams and CTOs. The goal of this service is to enable technical managers to make their decisions based on objective data.
Formulation of the problem
We both worked as tmlides and often faced with the problem of uncertainty and ambiguity in our work.
As a result, it was necessary to make decisions quite often blindly, and sometimes it was not clear whether it became better or worse. Therefore, we looked at the existing solutions on the market, examined the methodologies for evaluating developer performance, and realized that there is no service that would satisfy our needs. Therefore, we decided to create it ourselves .
Today we will talk about what you can tell the data that you have already accumulated, but most likely do not use.

This is necessary in two main cases.
Performance review is a rather complicated and subjective process. It would be great to collect facts about the work of the developer automatically.
We talked with representatives of a large German company with a large development staff. About once a year, they stopped all development work at all for 2 weeks, and only did that the whole company conducted a performance review — the developers wrote anonymous denunciations all the day to their colleagues, with whom they had worked for the year. If this company had the opportunity to gather facts automatically, they would save a lot of time for themselves.
The second aspect is monitoring the current situation in the team. I want to quickly understand the problems that arise, and respond promptly to them.
Solutions
There may be several solutions.

First, you can never use any analytics , but only your subjective assessment. This works if you are a team leader in a small team. But if you are already a CTO, and you have a lot of teams, then you will not be able to use your subjective assessment, because you do not know everything. You will have to resort to the subjective assessment of your timlids, and this is a problem, since quite often the tmlids completely differently approach the subjective assessment.

This is the next thing to do. Since the subjective assessment is often not enough, you can get stuck and collect the facts by hand .
For example, one CTO with which we spoke, somehow suspected the team that they were doing a code review too slowly, but there was nothing to show them. Since he had only a vague feeling, he decided to collect the facts, just to watch the team for a couple of weeks. The CTO put the time of the review of the team on the plate, and what he found in the end was just a shock. It turned out that the 2 seigneurs had been in conflict with the code review for quite a long time, and they didn’t take it outside at all. They sat like mice, no one shouted at anyone - the team was not aware of it at all. The only thing they did was periodically going to the cooler, pouring some more water on themselves and running to write witty answers in code review to their enemy in pull-request.
When CTO found out, it turned out that the problem was so old that it was impossible to do anything, and as a result I had to dismiss one of the programmers.
Statistics for Jira - a variant that is often used. This is a very useful tool, in which there is information about the tasks, but it is quite high-level. It is often difficult to understand what is happening in a team specifically.
A simple example - the developer in the previous sprint did 5 tasks, in this - 10. Is it possible to say that he began to work better? It is impossible, because the tasks are completely different.

The last solution, which is - just roll up your sleeves and write your own script for automatic data collection. This is the way that all CTOs more or less come to in large companies. He is the most productive, but, naturally, the most difficult. It is about him we will talk today.
Selected solution
So, the chosen solution is to file your own scripts for analytics collection. The main questions are where to get the data and what to measure.
Data sources
The main data sources in which information about the work of a developer is accumulated are:
Auxiliary data sources:
Since all the sources I have described above are more or less standard, and the latter is not so standard, I’ll tell you a little more about it.
This method is shared with us by another CTO. At the end of each iteration, he automatically sent a survey to the team, in which there were only 2 questions:
This is quite a cheap way to measure the mood in a team and, perhaps, to catch some problems with motivation.
What and how to measure
First of all, let's discuss the measurement methodology. A good metric should answer 3 questions:
In general, it is necessary to follow the principle:
It is worth making a reservation right away that there is no universal metric, and we will not speak about the universal metric today for the following reasons:
New approach
Therefore, we formulated an approach in which we go from problems: we try to identify specific problems and select a set of metrics for them that will detect them. A good developer is a developer with the fewest problems.
What is the basis of our choice of problems? It's simple: we conducted interviews with 37 CTOs and timblids who talked about the problems that they have in the teams, and how they solve these problems.
We prioritized the resulting huge list and collected life hacks and metrics for these problems. All the problems we have divided into 2 groups:
Let us consider in detail each problem, which key from the metrics to it can be selected. Let's start with the simplest problems and slowly move along the gradient of complexity to the most difficult to measure.

Moreover, under the "little performance" usually means that the developer does almost nothing . Conventionally, it hangs a ticket in Jira, he somehow reports on it, but really no work is happening. It is clear that this problem will emerge sooner or later, you will find it, but it would be cool to do it automatically.
How can this be measured?
The first thing that comes to mind is just to look at the number of active days with the developer. We will call the active day the day when the developer made at least one commit. For full-time developers, in fact, the characteristic number of active days per week is not less than 3. If less, then we begin to suspect the developer that he performs little.
Obviously, only the number of active days is not enough. The developer could simply write code and not commit it - he wrote, he wrote, and then one fine day he commited a bunch of code.
Therefore, the following restriction that we impose is that the developer should also have little code . How to determine the threshold "little code"? We recommend putting it small enough so that anyone, at least as much as a performer developer, can easily overcome it. For example, in our service for JS, this is around 150 lines of code, and for Clojure, 100 lines of code.
Why such a small threshold? The idea is that we want to separate non-cool developers from average ones, and those who do almost nothing from those who do at least some sane amount of work.
But even if the developer has few active days and little code, this does not mean that he did not work. He could, for example, make bug fixes that require a small amount of code. As a result, a person seems to have done a lot of tasks, but he may have few code and active days. That is, we take into account the number of tasks .
The next thing to watch out for is the amount of code review that he did, because the person could not do the task and not write the code, but at the same time be completely immersed in the code review. This happens.
Therefore, if for all of these metrics - and only this way! - the developer does not reach any thresholds, then you can suspect him that he performs a little.
What to do with it?
Firstly, if you know the legitimate reason, then you don’t need to do anything at all - for example, the developer is undergoing training or he has a day off. If you do not know the legitimate reason, then you should probably talk to someone. If the legitimate reason does not appear, then it is necessary to monitor it further, and if this problem continues to repeat itself sometimes, then, probably, such a developer should say goodbye.
It was the simplest and most provocative problem. We turn to the more severe.
Developer recycles

This is also a common story. If a person recycles, he burns out, eventually demotivating and, as a result, may leave the company. One of the technical managers with whom we spoke, told the following story. He worked in an American company, in which the culture of rallies was wildly developed. As a result, all the developers, coming to work, did nothing but protest, and they wrote the code during off-hours and on weekends. As a result, the annual turnover of developers in the company reached 30%, although in industry the rate is 6%.
As a result, the entire technical management of 30 people was dismissed from this office. To not bring this up, I want to detect this problem in time.
How can this be measured?
Actually, too, nothing complicated - let's look atthe amount of code that a developer writes during off hours. If this amount of code is conditionally comparable or greater than what it does during working hours, then the developer explicitly recycles.
Obviously, developers are not the only code that lives. The frequent problem is that there is enough time for the code - the main work - and there is no longer a code review. As a result, the code review is transferred to evenings or weekends. This can be tracked simply by the number of comments in a pull-request after hours .
The last explicit trigger is a large number of parallel tasks . There is a reasonable limit of 3-4 tasks for a developer. You can track them on git or on Jira - as you like. It works well.
What to do with it?
If you find a processing developer, you should first check his calendar to see if he is not overloaded with useless meetings. If overloaded, it is desirable to reduce them, and ideally to make a meeting day - a dedicated day, when the developer will concentrate most of his longest meetings, so that on other days he can work normally.
If this does not work, you need to redistribute the load . This is actually quite a difficult question - how to do it. There are many different ways. We will not go deep, but note the steep report on HighLoad 2017 from Anton Potapov, in which this topic was very closely considered.
The developer has no focus on the release of tasks
I want to understand how many such developers are in your team and how much it costs in time.

Quite a common situation that the developer takes the task, brings it to the status of in review, testing - and forgets about it. Then she returns to the revision and hangs there is not clear how much time. I myself had a developer in my team at one time. I underestimated the problem for a long time, until one day I figured out the amount of time that, on average, was spent on various downtime. As a result, it turned out that the tasks of this developer were, on average, 60% idle.
How can this be measured?
First, you need to measure all the downtime that depends on the developer. This is the time to make fixes after the code review and testing . If you have continuous delivery, this waiting time for release. For each of these times it is worthwhile to hang a reasonable restriction - of a type not more than a day.
The reason is as follows. When a developer comes to work in the morning, it would be cool for him to first deal with the highest priority tasks. The highest priority tasks, if there are no bug fixes or something very important, are the tasks that are closest to release and release.
Another cool trigger on this topic is the amount of code review that hangs on the developer, like on a reviewer. If a person forgets about his tasks, then, most likely, he will also relate to the tasks of his colleagues.
What to do with it?
If you find such a developer, clearly it is worthwhile to approach him with the numbers on his hands and say: “Look, it takes you 30–40% of the time for downtime!” Usually it works very well. In my case, for example, it has such an effect that the problem is almost completely gone. If not, we must continue to monitor , periodically speak, but the main thing here is not to fall into the micromanagement because it will be even worse.
Therefore, if possible, you should deal with process decisions immediately, for example, limits on the number of active tasks , or, if your budget and time allows, you can write a bot or use the service that bude automatically ping the developer, if the task is too long in a certain status. This is probably the coolest solution here.
Developer doesn’t think out enough
I think the symptoms you know are incomprehensible estimates of the time to complete tasks that we don’t fall into, extended periods in the end, an increase in the number of bugs in tasks — well, nothing good.

How can this be measured?
I think the symptoms you know are incomprehensible estimates of the time to complete tasks that we don’t fall into, extended periods in the end, an increase in the number of bugs in tasks — well, nothing good.
How can this be measured?
To do this, we need to enter 2 metrics, the first of which is Churn code.

Churn is a measure of how much code a developer conditionally writes in vain.
Imagine the situation. On Monday, the developer began to do a new task, and wrote 100 lines of code. Then came Tuesday, he wrote another 100 new lines of code in this problem. But, unfortunately, it turned out that he removes 50 lines of code that were written on Monday, and releases the task. As a result, 200 lines of code appeared to be created in the task, but only 150 survived to release, and 50 were written in vain. These 50 we call Churn. And so in this example, the developer churn was 25%.
In our opinion, the high level of Churn is a cool trigger that the developer did not think of the task.
There is a study of one American company in which they measured the level of Churn with 20,000 developers and concluded that a good indicator of Churn code should be in the range of 10–20%.
But there are 2 important conditions:

The following metric, which will be needed in order to clarify the fact that the developer does not think out enough tasks, is the so-called Fixed Tasks, or the number of corrected tasks . This is an attempt to measure how many bugs a developer task introduces.
Let's look at what kind of bug fixes the developers are doing, and the code of which tasks these bug fixes change. If the time between the release of the task and the bug fixes is less than 3 weeks, we will assume that this bug was introduced by this task. The more developers have fixed tasks, that is, the more they introduce bugs, the more likely it can be said about him that he is not thinking enough about tasks.
The last trigger is the average number of returns from testing.. If, on average, a developer has more than one return from testing for a task, then, most likely, he has something wrong in terms of thinking through tasks.
What to do with it?
If you find yourself in such a developer, it may be worth it either for him personally or for the whole team to increase the time for planning or change his process. You can enter process improvements, for example, enter limits on the size of the task , the maximum allowable size of the recognition , etc.
One CTO with which we communicated had a rather cool workflow, which we like very much, we advise everyone. If during planning it turns out that the estimate of the task’s implementation time is more than one day, or the task affects more than one component in the system, then a design document is written on it , which is separately reviewed before implementation.
Conditions for using Churn and Fixed Tasks
In order for these metrics to be measured and monitored, you need to:

The first and one of the most frequent stories about which we have heard is the uneven distribution of knowledge of the code base in the team and the fact that in reality you want to see people with relatively low bus numbers. Because it’s bad when there are irreplaceable people who can do work that no one else can do. If such a person knocks down a bus, the development of the entire system may stop for a while.
For example, in my practice there was a case when, due to the dismissal of a senior, an important release was postponed for 3-4 weeks. This is a very long time, and the business is not happy.
How can this be measured?
The idea is very simple - it is necessary to measure in some way, how unique are the knowledge of a particular developer, and how well the developers are generally aware of the work of their neighbors.
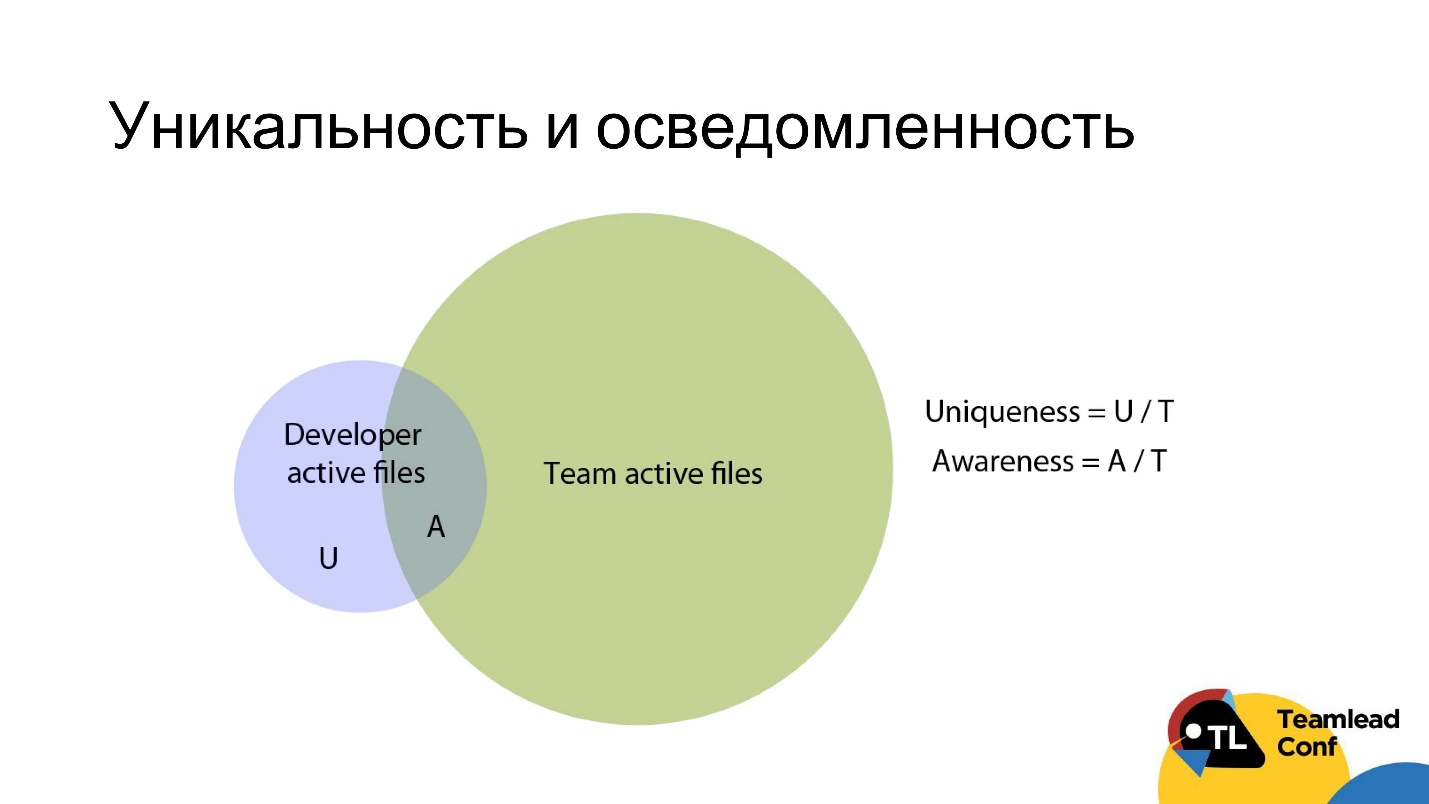
To do this, you can take all the developer files that he has worked with over the past 3 months, and all the team files that several developers have worked on for the same period (the blue and green circle in the diagram, respectively), and cross these two sets.
We will call uniqueness the share of unique developer files that only he knows from all team files. Awareness - on the contrary, the proportion of non-unique files from all command files.
The rule is simple - if you see that you have developers with a high degree of uniqueness or low awareness - somehow, then most likely you have a problem with the uneven distribution of knowledge of the code base.
How to deal with it?
Really pretty easy. You can simply fix the threshold of uniqueness, above which you do not want developers to appear. Timlid or someone else must rotate tasks among developers so that none of them go beyond this threshold.
Choosing a threshold - the question, of course, is not very simple. It all depends on your priorities. The higher the overlap by developers, the lower the team’s speed in the short term, respectively, because they duplicate each other’s competencies. But the lower the risks and the higher the predictability of work in the long term.
We recommend for companies with a staff of 30-50 people a unique threshold in the region of 50-60%. This is quite normal, there is nothing terrible in it.
Another life hack about what can be done with bus numbers, we learned from one company. They simply brought a table where they listed all the components of the system, and the developers, once a quarter, put down in this table how much they are familiar with each component and how much they worked with it for this period. As a result, they get a regularly updated knowledge table for developers .
The second most common problem that we heard about from people is bad food requirements.. Conventionally, the product manager submits to the work tasks that are poorly developed. Then in the middle of the iteration, he resorts, changes them, and as a result, a large amount of team time is simply thrown into the trash.
How can this be measured?
How to catch such a product manager and explain to him how much his solutions are for his team?
Most likely, the product manager had a hand in this problem if we see the team:
What to do with it?
You can come up with the numbers on your hands to the product-manager and say: "Look, our team has Churn's level above the norm by so much - that's how much your constantly changing food requirements stand for us."
Most likely, the figure “how much a team’s share of the emitted code costs” will be much higher than plus 1-2 days to work out product requirements. This figure helped one of our clients very much, and this argument in fact resolved the conflict with the product manager, which lasted several months.

Bad onboarding a new developer is more common for large companies. In different teams, the introduction of new employees occurs with varying degrees of, let's say, efficiency.
The team hired a junior, he was assigned to the seigneur, who was supposed to instruct him and teach him how to be a developer. But instead of doing a deep Junior code review and explaining to him how and what needs to be fixed, the senor simply rewrote the code for him. As a result, the junior did not learn anything, and this did not lead to anything good. This is a prime example of bad onboarding.
How can this be measured?
Most likely there is the problem of bad onboarding if we see that the newcomers to the team:
What to do with it?
First, it is possible and necessary to explain to the team how to introduce new employees, that first a new person should be given small tasks from different parts of the system and bugs , even if not the highest priority.
Secondly, it is necessary to explain to those who will review the junior code that they make a deep enough review and find fault with, perhaps, not even the most significant things.
From our experience - at some point in the team one new developer came to the two timblids, almost simultaneously. One team followed this best practice, tried to rotate tasks for this developer, to carry it around the code, and the second simply gave the tasks that were. As a result, the second developer came to an acceptable level of performance 3 months later than the first, that is, onboarding took more time by 3 months.

The last problem we will talk about today is the accumulation of technical debt.. We all know how bad it is. We constantly dig into the code some crutches at the request of the business, the support of the system is getting worse and worse, and in the end everything can actually go to a complete stop in the development of business tasks. I thought for a long time that this was a horror story from books, until we recently talked to a real CTO, which had so much in the company of technical debt that they stopped the development of their business by almost 100% for a whole quarter. To prevent this, we must somehow track it.
How can this be measured?
To do this, enter one metric called legacy refactoring. This is the percentage of deleting old lines of code, and thereby reducing the complexity of the system. The complexity of the system can be measured in different ways. We recommend just the usual cyclomatic complexity, since there are a lot of libraries that do this, and for almost any language.
If we see that we have a low percentage of legacy refactoring , that is, we pay little attention to simplifying the old code, and we already have a high complexity code, then this is an obvious indicator that technical debt is accumulating.
What to do with it?
You can do different things with it, and you can talk a lot about how to work with it. We like the two stories that the CTO told us. Their approaches make it possible not only to work formally with technical debt, but also very cool to measure its level.
The first CTO simply taught its developers when they cut a crutch into the code, it is mandatory to start a ticket with the type of “crutch” in Jira . As a result, he always has in the tracker a relatively up-to-date list of all crutches in the system, with some kind of estimation and with a priority level. He constantly watches them, setting the standard level - how many such tickets can he have, etc.
The second CTO went even further and used a more elegant approach. When developers crush a crutch into the system, they are required to insert a comment with the “Hack” type into the code where they do it . If another developer has detected some suspicious code on the code review, he said: “Put the word Hack here - then fix it,” for example. As a result, he monitors the level of technical debt with a trivial grep in the repository for the word “Hack” and always gets the current list and dynamics of how many such flaws he currently has in the system.
Actually with metrics that's all. We tried to tell about the simplest and most understandable to measure.
Our approach has pitfalls:
We wanted to convey to you the following:
Useful links and contacts:
In a small team, a team leader may try to judge everything on the basis of subjective feelings, but the larger the company, the more important it is to use objective data and metrics. Alexander Kiselev ( AleksandrKiselev ) and Sergey Semenov in their report on TeamLead Confshowed how to use the data that you have already accumulated, where to get additional data, and that all of them together can help to identify non-obvious problems. And even, having accumulated the experience of many colleagues, they offered solutions.
About speakers: Alexander Kiselev and Sergey Semenov in IT, we have more than 8 years. Both have gone from a developer to a timlid and on to a product manager. They are currently working on the GitLean analytical service, which automatically collects analytics from team development teams and CTOs. The goal of this service is to enable technical managers to make their decisions based on objective data.
Formulation of the problem
We both worked as tmlides and often faced with the problem of uncertainty and ambiguity in our work.
As a result, it was necessary to make decisions quite often blindly, and sometimes it was not clear whether it became better or worse. Therefore, we looked at the existing solutions on the market, examined the methodologies for evaluating developer performance, and realized that there is no service that would satisfy our needs. Therefore, we decided to create it ourselves .
Today we will talk about what you can tell the data that you have already accumulated, but most likely do not use.
This is necessary in two main cases.
Performance review is a rather complicated and subjective process. It would be great to collect facts about the work of the developer automatically.
We talked with representatives of a large German company with a large development staff. About once a year, they stopped all development work at all for 2 weeks, and only did that the whole company conducted a performance review — the developers wrote anonymous denunciations all the day to their colleagues, with whom they had worked for the year. If this company had the opportunity to gather facts automatically, they would save a lot of time for themselves.
The second aspect is monitoring the current situation in the team. I want to quickly understand the problems that arise, and respond promptly to them.
Solutions
There may be several solutions.
First, you can never use any analytics , but only your subjective assessment. This works if you are a team leader in a small team. But if you are already a CTO, and you have a lot of teams, then you will not be able to use your subjective assessment, because you do not know everything. You will have to resort to the subjective assessment of your timlids, and this is a problem, since quite often the tmlids completely differently approach the subjective assessment.
This is the next thing to do. Since the subjective assessment is often not enough, you can get stuck and collect the facts by hand .
For example, one CTO with which we spoke, somehow suspected the team that they were doing a code review too slowly, but there was nothing to show them. Since he had only a vague feeling, he decided to collect the facts, just to watch the team for a couple of weeks. The CTO put the time of the review of the team on the plate, and what he found in the end was just a shock. It turned out that the 2 seigneurs had been in conflict with the code review for quite a long time, and they didn’t take it outside at all. They sat like mice, no one shouted at anyone - the team was not aware of it at all. The only thing they did was periodically going to the cooler, pouring some more water on themselves and running to write witty answers in code review to their enemy in pull-request.
When CTO found out, it turned out that the problem was so old that it was impossible to do anything, and as a result I had to dismiss one of the programmers.
Statistics for Jira - a variant that is often used. This is a very useful tool, in which there is information about the tasks, but it is quite high-level. It is often difficult to understand what is happening in a team specifically.
A simple example - the developer in the previous sprint did 5 tasks, in this - 10. Is it possible to say that he began to work better? It is impossible, because the tasks are completely different.
The last solution, which is - just roll up your sleeves and write your own script for automatic data collection. This is the way that all CTOs more or less come to in large companies. He is the most productive, but, naturally, the most difficult. It is about him we will talk today.
Selected solution
So, the chosen solution is to file your own scripts for analytics collection. The main questions are where to get the data and what to measure.
Data sources
The main data sources in which information about the work of a developer is accumulated are:
- Git - the main entities: commits, branches and code inside them.
- Code Review Tools - Git hosting services that run code review store pull-request information that can be used.
- Task trackers - information about tasks and their life cycle.
Auxiliary data sources:
- Messengers - there you can, for example, carry out sentiment analysis, consider the average developer response time to a request for information.
- CI services that store information about builds and releases.
- Team polls.
Since all the sources I have described above are more or less standard, and the latter is not so standard, I’ll tell you a little more about it.
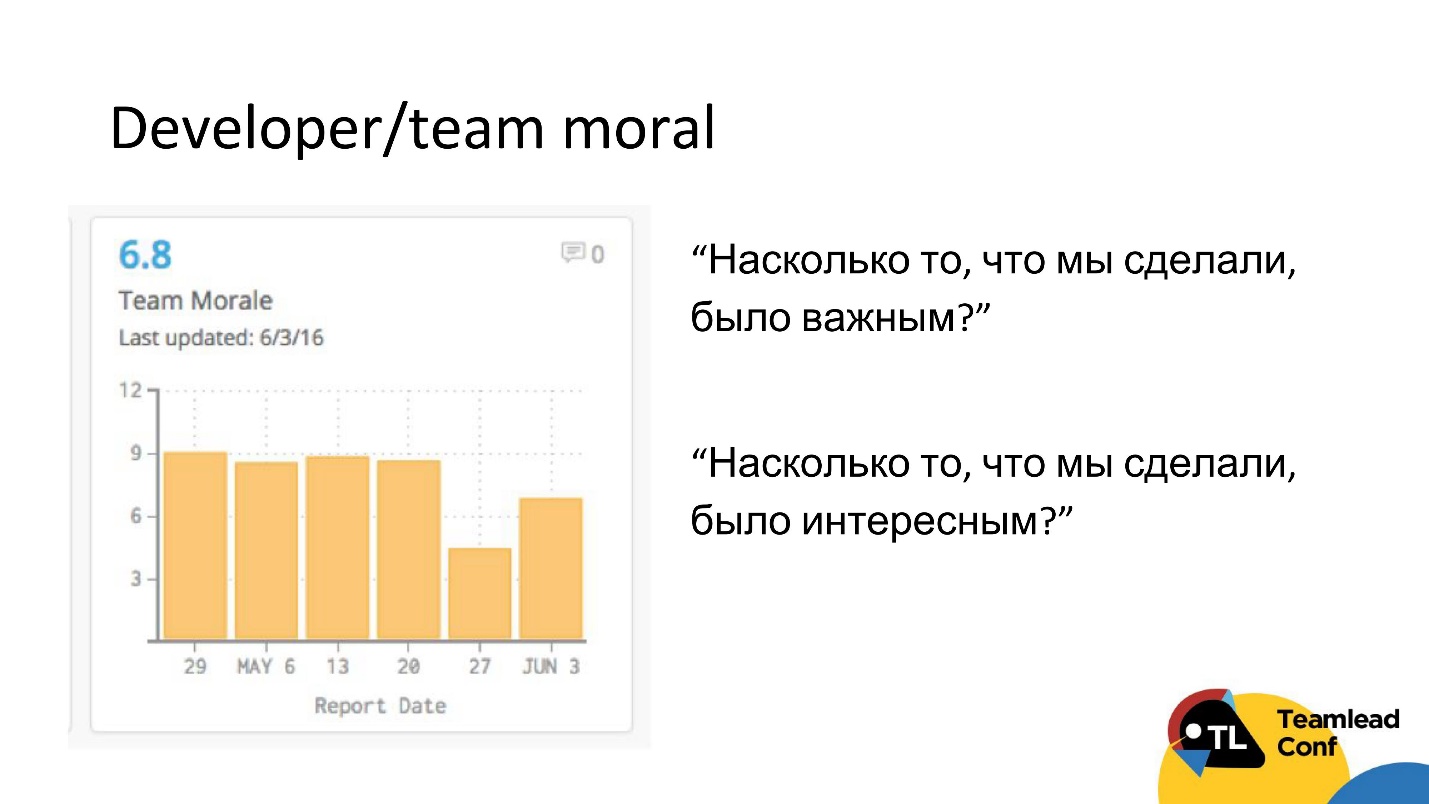
This method is shared with us by another CTO. At the end of each iteration, he automatically sent a survey to the team, in which there were only 2 questions:
- How do you think that what we did in this iteration was important?
- Do you think that what we are doing was interesting?
This is quite a cheap way to measure the mood in a team and, perhaps, to catch some problems with motivation.
What and how to measure
First of all, let's discuss the measurement methodology. A good metric should answer 3 questions:
- Is this important? You need to measure only what signals something significant for the company.
- It became worse / better / the same? By metric it should be crystal clear whether it has become better or worse.
- What to do? From the metric it should be clear what to do in order to correct the situation.
In general, it is necessary to follow the principle:
Measure what you want and can change.
It is worth making a reservation right away that there is no universal metric, and we will not speak about the universal metric today for the following reasons:
- A developer has many aspects of activity - he works with requirements, writes code, tests, runs code review, makes it warm - and it’s impossible to stuff all this into a single universal metric. Therefore, it is better to focus on individual cases that can be detected.
- The second reason why the only metric should not be done is to easily get around one metric, because the developers are smart enough people, and they will figure out how to do it alone.
New approach
Therefore, we formulated an approach in which we go from problems: we try to identify specific problems and select a set of metrics for them that will detect them. A good developer is a developer with the fewest problems.
What is the basis of our choice of problems? It's simple: we conducted interviews with 37 CTOs and timblids who talked about the problems that they have in the teams, and how they solve these problems.
We prioritized the resulting huge list and collected life hacks and metrics for these problems. All the problems we have divided into 2 groups:
- Problems of an individual developer (the developer is responsible for these problems).
- Team problems. The team is responsible for these problems, respectively, in order to solve them, you need to work as a whole with the team and change process decisions.
Let us consider in detail each problem, which key from the metrics to it can be selected. Let's start with the simplest problems and slowly move along the gradient of complexity to the most difficult to measure.
Developer Issues
The developer performs a little
Moreover, under the "little performance" usually means that the developer does almost nothing . Conventionally, it hangs a ticket in Jira, he somehow reports on it, but really no work is happening. It is clear that this problem will emerge sooner or later, you will find it, but it would be cool to do it automatically.
How can this be measured?
The first thing that comes to mind is just to look at the number of active days with the developer. We will call the active day the day when the developer made at least one commit. For full-time developers, in fact, the characteristic number of active days per week is not less than 3. If less, then we begin to suspect the developer that he performs little.
Obviously, only the number of active days is not enough. The developer could simply write code and not commit it - he wrote, he wrote, and then one fine day he commited a bunch of code.
Therefore, the following restriction that we impose is that the developer should also have little code . How to determine the threshold "little code"? We recommend putting it small enough so that anyone, at least as much as a performer developer, can easily overcome it. For example, in our service for JS, this is around 150 lines of code, and for Clojure, 100 lines of code.
Why such a small threshold? The idea is that we want to separate non-cool developers from average ones, and those who do almost nothing from those who do at least some sane amount of work.
But even if the developer has few active days and little code, this does not mean that he did not work. He could, for example, make bug fixes that require a small amount of code. As a result, a person seems to have done a lot of tasks, but he may have few code and active days. That is, we take into account the number of tasks .
The next thing to watch out for is the amount of code review that he did, because the person could not do the task and not write the code, but at the same time be completely immersed in the code review. This happens.
Therefore, if for all of these metrics - and only this way! - the developer does not reach any thresholds, then you can suspect him that he performs a little.
What to do with it?
Firstly, if you know the legitimate reason, then you don’t need to do anything at all - for example, the developer is undergoing training or he has a day off. If you do not know the legitimate reason, then you should probably talk to someone. If the legitimate reason does not appear, then it is necessary to monitor it further, and if this problem continues to repeat itself sometimes, then, probably, such a developer should say goodbye.
It was the simplest and most provocative problem. We turn to the more severe.
Developer recycles
This is also a common story. If a person recycles, he burns out, eventually demotivating and, as a result, may leave the company. One of the technical managers with whom we spoke, told the following story. He worked in an American company, in which the culture of rallies was wildly developed. As a result, all the developers, coming to work, did nothing but protest, and they wrote the code during off-hours and on weekends. As a result, the annual turnover of developers in the company reached 30%, although in industry the rate is 6%.
As a result, the entire technical management of 30 people was dismissed from this office. To not bring this up, I want to detect this problem in time.
How can this be measured?
Actually, too, nothing complicated - let's look atthe amount of code that a developer writes during off hours. If this amount of code is conditionally comparable or greater than what it does during working hours, then the developer explicitly recycles.
Obviously, developers are not the only code that lives. The frequent problem is that there is enough time for the code - the main work - and there is no longer a code review. As a result, the code review is transferred to evenings or weekends. This can be tracked simply by the number of comments in a pull-request after hours .
The last explicit trigger is a large number of parallel tasks . There is a reasonable limit of 3-4 tasks for a developer. You can track them on git or on Jira - as you like. It works well.
What to do with it?
If you find a processing developer, you should first check his calendar to see if he is not overloaded with useless meetings. If overloaded, it is desirable to reduce them, and ideally to make a meeting day - a dedicated day, when the developer will concentrate most of his longest meetings, so that on other days he can work normally.
If this does not work, you need to redistribute the load . This is actually quite a difficult question - how to do it. There are many different ways. We will not go deep, but note the steep report on HighLoad 2017 from Anton Potapov, in which this topic was very closely considered.
The developer has no focus on the release of tasks
I want to understand how many such developers are in your team and how much it costs in time.
Quite a common situation that the developer takes the task, brings it to the status of in review, testing - and forgets about it. Then she returns to the revision and hangs there is not clear how much time. I myself had a developer in my team at one time. I underestimated the problem for a long time, until one day I figured out the amount of time that, on average, was spent on various downtime. As a result, it turned out that the tasks of this developer were, on average, 60% idle.
How can this be measured?
First, you need to measure all the downtime that depends on the developer. This is the time to make fixes after the code review and testing . If you have continuous delivery, this waiting time for release. For each of these times it is worthwhile to hang a reasonable restriction - of a type not more than a day.
The reason is as follows. When a developer comes to work in the morning, it would be cool for him to first deal with the highest priority tasks. The highest priority tasks, if there are no bug fixes or something very important, are the tasks that are closest to release and release.
Another cool trigger on this topic is the amount of code review that hangs on the developer, like on a reviewer. If a person forgets about his tasks, then, most likely, he will also relate to the tasks of his colleagues.
What to do with it?
If you find such a developer, clearly it is worthwhile to approach him with the numbers on his hands and say: “Look, it takes you 30–40% of the time for downtime!” Usually it works very well. In my case, for example, it has such an effect that the problem is almost completely gone. If not, we must continue to monitor , periodically speak, but the main thing here is not to fall into the micromanagement because it will be even worse.
Therefore, if possible, you should deal with process decisions immediately, for example, limits on the number of active tasks , or, if your budget and time allows, you can write a bot or use the service that bude automatically ping the developer, if the task is too long in a certain status. This is probably the coolest solution here.
Developer doesn’t think out enough
I think the symptoms you know are incomprehensible estimates of the time to complete tasks that we don’t fall into, extended periods in the end, an increase in the number of bugs in tasks — well, nothing good.
How can this be measured?
I think the symptoms you know are incomprehensible estimates of the time to complete tasks that we don’t fall into, extended periods in the end, an increase in the number of bugs in tasks — well, nothing good.
How can this be measured?
To do this, we need to enter 2 metrics, the first of which is Churn code.
Churn is a measure of how much code a developer conditionally writes in vain.
Imagine the situation. On Monday, the developer began to do a new task, and wrote 100 lines of code. Then came Tuesday, he wrote another 100 new lines of code in this problem. But, unfortunately, it turned out that he removes 50 lines of code that were written on Monday, and releases the task. As a result, 200 lines of code appeared to be created in the task, but only 150 survived to release, and 50 were written in vain. These 50 we call Churn. And so in this example, the developer churn was 25%.
In our opinion, the high level of Churn is a cool trigger that the developer did not think of the task.
There is a study of one American company in which they measured the level of Churn with 20,000 developers and concluded that a good indicator of Churn code should be in the range of 10–20%.
But there are 2 important conditions:
- High Churn is normal if you, for example, make a prototype or some new project. Then it can be equal to 50-60% for several months. There is nothing wrong with that. Roughly speaking, Churn depends on the stage of the product - the more stable the product, the lower it should be.
- In no case should not strive for a zero level Churn - this is absolutely meaningless perfectionism. No need to force developers to write a perfect code from scratch. They will spend a lot of time thinking through or trying to somehow hack this story. As a result, the delivery time will only increase.
The following metric, which will be needed in order to clarify the fact that the developer does not think out enough tasks, is the so-called Fixed Tasks, or the number of corrected tasks . This is an attempt to measure how many bugs a developer task introduces.
Let's look at what kind of bug fixes the developers are doing, and the code of which tasks these bug fixes change. If the time between the release of the task and the bug fixes is less than 3 weeks, we will assume that this bug was introduced by this task. The more developers have fixed tasks, that is, the more they introduce bugs, the more likely it can be said about him that he is not thinking enough about tasks.
The last trigger is the average number of returns from testing.. If, on average, a developer has more than one return from testing for a task, then, most likely, he has something wrong in terms of thinking through tasks.
What to do with it?
If you find yourself in such a developer, it may be worth it either for him personally or for the whole team to increase the time for planning or change his process. You can enter process improvements, for example, enter limits on the size of the task , the maximum allowable size of the recognition , etc.
One CTO with which we communicated had a rather cool workflow, which we like very much, we advise everyone. If during planning it turns out that the estimate of the task’s implementation time is more than one day, or the task affects more than one component in the system, then a design document is written on it , which is separately reviewed before implementation.
Conditions for using Churn and Fixed Tasks
In order for these metrics to be measured and monitored, you need to:
- Specify the number of task in the commit message, without this you can not measure them. And it is in the commit message, and not in the branch, because git does not store the history of branches.
- Do not make git-squash commit'ov tasks in one, because then Churn will be a priori equal to zero.
- It should be possible to determine the release on git. That is, releases can be counted in merge in master, or merge in a specific branch, or at worst tag. But the opportunity to determine should be - otherwise we can not understand when the task is over, and when to count Churn and Fixed Tasks.
Team problems
The first and one of the most frequent stories about which we have heard is the uneven distribution of knowledge of the code base in the team and the fact that in reality you want to see people with relatively low bus numbers. Because it’s bad when there are irreplaceable people who can do work that no one else can do. If such a person knocks down a bus, the development of the entire system may stop for a while.
For example, in my practice there was a case when, due to the dismissal of a senior, an important release was postponed for 3-4 weeks. This is a very long time, and the business is not happy.
How can this be measured?
The idea is very simple - it is necessary to measure in some way, how unique are the knowledge of a particular developer, and how well the developers are generally aware of the work of their neighbors.
To do this, you can take all the developer files that he has worked with over the past 3 months, and all the team files that several developers have worked on for the same period (the blue and green circle in the diagram, respectively), and cross these two sets.
We will call uniqueness the share of unique developer files that only he knows from all team files. Awareness - on the contrary, the proportion of non-unique files from all command files.
The rule is simple - if you see that you have developers with a high degree of uniqueness or low awareness - somehow, then most likely you have a problem with the uneven distribution of knowledge of the code base.
How to deal with it?
Really pretty easy. You can simply fix the threshold of uniqueness, above which you do not want developers to appear. Timlid or someone else must rotate tasks among developers so that none of them go beyond this threshold.
Choosing a threshold - the question, of course, is not very simple. It all depends on your priorities. The higher the overlap by developers, the lower the team’s speed in the short term, respectively, because they duplicate each other’s competencies. But the lower the risks and the higher the predictability of work in the long term.
We recommend for companies with a staff of 30-50 people a unique threshold in the region of 50-60%. This is quite normal, there is nothing terrible in it.
Another life hack about what can be done with bus numbers, we learned from one company. They simply brought a table where they listed all the components of the system, and the developers, once a quarter, put down in this table how much they are familiar with each component and how much they worked with it for this period. As a result, they get a regularly updated knowledge table for developers .
The second most common problem that we heard about from people is bad food requirements.. Conventionally, the product manager submits to the work tasks that are poorly developed. Then in the middle of the iteration, he resorts, changes them, and as a result, a large amount of team time is simply thrown into the trash.
How can this be measured?
How to catch such a product manager and explain to him how much his solutions are for his team?
Most likely, the product manager had a hand in this problem if we see the team:
- a high level of Churn, that is, in total for the whole team a high percentage of the code being emitted;
- on average, large tasks, both in terms of the amount of code, and simply by estimation;
- Task descriptions change after getting into status in progress or there are many comments to tasks from a product manager.
What to do with it?
You can come up with the numbers on your hands to the product-manager and say: "Look, our team has Churn's level above the norm by so much - that's how much your constantly changing food requirements stand for us."
Most likely, the figure “how much a team’s share of the emitted code costs” will be much higher than plus 1-2 days to work out product requirements. This figure helped one of our clients very much, and this argument in fact resolved the conflict with the product manager, which lasted several months.
Bad onboarding a new developer is more common for large companies. In different teams, the introduction of new employees occurs with varying degrees of, let's say, efficiency.
The team hired a junior, he was assigned to the seigneur, who was supposed to instruct him and teach him how to be a developer. But instead of doing a deep Junior code review and explaining to him how and what needs to be fixed, the senor simply rewrote the code for him. As a result, the junior did not learn anything, and this did not lead to anything good. This is a prime example of bad onboarding.
How can this be measured?
Most likely there is the problem of bad onboarding if we see that the newcomers to the team:
- small amount of code;
- a small number of unique files and slowly growing;
- low percentage of editing old code;
- superficial code review, that is, there are few comments and the time for code review is on average less than that of the team;
- big task.
What to do with it?
First, it is possible and necessary to explain to the team how to introduce new employees, that first a new person should be given small tasks from different parts of the system and bugs , even if not the highest priority.
Secondly, it is necessary to explain to those who will review the junior code that they make a deep enough review and find fault with, perhaps, not even the most significant things.
From our experience - at some point in the team one new developer came to the two timblids, almost simultaneously. One team followed this best practice, tried to rotate tasks for this developer, to carry it around the code, and the second simply gave the tasks that were. As a result, the second developer came to an acceptable level of performance 3 months later than the first, that is, onboarding took more time by 3 months.
The last problem we will talk about today is the accumulation of technical debt.. We all know how bad it is. We constantly dig into the code some crutches at the request of the business, the support of the system is getting worse and worse, and in the end everything can actually go to a complete stop in the development of business tasks. I thought for a long time that this was a horror story from books, until we recently talked to a real CTO, which had so much in the company of technical debt that they stopped the development of their business by almost 100% for a whole quarter. To prevent this, we must somehow track it.
How can this be measured?
To do this, enter one metric called legacy refactoring. This is the percentage of deleting old lines of code, and thereby reducing the complexity of the system. The complexity of the system can be measured in different ways. We recommend just the usual cyclomatic complexity, since there are a lot of libraries that do this, and for almost any language.
If we see that we have a low percentage of legacy refactoring , that is, we pay little attention to simplifying the old code, and we already have a high complexity code, then this is an obvious indicator that technical debt is accumulating.
What to do with it?
You can do different things with it, and you can talk a lot about how to work with it. We like the two stories that the CTO told us. Their approaches make it possible not only to work formally with technical debt, but also very cool to measure its level.
The first CTO simply taught its developers when they cut a crutch into the code, it is mandatory to start a ticket with the type of “crutch” in Jira . As a result, he always has in the tracker a relatively up-to-date list of all crutches in the system, with some kind of estimation and with a priority level. He constantly watches them, setting the standard level - how many such tickets can he have, etc.
The second CTO went even further and used a more elegant approach. When developers crush a crutch into the system, they are required to insert a comment with the “Hack” type into the code where they do it . If another developer has detected some suspicious code on the code review, he said: “Put the word Hack here - then fix it,” for example. As a result, he monitors the level of technical debt with a trivial grep in the repository for the word “Hack” and always gets the current list and dynamics of how many such flaws he currently has in the system.
Actually with metrics that's all. We tried to tell about the simplest and most understandable to measure.
Underwater rocks
Our approach has pitfalls:
- Some things are still not very easy to measure. This applies, for example, Churn or legacy refactoring. It takes some time to invest to learn how to count them.
- Data needs to be cleared and a little adjust to the command. For example, a trivial thing that you come across if you try to implement it - in git you will see that several git accounts correspond to the same person. You will have to consider both of them - this is a trivial example of data cleansing that needs to be done.
- You need to keep track of thresholds and choose them wisely, because they depend on the stage of the company's life and on the type of company too. What is good for an outsourcer may not be very good for a grocery company.
- Most of the metrics we have listed here work only for full-time developers, because only the activities of full-time developers are well reflected in the available data sources: git, Jira, GitHub, messengers, etc.
findings
We wanted to convey to you the following:
- Developers and the team can and should be measured . It can be difficult, but it can be done.
- There is no universal small KPI set . For each problem, you need to select your own highly specialized set of metrics. We must remember that we should not neglect even the most simple metrics. Together they can work well.
- Git can tell a lot of interesting things about development and developers, but you need to follow certain practices so that you can easily get data from it, including:
- task number in commits;
- no squashes;
- You can determine the release time: merge in master, tags.
Useful links and contacts:
- In the presentation of the speech there are several bonus problems and metrics for them.
- Authors blog with helpful articles for development managers
- Telegram contacts: @avkiselev (Alexander Kiselev) and sss0791 (Sergey Semenov).
On TeamLead Conf discuss many different issues of management development team and are looking for their solutions. If you have already passed a part of the way, filled one lump, stepping on a rake, tried different approaches and are ready to draw conclusions and share your experience - we are waiting for you. You can apply for a speech until 10 August .
Participants are also expected to be more involved, start by booking a ticket , and then try to formulate what excites you the most - then you can discuss your pain and get the most from the conference.