About exploratory testing in Microsoft Test Manager 2012
There was an article about research testing a couple of days ago , and I would like to continue the topic with a description of one of the tools that support the process of such testing.
What, in fact, do we expect from such a tool if in research testing we have neither a scenario, nor a plan, nor clear criteria for assessing the correctness of the system’s behavior?
In my opinion, such a tool should:
Actually, the best option in this sense would be the availability of research testing support in an integrated tool for managing requirements, tests and defects. One of these tools - Microsoft Test Manager 2012 - I want to talk about.
In the 2012 version of MTM, support for research testing appeared. I see the following ways of applying this functionality:
For demonstration, I will use a ready-made, downloadable virtual machine . There are more detailed instructions and use cases.
Launch MTM, select a project and open a test plan. A project may have several test plans, so requirements, test scripts, defects, etc. stored in a common TFS repository, and a test plan allows you to organize work with some of them.
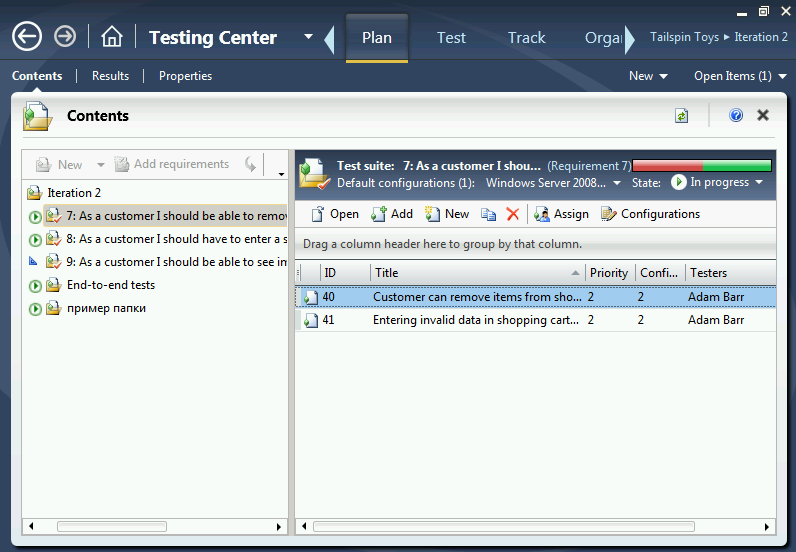
Our test plan may be completely empty, but we will consider the scenario when we have several requirements and we added them to the plan (the “Add requirements” button is active when the root folder or subfolder, Suite) is selected. When we add a requirement to the plan, a folder is created for it, into which all test scenarios associated with the requirement are automatically added. Here we can add other scripts (“Add” button) or create new ones (“New” button). Hereinafter I use the term “Requirement”, although its specific implementation in TFS may differ depending on the selected template. It will be “User Story” for Agile, “BacklogItem” for SCRUM, “Requirement” or some other type from the requirements category for different templates.
Let's move on to research tests. To do this, switch to the “Test” tab and then open the “Do Exploratory Testing” item.
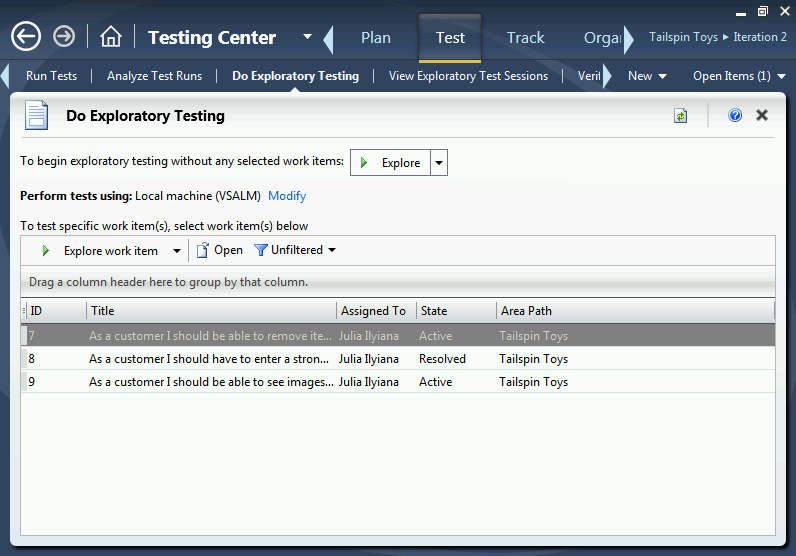
Here we have two key opportunities - to launch a research testing session (“Explore”) and start a research testing session for a selected requirement from the list included in the current plan (“Explore work item”).
The difference between these two options is quite simple: if we select the test requirement, then the artifacts created later (test results, defects, test scripts) will automatically be attached to this requirement.
Choose the option “Explore work item”. The test snap-in window opens. This tool will allow us to collect information on the progress of research testing. When we are ready, press the “Start” button, our tool is activated.
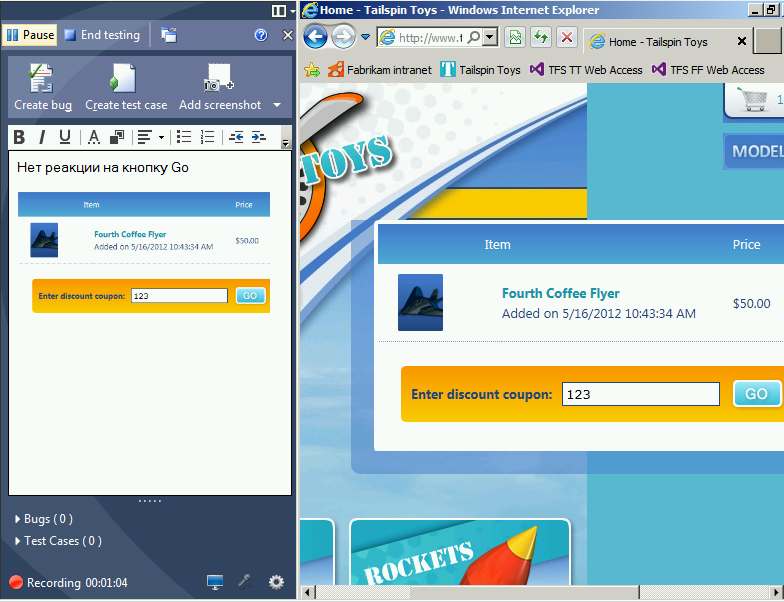
The right side of the desktop remains free to work with the tested Web or Desktop application, and in our snap-in we can leave comments during testing, add screenshots, and control the course of recording actions. During the testing process, the following can also be recorded:
- video of what is happening on the screen
- voice comments
- actions (actions) performed in the user interface
- debug information Intellitrace
- other data collected by Diagnostics Adapters (see below for setting them up)
So, we have a Web application and we are testing its behavior.
The user opened the site, selected the product, added it to the basket, entered the promo code, pressed the Go miracle button and nothing happened. It seems to me that this is a defect, so I write in the comments “There is no reaction to the Go button” and attach a screenshot (“Add screenshot”).
At first glance, uninformative. Unfortunately, this is how testers often document defects. When they begin to write a normal description, they are renamed to Quality Specialists (QA Engineer).
However, let's see what modern tools can do.
Using the “Create Bug” button, we will create a new error report:
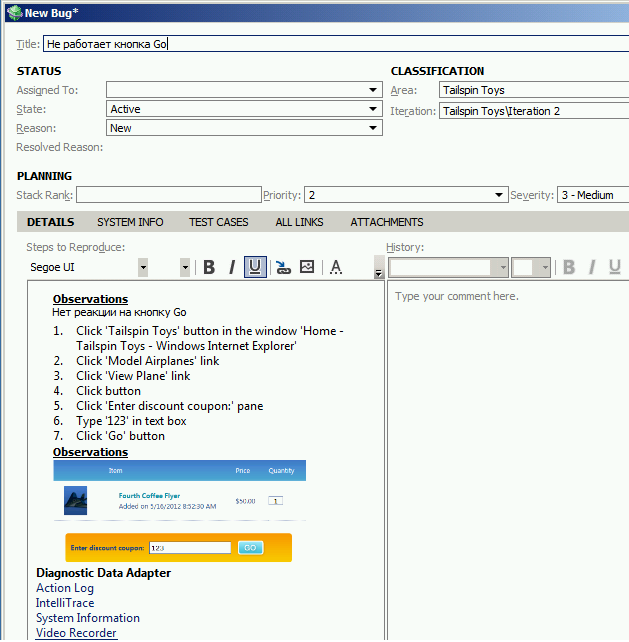
And here we understand why MTM is needed in research testing:
The defect is almost completely documented:
- the sequence of actions is automatically recorded (steps 1-7)
- the defect description is generated from the comments entered and screenshots
- the collected system information
is attached - the Intellitrace log
is attached - the video of what was happening on the screen is attached
Now the quality specialist does not need to remember what he did in order to get the error. All moves are recorded. It will be very easy for the developer to reproduce the sequence of steps and it is very difficult to reject the error with the words "but everything works for me", looking at the video.
One of the testing practices says that before correcting a found error, you should create a test that checks for the presence of this error.
The “Create test case” function allows you to automatically create a test script based on information about the actions taken.
The actions that were performed during the session are added as test steps. It remains, if necessary, to correct their description and add information about the expected result in the “Expected Result” column.
As a result, we can not only conduct research testing and document errors, but also use this tool to quickly describe test scenarios .
And if at the time of the start of the testing session we selected the requirement, then the errors found and the testing scenario will be tied to the requirement. However, such relationships can always be added manually.
Research test session information may be retained even if no defects were found.
You can view them on the View Exploratory Test Sessions tab.
You can open a detailed description of the session and view the collected data
. The same data (Test Result) is collected by the system during other types of tests.
Briefly look at the settings for the information collected during testing.
In MTM, we can create and use several test configurations, including not only local profiles, but also profiles for complex test environments that include several machines, which allows, for example, collecting logs of events both on application servers, on the client workstation, and on other machines included in the test environment.
To configure, we switch from the Testing Center mode to the Lab Center and open the Test Settings tab.
We select one of the configurations and see its settings for one of the roles of machines included in the test environments:
Several basic data acquisition adapters are available:
The last paragraph requires clarification. The system really recognizes which buttons were clicked, which links are open, which fields are filled, etc. Moreover, this mechanism is used in several places: in the tools for describing automatic tests of the user interface (Coded UI Test), in the system of partial automation of manual tests, as well as during research testing.
Supported applications are Windows Forms 2.0, Win32, WPF, Silverlight, Web and HTML5 through IE8-10 and some others.
There are unsupported technologies - Flash / JAVA, SAP, Lotus Notes. A number of technologies are supported through additional extensions.
Research testing is one type of testing. And it should be used as an addition to existing unit testing procedures, automatic, functional, ergonomic, load testing, security testing, etc.
The tools used should provide a unified environment for running tests, storing results and ensure connectivity with all project entities - requirements, defects and test scripts.
What, in fact, do we expect from such a tool if in research testing we have neither a scenario, nor a plan, nor clear criteria for assessing the correctness of the system’s behavior?
Tool Requirements
In my opinion, such a tool should:
- Integrate with a bug tracking system so that defects can be triggered as they are detected
- Automatically document a detected defect. This is important when the test runs not according to the script, but in an arbitrary sequence that cannot be kept in mind.
- Provide the ability to repeat the research test sequence
- To be integrated with the requirements management system - in order to link the detected defects to the requirements as far as possible
- Be integrated with the test management system to:
- conduct all types of testing in a single environment
- create new test scenarios based on research tests
Actually, the best option in this sense would be the availability of research testing support in an integrated tool for managing requirements, tests and defects. One of these tools - Microsoft Test Manager 2012 - I want to talk about.
In the 2012 version of MTM, support for research testing appeared. I see the following ways of applying this functionality:
- Conducting exploratory testing in addition to scenario tests
- Testing in the absence of test scripts
- Quickly create new test scripts through exploratory testing sessions
For demonstration, I will use a ready-made, downloadable virtual machine . There are more detailed instructions and use cases.
Test plan
Launch MTM, select a project and open a test plan. A project may have several test plans, so requirements, test scripts, defects, etc. stored in a common TFS repository, and a test plan allows you to organize work with some of them.
Our test plan may be completely empty, but we will consider the scenario when we have several requirements and we added them to the plan (the “Add requirements” button is active when the root folder or subfolder, Suite) is selected. When we add a requirement to the plan, a folder is created for it, into which all test scenarios associated with the requirement are automatically added. Here we can add other scripts (“Add” button) or create new ones (“New” button). Hereinafter I use the term “Requirement”, although its specific implementation in TFS may differ depending on the selected template. It will be “User Story” for Agile, “BacklogItem” for SCRUM, “Requirement” or some other type from the requirements category for different templates.
Research Testing Session
Let's move on to research tests. To do this, switch to the “Test” tab and then open the “Do Exploratory Testing” item.
Here we have two key opportunities - to launch a research testing session (“Explore”) and start a research testing session for a selected requirement from the list included in the current plan (“Explore work item”).
The difference between these two options is quite simple: if we select the test requirement, then the artifacts created later (test results, defects, test scripts) will automatically be attached to this requirement.
Choose the option “Explore work item”. The test snap-in window opens. This tool will allow us to collect information on the progress of research testing. When we are ready, press the “Start” button, our tool is activated.
The right side of the desktop remains free to work with the tested Web or Desktop application, and in our snap-in we can leave comments during testing, add screenshots, and control the course of recording actions. During the testing process, the following can also be recorded:
- video of what is happening on the screen
- voice comments
- actions (actions) performed in the user interface
- debug information Intellitrace
- other data collected by Diagnostics Adapters (see below for setting them up)
So, we have a Web application and we are testing its behavior.
The user opened the site, selected the product, added it to the basket, entered the promo code, pressed the Go miracle button and nothing happened. It seems to me that this is a defect, so I write in the comments “There is no reaction to the Go button” and attach a screenshot (“Add screenshot”).
At first glance, uninformative. Unfortunately, this is how testers often document defects. When they begin to write a normal description, they are renamed to Quality Specialists (QA Engineer).
However, let's see what modern tools can do.
Generate an error report.
Using the “Create Bug” button, we will create a new error report:
And here we understand why MTM is needed in research testing:
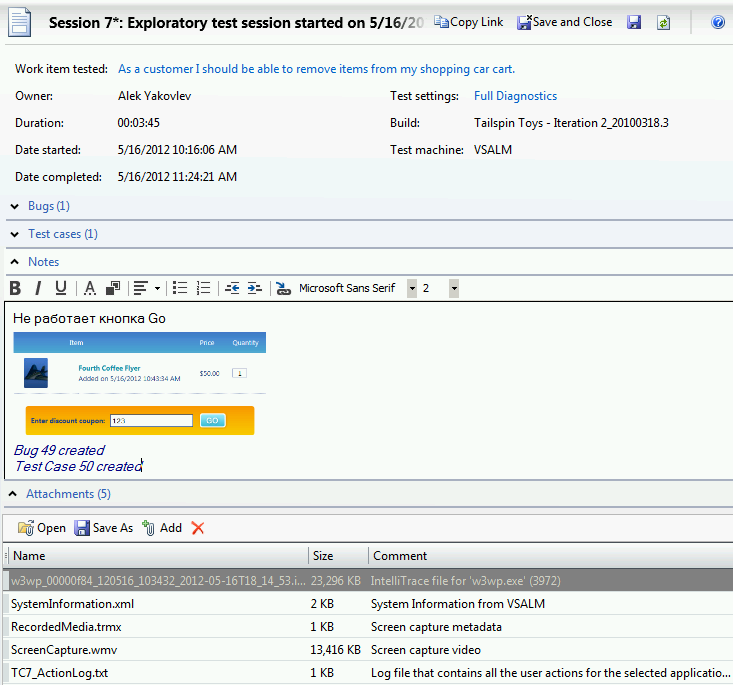
The defect is almost completely documented:
- the sequence of actions is automatically recorded (steps 1-7)
- the defect description is generated from the comments entered and screenshots
- the collected system information
is attached - the Intellitrace log
is attached - the video of what was happening on the screen is attached
Now the quality specialist does not need to remember what he did in order to get the error. All moves are recorded. It will be very easy for the developer to reproduce the sequence of steps and it is very difficult to reject the error with the words "but everything works for me", looking at the video.
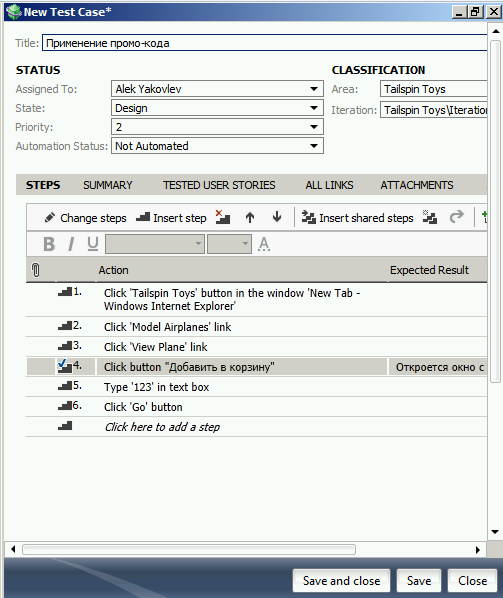
Create a test script
One of the testing practices says that before correcting a found error, you should create a test that checks for the presence of this error.
The “Create test case” function allows you to automatically create a test script based on information about the actions taken.
The actions that were performed during the session are added as test steps. It remains, if necessary, to correct their description and add information about the expected result in the “Expected Result” column.
As a result, we can not only conduct research testing and document errors, but also use this tool to quickly describe test scenarios .
And if at the time of the start of the testing session we selected the requirement, then the errors found and the testing scenario will be tied to the requirement. However, such relationships can always be added manually.
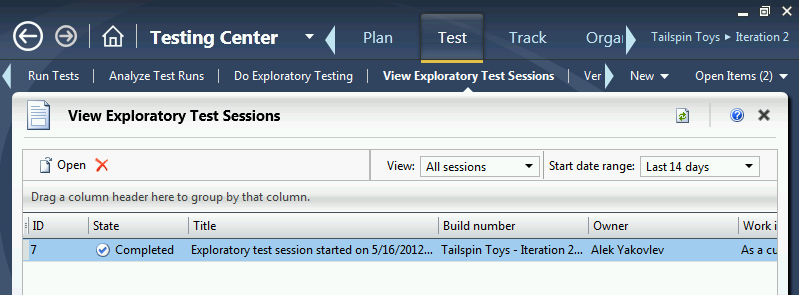
Saved Research Testing Sessions
Research test session information may be retained even if no defects were found.
You can view them on the View Exploratory Test Sessions tab.
You can open a detailed description of the session and view the collected data
. The same data (Test Result) is collected by the system during other types of tests.
Configuring Information Collected
Briefly look at the settings for the information collected during testing.
In MTM, we can create and use several test configurations, including not only local profiles, but also profiles for complex test environments that include several machines, which allows, for example, collecting logs of events both on application servers, on the client workstation, and on other machines included in the test environment.
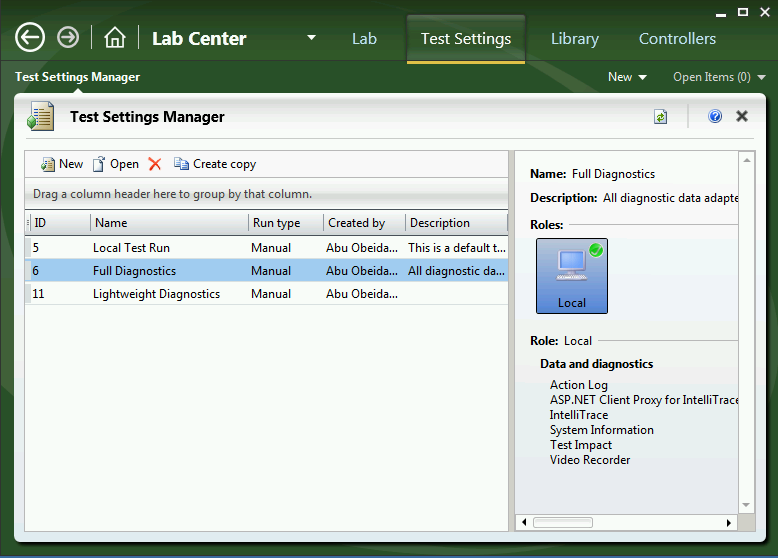
To configure, we switch from the Testing Center mode to the Lab Center and open the Test Settings tab.
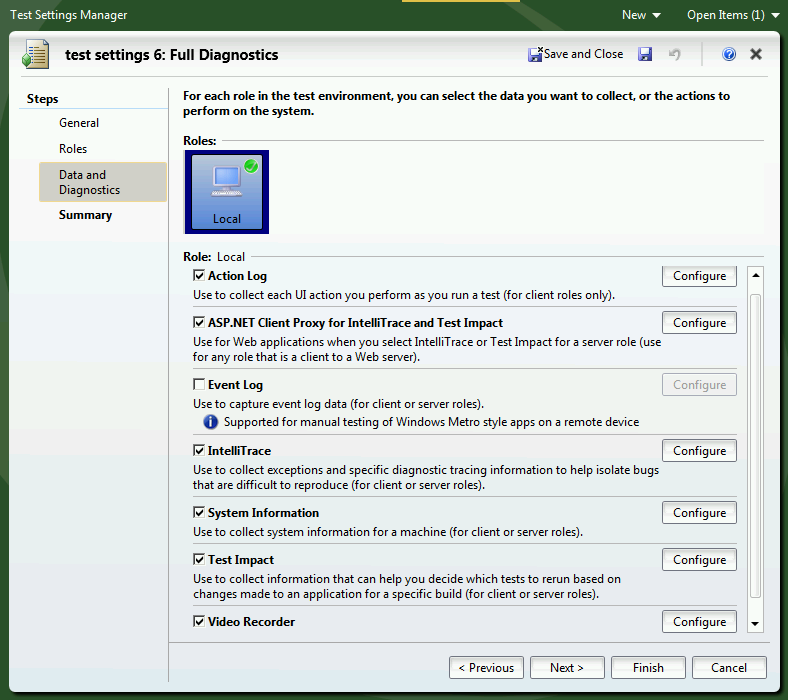
We select one of the configurations and see its settings for one of the roles of machines included in the test environments:
Several basic data acquisition adapters are available:
- IntelliTrace - collection of historical application execution protocol. Articles on Habré.
- EventLog - collecting events from the Windows event log
- System Information - collecting operating system configuration data
- Test Impact - collection of data about application code lines executed during the test. Used to identify tests that could be affected by new changes in the version control system (a good topic for the article, right?)
- Video Recorder - record what is happening on the screen in a video file. There are settings for bitrate and quality level. You can also write sound.
- Action Log - record operations with the user interface.
The last paragraph requires clarification. The system really recognizes which buttons were clicked, which links are open, which fields are filled, etc. Moreover, this mechanism is used in several places: in the tools for describing automatic tests of the user interface (Coded UI Test), in the system of partial automation of manual tests, as well as during research testing.
Supported applications are Windows Forms 2.0, Win32, WPF, Silverlight, Web and HTML5 through IE8-10 and some others.
There are unsupported technologies - Flash / JAVA, SAP, Lotus Notes. A number of technologies are supported through additional extensions.
Conclusion
Research testing is one type of testing. And it should be used as an addition to existing unit testing procedures, automatic, functional, ergonomic, load testing, security testing, etc.
The tools used should provide a unified environment for running tests, storing results and ensure connectivity with all project entities - requirements, defects and test scripts.