Analytical approach for the manager
Comments in the latest publication “How open-source is the R ecosystem good for solving business problems?” About the uploads in Excel led to the idea that it makes sense to spend time and describe one of the tried and tested approaches that can be implemented without leaving R.
The situation is quite typical. The company always has N methods for which managers manually try to build reports in Excel. Even if they are automated, there is always a situation where you need to urgently make a new arbitrary cut or make a presentation for any manager in a specific form.
And there is a series of manually supported excel dictionaries to convert the data in reports and samples in the correct terminology.
Due to the fact that no suitable tool (the mass of additional nuances will be lower) could not be found, it was necessary to pile the “universal constructor” on Shiny + R. Due to the universality and parametrizability of the settings, such a constructor can be easily planted on almost any system in any subject area.
It is a continuation of previous publications .
Brief statement of the problem
- As a source of technical data there is the main storage of the OLAP-type (we focus on Clickhouse), several additional (Postgre, MS SQL, REST API) and manual xml, json, xlsx reference books. Due to the fact that an ad-hoc analyst is required, which includes the counting of unique values, it is necessary to work only with the source data, and not with aggregates.
- There are hundreds of billions of rows in several hundreds of columns in the database (time events), analysis should be done in a mode measured for no more than several tens of seconds, queries can be completely unpredictable, data is stored in technical form (English abbreviations, numbers of dictionary entries, etc. ). In the target state, ~ 200Tb of raw data is expected.
- Accumulated events have version specificity, i.e. as the System functions, it accumulates information from various versions and releases of sources reporting in various ways about themselves.
- Managers work well in excel, but should not know (and physically can not) the technical component of the System.
How to solve the problem
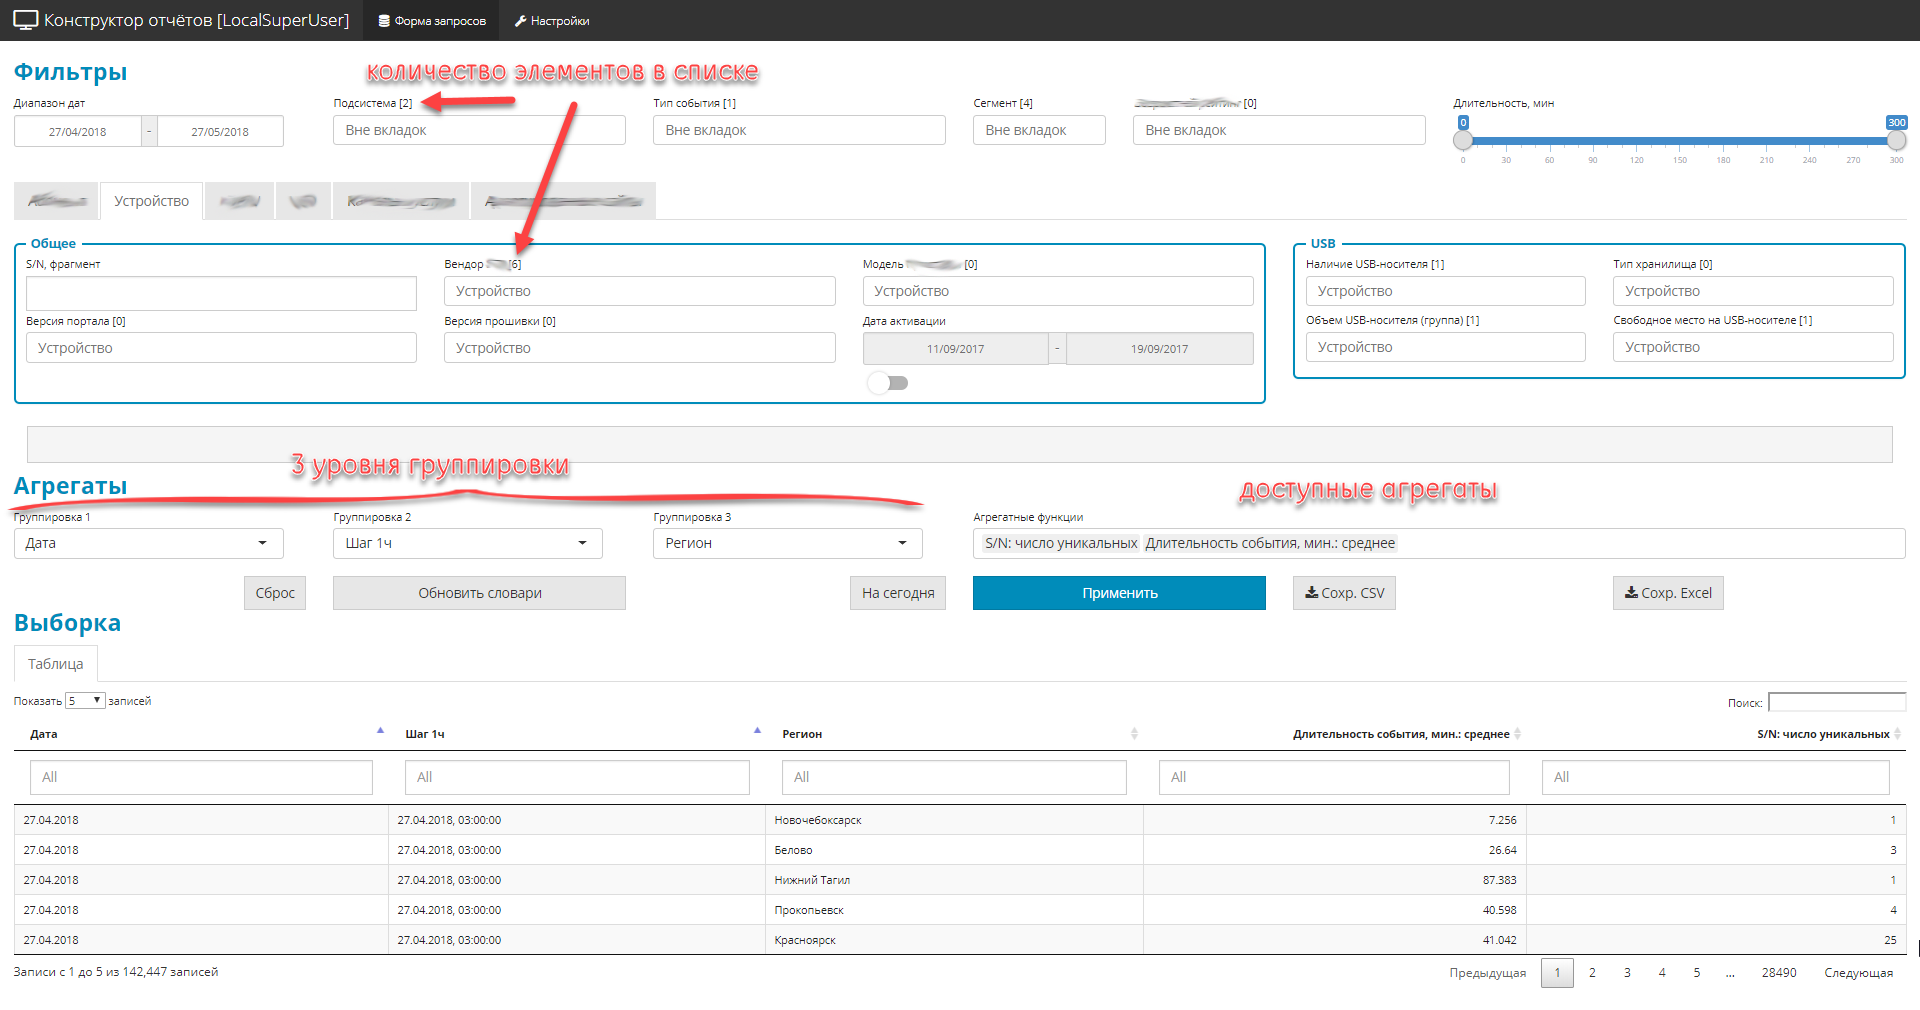
The overall work scenario is pretty straightforward. The manager received an urgent task for an analytical slice - the manager opens the application, in terms of the domain he creates arbitrary samples - he watches and turns the tabular result - unloads the arranged result in excel - draws a picture for the manual. The convenience and simplicity of the user interface was chosen as the zero point.
- Everything is designed as a single-screen Shiny application with a navigation menu and bookmarks.
- All controls are divided into 3 parts:
- filters (global and private). Restrict the sample area, there are 4 types: drop-down list dictionary, dates, text fragments, digital range.
- 3 levels of nesting groupings request
- list of aggregate values (namely values).
- Due to the fact that there are many fields in the original source (about 2.5 hundred), and all must be displayed, the control elements are grouped into thematic blocks.
Interface example
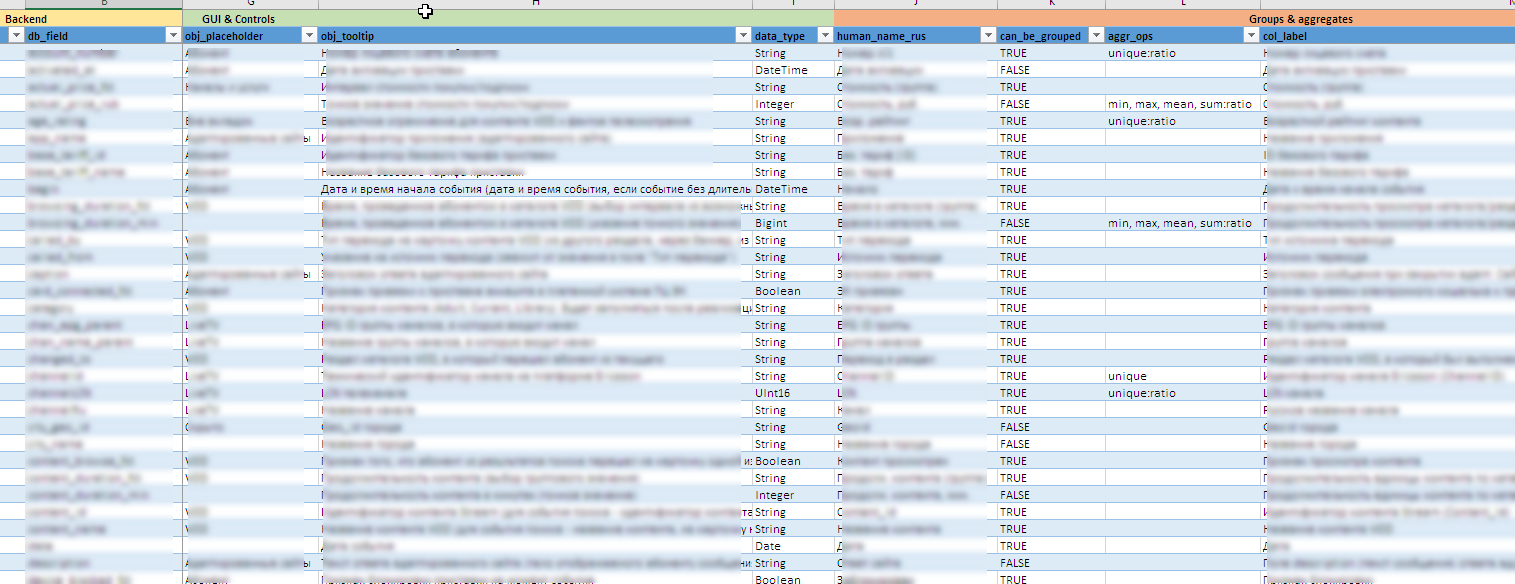
An example of a file with meta-information
Useful "chips" offscreen:
- As data sources evolve, the entire interface configuration, including the creation of controls, hints, the contents of available groups and aggregates, rules for uploading to excel, etc. decorated as a metamodel as an excel file. This allows you to quickly modify the "constructor" for new fields or design aggregates without significant changes (or no changes at all) in the source code.
- It is difficult to say in advance what values may occur in a particular field, and even to find that, I don’t know what is even more difficult. Manually maintain all 90 dynamic controls is almost impossible. In some lists, vocabulary includes several hundred values. Therefore, dictionary entries for controls are updated in the background based on the data accumulated in the backend.
- Managers need to see all fields and content in Russian. And in the sources of this data can be stored in the service form. Therefore, a combination of Clickhouse dictionary technologies and bilateral post-processing of field values at the Shiny level is used. It also provides processing of any kind of exceptions to the rules and versioned nuances of the field contents.
- To protect against incorrect samples, a cross-link between lists for grouping was made. Level 2 can be selected only if Level 1 is set, and Level 3, only if Level 2 is set. And lists of available values are dynamically reduced taking into account those already selected.
- An important element is the control over the display of the sample both on the screen and when it is subsequently uploaded to excel. Here, too, there are a number of features in postprocessing aimed at the convenience of the tool for the manager:
- organized support for "matrix visibility" in the form of an excel file. This matrix determines the display or hiding of certain fields in the sample, depending on the installed filters.
- line-by-line dynamic modification of the sample content. Depending on the content of these or other fields, the contents of another field can be changed (for example, if 0 is indicated in the “order volume” field, then an empty line should be displayed in the “order type” field.
- management of the display of personal data. depending on the configured permissions for role-based access, Pers. data can be both displayed and partially masked with
*. - precision control. just to mention. show 10 decimal places - moveton, but there are situations when there is a lack of accuracy of 2 decimal places. 80% of objects, for example, have a percentage
0.00%- it is necessary to increase significant signs when rounding, so that the difference between the lines is visible. Yes, and the amount for unloading in excel should converge (the amount for all rows in the fractional column is reasonably expected in the region of 100%). - ensuring role access at the level of available content of controls. Access rights are controlled by a json configuration file.
- Dynamic depth control query. In the case when no groupings and aggregates are specified (the study is in progress and you just need to issue raw data falling under the established filters), the backend overload protection is activated. The user can set the time range to search in 1 year, but really need the last 1000 entries from the sample. Knowing that millions of records are received daily, first a test request is made for a reduced depth (3-7 days ago). If the received number of rows is not enough (strict filtering conditions), then a full query is run for the entire time period.
- Uploading received samples in excel format. Everything is formatted, everything is in Russian, accompanied by a separate sheet with the fixation of all the parameters of the sample, so that you can easily understand how this or that result was obtained.
- The application has a detailed log, so you can get an idea of how the user actions, and the work of the engine compartment mechanics.
Anticipating possible comments about the "bike", if they are 100% free, I immediately suggest writing them with an indication of the open source product you know. I will be glad to new discoveries.
Naturally, a link to the product should be given taking into account the full range of the requirements put forward. Well, preferably immediately with the assessment of the required infrastructure. For this option, two to three medium-capacity servers are enough for the entire complex (64-128Gb; 12-20 CPU core, the disk is based on the data volume). ELK did not fit, since the main task is numerical analytics, not work with text.
Expanded Requirement Set
Below, for information, there is a detailed list of requirements for the analytical unit in terms of the machine-machine and man-machine interfaces (“report designer” is only a part).
Import \ export \ environment
- Log files are standardized and structured only in terms of timestamps, modules and subsystems. The system should process log files with arbitrary content of the message content (log entry body), supporting both structured and unstructured log entry body.
- To enrich the data, the System must have import adapters for at least the following types of data sources:
- flat files (csv, txt)
- structured xml, json, xlsx files
- odbc compatible sources, in particular, MS SQL, MySQL, PostgreSQL
- data provided by the REST API.
- The system should support both automatic import and import upon user request. When importing user data, the System should provide:
- possibility of technical validation of imported data (correct number of fields, their types, completeness, availability of values
- possibility of logical validation (field contents, validation, cross validation, ...)
- the ability to customize the parameters of validation (in any form) in accordance with the logic of the import procedure;
- detailed report on detected technical and logical errors, allowing the operator to locate and troubleshoot the imported data as quickly as possible.
- The system must support the export of results in at least the following formats:
- export data to flat files csv, txt
- data export to structured xml, json, xlsx files
- data export to odbc compatible sources, in particular, MS SQL, MySQL, PostgreSQL
- providing access to data via REST API
- The system should have the functionality to generate printed report views:
- connected merging of text, tabular views and graphic representations into a single document according to a pre-formed template (story telling);
- the formation of all the calculated elements (tables, graphs) at the time of generation of the printed form;
- use of external sources and reference books required for the preparation of a report, on-the-fly using any protocols mentioned above, without integration and duplication of data
- export of generated reports to html, docx, pdf formats
- the formation of printed representations both on demand and in the background, according to the schedule should be supported.
- The system should keep a detailed log of the calculations, active user actions or interaction with external systems.
- The system must be installed on the on-site.
- Installation and subsequent operation should be carried out with complete isolation of the system from the Internet.
Calculations
- The system must support the calculation of aggregate metrics (minimum, maximum, average, median, quartile) for an arbitrary time interval in the mode close to real time.
- The system should support the calculation of basic metrics (number of values, number of unique values) for an arbitrary time interval in the mode close to real time.
- When calculating aggregate data, aggregation periods should be determined by the user from predefined ranges: 5 min, 10 min, 15 min, 20 min, 30 min, 1 hour, 2 hours, 24 hours, 1 week, 1 month
- The system must include a constructor for generating arbitrary samples. The composition of possible operations should be determined by a predetermined data meta-model. The designer should maintain the following minimum settings:
- Filter support for dates: [beginning of reporting period - end of reporting period]
- Filter support (drop-down lists) with the possibility of multiple selections for enumerable fields (for example, cities: Moscow, St. Petersburg, ...)
- Automatic generation of the content of drop-down lists for filters of enumerated fields based on dynamic external directories or accumulated data.
- support of at least three levels of sequential grouping of data in the requested sample; the parameters themselves for grouping are set by the user from the list of available data set at the metamodel level.
- restriction of the fields available for grouping at one level or another, taking into account the fields selected at higher levels of the grouping (for example, if “city” was chosen at the 1st level, then this parameter should not be available at the 2nd or 3rd m levels of grouping)
- possibility of grouping by augmented time parameters: day of the week, hour group (11-12; 12-13), week
- support of basic calculated aggregates: (minimum, maximum, average, median, number, number of unique);
- support of test filters to provide full-text search in the sample;
- support at the stage of enrichment mapping and transformation of data obtained on request based on data from external reference books or sources.
- The system should have mechanisms for calculating the metrics in spatial coordinates (sp = spatial point) to support geoanalytics.
- For time metrics (transactions, operations, queries, ...), the system should calculate and display the distribution density of query execution time.
- All calculated indicators must be performed for all objects as a whole, and for subsamples set by the user using filters
- The system must perform all calculations in memory.
- All events have a timestamp, so the system must support work with both equidistant and arbitrary time series.
- The system should support the ability to configure and enable mechanisms for recovering missing data in time series (various algorithms), determining anomalies, forecasting time series, classifying / clustering.
Interface part
- The entire user interface, including the contents of graphic and tabular elements, must be localized.
- For control elements and columns of table views, the ability to generate hover tips with a detailed description (hover tip), generated both in a static manner and dynamic (for example, the prompt may be parameters for which the calculation was performed) must be supported.
- The workplace interface should be built using only HTML, CSS, JS technologies, without using outdated, platform-dependent or non-porting technologies, like Adobe Flash, MS Silverlight, etc.
- Time on the charts should be displayed in 24-hour format.
- Parameters for displaying data on axes should support automatic scaling (label frequency and display format) depending on the range of values. A typical example is the display of hours with a measurement range within one day, the display of days with a measurement range within a week.
- The system should, at a minimum, support the following atomic graphic display formats:
- Histogram (bar)
- Dot
- Linear
- Heat map
- Contours (contours)
- Pie charts
- The system should support the ability to intelligently automatically place markers (for example, values) of a certain subset of points while ensuring minimal overlap of these markers.
- The system should support the ability to combine on a single graphical representation of data obtained from different data sources. The ability to specify different atomic graphic display formats for each data source should be supported, provided that the coordinate axes and the type of coordinate system coincide.
- The system must support the facet (splitting of graphs on the M x N grid) distribution of atomic graphs according to a given parametrization variable. With a facet display, for each graph, it must be possible to independently scale both the X axis and the Y axis.
- Graphs must support parameterization of the following characteristics:
- Colour
- Line or point type
- Line thickness or point contour
- Point size
- Transparency
- For data geo-analysis tasks, the system must support work with shapefiles, including import, display, areal parameterized coloring, and provide for the imposition of various graphical elements and calculated indicators on the formed geo-subclause.
- Controls user interface (lists, fields, panels, etc.) must support the dynamic change of its content depending on the state of other elements. For example, when selecting a specific region, the content of the city selection element should be limited to the list of cities in the region.
- The role model of access to reporting applications should be supported:
- Data metamodel support for url-level role access (possible \ impossible)
- Support for the meta-model of data to provide role-based access at the content level of a control element (for example, the list of available objects in drop-down lists is determined by the manager’s regional responsibility)
- Support for the meta-model of data to provide role-based access at the level of visualization of personal data (for example, masking "*" of a certain part of e-mail numbers or other fields)
Conclusion
The main purpose of the publication is to show that the possibilities of R quite strongly extend beyond the boundaries of classical statistics. It is checked practically, it is not necessary to compromise quality or functionality.
Previous publication - “How good is an open-source R ecosystem for solving business problems?” .