The whole truth about vertical scaling in PaaS and why you overpay for shared hosting
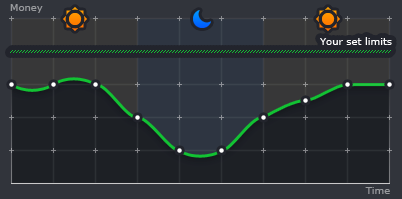
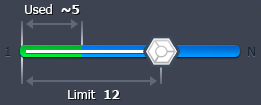
As you know, the application does not always use the same amount of resources, but thanks to the automatic vertical scaling function, the size of the container for the application changes in Jelastic. Accordingly, the user does not need to overpay for reserved resources that are not used, as is the case with other PaaS. Indeed, the business model of the entire hosting industry and the old generation of PaaS solutions is based on “overselling” . Thus, the importance of fair payment for actual consumption of resources is obvious.
 It’s clear that at the time when the JVM was being developed, no one knew about clouds or virtualization, and, moreover, no one even thought about density in PaaS. Today, virtualization has changed the game in the hosting industry, and this revolution will continue. Now we can use resources more efficiently. Michael Widstendt , one of the main architects of the JVM at Oracle, has confirmed that the JVM is not designed for PaaS at all, but Oracle is doing its best to change that. Plus, the guys from IBM are moving in the same direction. Some notes on JVM dynamic behavior can be found in the IBM JavaOne Keynote 2012 Highlights .
 Honestly, “inventing” vertical scaling was not easy due to a number of technical limitations. One of these limitations is directly related to the JVM. In this article, we would like to share some information that may be useful for understanding vertical scaling and the above limitations.
To begin with, we created an application that itself controlled the consumption of resources and through the API, when it reached the upper limit, it gave the command to the infrastructure to increase the limit, and vice versa, when resources were not needed, it gave the command to pick them back. Such an algorithm worked quite well, but during the testing one more nuance was found out: Java does not work very well with scaling, since it can start with a small amount of memory, then take additional resources when necessary, but it does not return them to OC . This was specifically designed by JVM engineers to speed up the process of getting memory the next time it is needed. Of course, this is not acceptable for our cloud model.
Then we conducted a series of experiments on how Java behaves, or rather garbage collectors, such as: Serial, Parallel, Concurrent Mark Sweep and G1.
In Java, dynamic object allocation is achieved using a new operator. An object, as soon as it is created, uses part of the memory, and the memory remains reserved until there is no access to the object. In the case when the object is not accessed, it is assumed that it is no longer needed, and the memory occupied by it can be freed. There is no explicit need to destroy the object itself, since Java can automatically move it in memory. Garbage collection is just the method that solves this problem. Programs that do not release unnecessary sections of memory in time can cause an uncontrolled decrease in the amount of free memory - the so-called “memory leak”. In Java, garbage collection occurs automatically throughout the entire program life cycle, eliminating the need for freeing up memory and thus prevents leakage. More information on the Garbage Collection in Java can be found in the book.Java Enterprise Performance Book or Javarevisted Blog .
Let's start with Serial. It uses one thread to do all the garbage collection work. It is best suited for uniprocessor machines, sometimes it can be useful for multiprocessor machines that run applications with small data sets (up to about 100 MB).
This garbage collector showed very good scaling results. We found out that it has compactization properties, that is, we can say that it does defragment the memory, and returns unused resources to the OS.
Let's see this again by testing the Serial Garbage Collector on JVM 6 and JVM 7.
Java 6
More precisely, we will test Java version 1.6.0_27.
We launch the Visual JavaVM utility, which makes it possible to monitor all Java processes running on the computer, as well as to monitor how much these processes consume memory.
For testing, we will use a program that dynamically allocates and frees memory in an infinite loop:
We start the JVM with the following parameters:
-XX: + UseSerialGC -Xmx1024m -Xmn64m -Xms128m -Xminf0.1 -Xmaxf0.3 , where
-XX: + UseSerialGC - use Garbage Collector Serial;
-Xmx1024m - the maximum use of RAM - 1024 MB;
-Xmn64m - heap step equal to 64 Mb;
-Xms128m - the minimum value of heap equal to 128 MB;
-Xminf0.1 - this parameter defines the minimum free space in the heap and instructs the JVM to expand it if there is no at least 10% free space after garbage collection;
-Xmaxf0.3 - this parameter determines how much heap is expanded and instructs the JVM to compact it if the amount of free space exceeds 30%.
By default, the values for Xminf and Xmaxf are 0.3 and 0.6, respectively, but for the experiment we significantly reduced these limits in order to increase the amplitude of the vertical scaling.
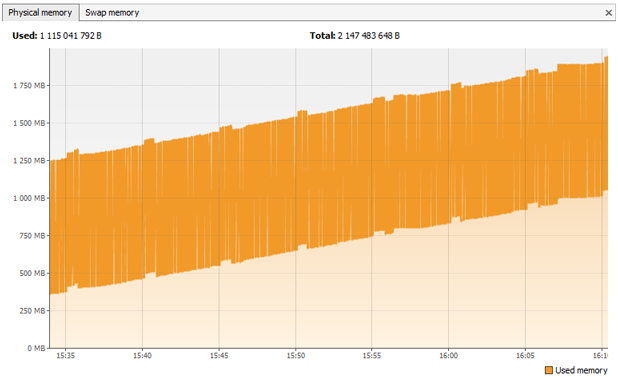
As a result, according to a separate execution process of our program, we see that the memory is dynamically filled and freed up:
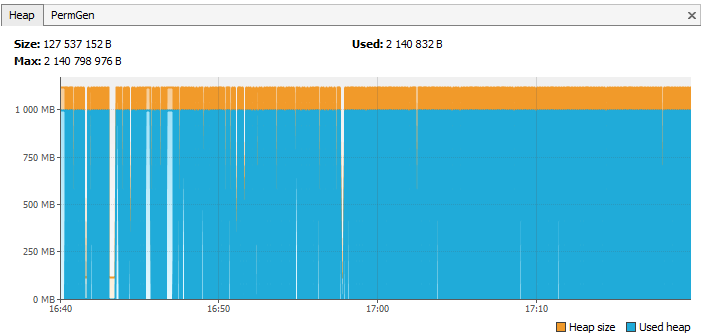
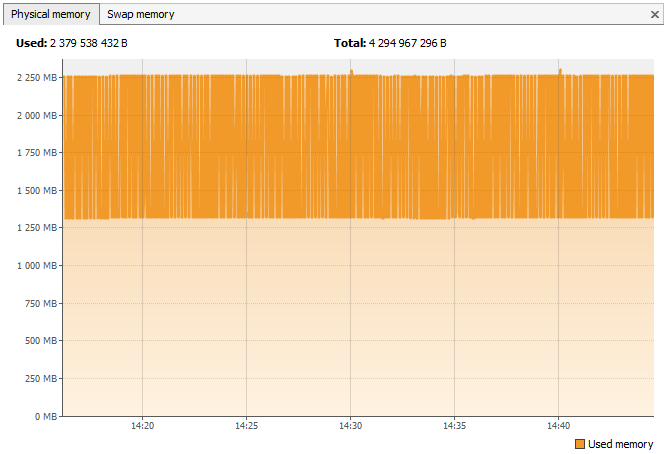
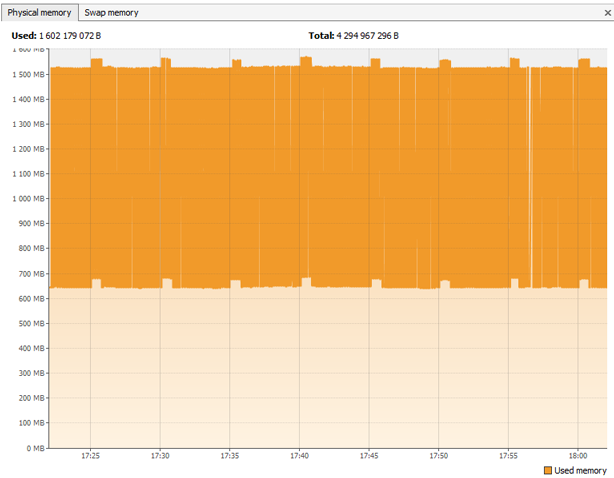
Let's also take a look at the graph of the total memory consumed to make sure there are no leaks:

Java 7
We will test version jdk 1.7.0_03
We use the same program and set the same parameters for the JVM. As you can see with JDK 7, everything is also smooth:
A good result, but, unfortunately, as we mentioned above, this garbage collector works only with single-processor machines and small amounts of memory, which is not enough for large, bulky applications to function.
Parallel can do small garbage collection work in parallel, which can significantly reduce resource and time consumption. This is useful for medium and large dataset applications that run on multi-processor and multi-threaded machines.
Let's repeat our experiment for the Parallel Garbage Collector.
The result for the total memory consumed for Java 6 :
And for Java 7 :
Parallel, of course, has many advantages over Serial, for example: it can work with multi-threaded applications, multi-processor machines, quickly copes with large amounts of memory. But, alas, as we see in the graphs, it does not return unused resources back to the operating system.
Concurrent Mark Sweep does most of the work while the application is still running. This can significantly reduce pauses for garbage collection. It is designed for applications with medium and large data sets for which response time is more important than overall throughput.
Repeat the procedure again for the Concurrent Mark Sweep.
And again, the situation is similar to the previous one:
Java 6 :
Java 7 :
And then G1 appears, which has all the advantages of Parallel and Concurrent Mark Sweep, and satisfies all our requirements.
We started testing it, and it turned out that with prolonged operation of G1, a stable memory leak constant is observed.
Java 6 :
Of course, we addressed this problem to Oracle representatives. Oracle employees Ivan Krylov and Vladimir Ivanov from St. Petersburg quickly responded to our request and as a result, this problem was fixed in JVM 7. Let's check:
As you can see, everything is ok in Java 7, the advanced G1 fulfilled its mission completely.
As you understand, the ability to pay upon the use of resources is a very important factor for each client and company. No one should overpay. However, there are several more blockers that prevent rapid development in this direction. We will continue to do our best to continue the revolution in the hosting industry.
The video below explains how automatic zooming works in Jelastic:
* For unknown reasons, the official bug in our report on memory leak in G1 was removed from the Oracle database. More information about this bug can be found here .
It’s clear that at the time when the JVM was being developed, no one knew about clouds or virtualization, and, moreover, no one even thought about density in PaaS. Today, virtualization has changed the game in the hosting industry, and this revolution will continue. Now we can use resources more efficiently. Michael Widstendt , one of the main architects of the JVM at Oracle, has confirmed that the JVM is not designed for PaaS at all, but Oracle is doing its best to change that. Plus, the guys from IBM are moving in the same direction. Some notes on JVM dynamic behavior can be found in the IBM JavaOne Keynote 2012 Highlights .Honestly, “inventing” vertical scaling was not easy due to a number of technical limitations. One of these limitations is directly related to the JVM. In this article, we would like to share some information that may be useful for understanding vertical scaling and the above limitations.To begin with, we created an application that itself controlled the consumption of resources and through the API, when it reached the upper limit, it gave the command to the infrastructure to increase the limit, and vice versa, when resources were not needed, it gave the command to pick them back. Such an algorithm worked quite well, but during the testing one more nuance was found out: Java does not work very well with scaling, since it can start with a small amount of memory, then take additional resources when necessary, but it does not return them to OC . This was specifically designed by JVM engineers to speed up the process of getting memory the next time it is needed. Of course, this is not acceptable for our cloud model.
Then we conducted a series of experiments on how Java behaves, or rather garbage collectors, such as: Serial, Parallel, Concurrent Mark Sweep and G1.
How the Garbage Collection Works
In Java, dynamic object allocation is achieved using a new operator. An object, as soon as it is created, uses part of the memory, and the memory remains reserved until there is no access to the object. In the case when the object is not accessed, it is assumed that it is no longer needed, and the memory occupied by it can be freed. There is no explicit need to destroy the object itself, since Java can automatically move it in memory. Garbage collection is just the method that solves this problem. Programs that do not release unnecessary sections of memory in time can cause an uncontrolled decrease in the amount of free memory - the so-called “memory leak”. In Java, garbage collection occurs automatically throughout the entire program life cycle, eliminating the need for freeing up memory and thus prevents leakage. More information on the Garbage Collection in Java can be found in the book.Java Enterprise Performance Book or Javarevisted Blog .
Serial Garbage Collector (-XX: + UseSerialGC)
Let's start with Serial. It uses one thread to do all the garbage collection work. It is best suited for uniprocessor machines, sometimes it can be useful for multiprocessor machines that run applications with small data sets (up to about 100 MB).
This garbage collector showed very good scaling results. We found out that it has compactization properties, that is, we can say that it does defragment the memory, and returns unused resources to the OS.
Let's see this again by testing the Serial Garbage Collector on JVM 6 and JVM 7.
Java 6
More precisely, we will test Java version 1.6.0_27.
We launch the Visual JavaVM utility, which makes it possible to monitor all Java processes running on the computer, as well as to monitor how much these processes consume memory.
For testing, we will use a program that dynamically allocates and frees memory in an infinite loop:
public class Memoryleak {
public static void main (String [] args) {
System.out.println ("START ....");
while (true) {
System.out.println ("next loop ...");
try {
int count = 1000 * 1024;
byte [] array = new byte [1024 * count];
Thread.sleep (5000);
array = null;
System.gc ();
System.gc ();
Thread.sleep (5000);
} catch (InterruptedException ex) {
}
}
}
}
We start the JVM with the following parameters:
-XX: + UseSerialGC -Xmx1024m -Xmn64m -Xms128m -Xminf0.1 -Xmaxf0.3 , where
-XX: + UseSerialGC - use Garbage Collector Serial;
-Xmx1024m - the maximum use of RAM - 1024 MB;
-Xmn64m - heap step equal to 64 Mb;
-Xms128m - the minimum value of heap equal to 128 MB;
-Xminf0.1 - this parameter defines the minimum free space in the heap and instructs the JVM to expand it if there is no at least 10% free space after garbage collection;
-Xmaxf0.3 - this parameter determines how much heap is expanded and instructs the JVM to compact it if the amount of free space exceeds 30%.
By default, the values for Xminf and Xmaxf are 0.3 and 0.6, respectively, but for the experiment we significantly reduced these limits in order to increase the amplitude of the vertical scaling.
As a result, according to a separate execution process of our program, we see that the memory is dynamically filled and freed up:
Let's also take a look at the graph of the total memory consumed to make sure there are no leaks:
Java 7
We will test version jdk 1.7.0_03
We use the same program and set the same parameters for the JVM. As you can see with JDK 7, everything is also smooth:
A good result, but, unfortunately, as we mentioned above, this garbage collector works only with single-processor machines and small amounts of memory, which is not enough for large, bulky applications to function.
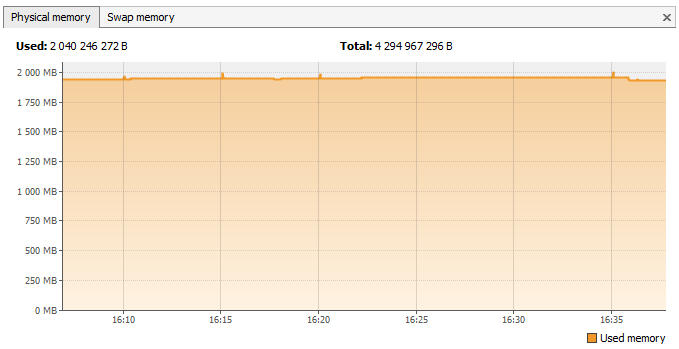
Parallel Garbage Collector (-XX: + UseParallelGC)
Parallel can do small garbage collection work in parallel, which can significantly reduce resource and time consumption. This is useful for medium and large dataset applications that run on multi-processor and multi-threaded machines.
Let's repeat our experiment for the Parallel Garbage Collector.
The result for the total memory consumed for Java 6 :
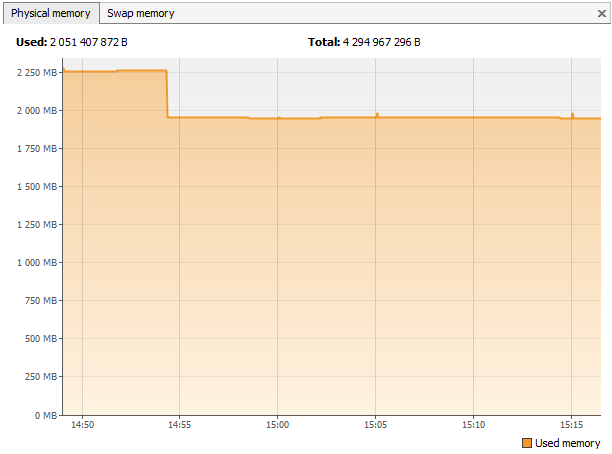
And for Java 7 :
Parallel, of course, has many advantages over Serial, for example: it can work with multi-threaded applications, multi-processor machines, quickly copes with large amounts of memory. But, alas, as we see in the graphs, it does not return unused resources back to the operating system.
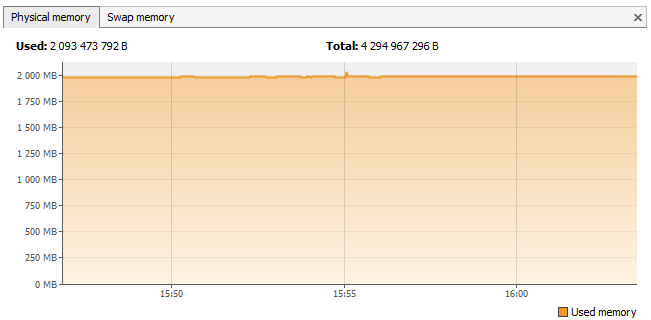
Concurrent Mark Sweep Garbage Collector (-XX: + UseConcMarkSweepGC)
Concurrent Mark Sweep does most of the work while the application is still running. This can significantly reduce pauses for garbage collection. It is designed for applications with medium and large data sets for which response time is more important than overall throughput.
Repeat the procedure again for the Concurrent Mark Sweep.
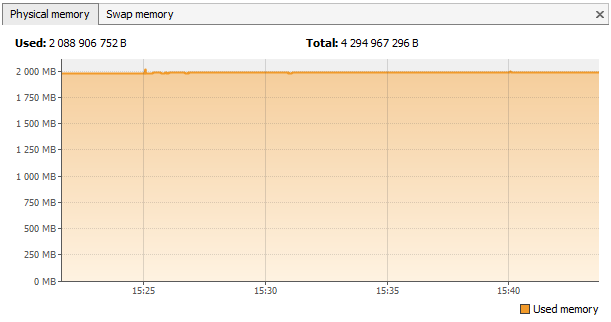
And again, the situation is similar to the previous one:
Java 6 :
Java 7 :
G1 Garbage Collector (-XX: + UseG1GC)
And then G1 appears, which has all the advantages of Parallel and Concurrent Mark Sweep, and satisfies all our requirements.
We started testing it, and it turned out that with prolonged operation of G1, a stable memory leak constant is observed.
Java 6 :
Of course, we addressed this problem to Oracle representatives. Oracle employees Ivan Krylov and Vladimir Ivanov from St. Petersburg quickly responded to our request and as a result, this problem was fixed in JVM 7. Let's check:
As you can see, everything is ok in Java 7, the advanced G1 fulfilled its mission completely.
As you understand, the ability to pay upon the use of resources is a very important factor for each client and company. No one should overpay. However, there are several more blockers that prevent rapid development in this direction. We will continue to do our best to continue the revolution in the hosting industry.
The video below explains how automatic zooming works in Jelastic:
* For unknown reasons, the official bug in our report on memory leak in G1 was removed from the Oracle database. More information about this bug can be found here .