November 29, 2011 at 18:20
HTML5 Canvas Map - map engine implementation
As part of a large interactive web-based project (more about which is possible in another post), I am developing a cartographic engine implemented on HTML5 CANVAS. Its development reached the beta stage and, with the approval of my leadership, there was a desire to show these cards to the general public.
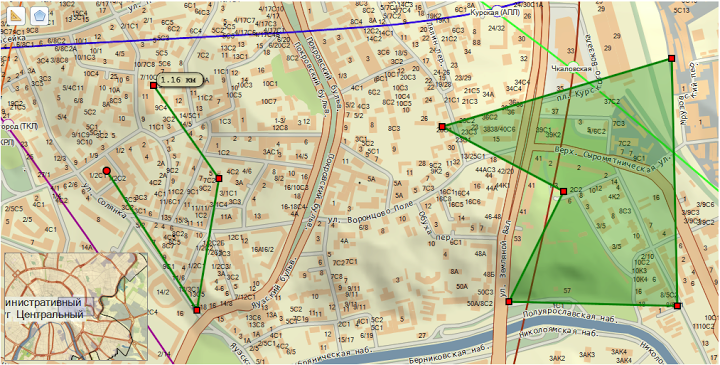
The engine was developed without the use of any specialized libraries or frameworks. The only library used is jQuery.
Map images - tiles - are generated using our utility. There is still something to strive for, since we have not yet dealt with their optimization.
Everything is drawn on CANVAS, with the exception of elements such as a panel of additional tools and popups of labels (although in the demo from the link below they are still not there).
The implementation is modular and consists of the following main parts, the purpose of which I think is clear from their names: CanvasDragger, CanvasEventer, CanvasImgLoader, CanvasMapper, CanvasMarker, CanvasMiniMapper, CanvasResizer, CanvasTools, CanvasZoomer.
In order to connect the cards, it is enough to write the following line in the right place html'a:
Next, in the JS code, we initialize (as an example):
Let us dwell in more detail on the parameters:
Or what is hidden behind this or that user action. Let's go through the main events.
When maps are initialized, the number of tiles to be shown is calculated in order to fully cover the canvas. Knowing the canvas size, with a given tile size of 256x256, we perform this operation.
Further, when the map moves - dragg - we check the situation if we moved the map so far that we need to load a new tile. We also check whether all the tiles are in scope, if not, then the "garbage collector" is launched:
When the “mousewheel" event is triggered, the following main actions occur sequentially:
The work was tested in FireFox, Chrome, Safari, Opera and IE latest versions.
For those who are still not in the know, I emphasize the following again. Since canvas is used, all browsers that do not support this technology automatically disappear, and this is IE version 8 and lower and very old versions of the above browsers.
1. Reducing the size of map tiles (should give a tangible increase in speed);
2. The zoom slider;
3. A tool for obtaining information on a point on the map (building address, coordinates, etc.);
4. ???
Demo : share.arkada-sw.ru/canvasmap
General information
The engine was developed without the use of any specialized libraries or frameworks. The only library used is jQuery.
Map images - tiles - are generated using our utility. There is still something to strive for, since we have not yet dealt with their optimization.
Everything is drawn on CANVAS, with the exception of elements such as a panel of additional tools and popups of labels (although in the demo from the link below they are still not there).
Implementation
The implementation is modular and consists of the following main parts, the purpose of which I think is clear from their names: CanvasDragger, CanvasEventer, CanvasImgLoader, CanvasMapper, CanvasMarker, CanvasMiniMapper, CanvasResizer, CanvasTools, CanvasZoomer.
In order to connect the cards, it is enough to write the following line in the right place html'a:
Next, in the JS code, we initialize (as an example):
$(function() {
    mWrap = new MapsWrapper({
        mapDivId: "map2d" // тут указываем ID canvas’a, в котором будет рисоваться карта
    });
});
MapsWrapper = function(properties) {
    this.initialize(properties);
};
$.extend(MapsWrapper.prototype, {
    v2DMapDiv                : null,
    v2DMapComponent   : null,
    initialize: function(prop){
        this.v2DMapDiv = prop.mapDivId;
        this.initMap();
    },
    initMap: function(){
        var GlobalParams = {
            staticMapUrl: ["http://gate.looxity.ru:8088/map.html", "http://zain.looxity.ru:8088/map.html", "http://kaph.looxity.ru:8088/map.html"],
            initCrd     : {x: 7445, y: 9925},
            initZoom    : 0.25,
            zoomList    : [1, 0.5, 0.25, 0.1, 0.05, 0.025],
            miniMap     : true,
            tools       : {scaler: true, polygoner: true}
        };
        this.v2DMapComponent = new CanvasMapper (this.v2DMapDiv);
        this.v2DMapComponent.initialize(GlobalParams);
    }
});
Let us dwell in more detail on the parameters:
- staticMapUrl - hosts from which map tiles are loaded
- initCrd - the initial coordinates in the Gauss-Krueger projection, in this case approximately correspond to the zero kilometer of roads, which is near the Manege Square.
- miniMap - connecting the minimap module
- tools - connection of the module of additional tools
Internal mechanics
Or what is hidden behind this or that user action. Let's go through the main events.
We start
When maps are initialized, the number of tiles to be shown is calculated in order to fully cover the canvas. Knowing the canvas size, with a given tile size of 256x256, we perform this operation.
We are moving
Further, when the map moves - dragg - we check the situation if we moved the map so far that we need to load a new tile. We also check whether all the tiles are in scope, if not, then the "garbage collector" is launched:
unVisibleTilesCollector: function() {
        for(var cnt = 0; cnt < this.__TILES__.length; cnt++) {
            if( (this.__TILES__[cnt].canvX + this.tileSize) < 0
                || this.__TILES__[cnt].canvX > this.canvas.width
                || this.__TILES__[cnt].canvY > this.canvas.height
                || (this.__TILES__[cnt].canvY + this.tileSize) < 0
                ) {
                this.__TILES__.splice(cnt, 1);
                cnt--;
            }
        }
    }
Scalable (zoomIn, zoomOut)
When the “mousewheel" event is triggered, the following main actions occur sequentially:
- the current position of all tiles is copied
$.extend(this.__ANIM_TILES__, this.mapper.__TILES__)- by means of canvas and with the help of mathematics, there is a decrease or increase in tiles (depending on how we turn the mouse wheel) from a copy made in pp
for(cnt; cnt < this.animSteps; cnt++){
	            setTimeout(function(){
	                _this.ctx.clearRect(0,0,_this.canvas.width,_this.canvas.height);
	               _this.ctxMarker.clearRect(0,0,_this.canvas.width,_this.canvas.height);
	                animScale += scale*stepScale;
	                _this.drawAllAnimTiles(evt, {
	                    animScale: animScale,
	                    stepCurrNum: Math.round(Math.abs(animScaleStart-animScale)/stepScale),
	                    stepScale: stepScale
	                });
	             }, delay*cnt);
}- on top, as you load, new tiles are superimposed, in accordance with the new scale
MapsWrapper.v2DMapComponent.update()Work in browsers
The work was tested in FireFox, Chrome, Safari, Opera and IE latest versions.
For those who are still not in the know, I emphasize the following again. Since canvas is used, all browsers that do not support this technology automatically disappear, and this is IE version 8 and lower and very old versions of the above browsers.
TODO List by Card
1. Reducing the size of map tiles (should give a tangible increase in speed);
2. The zoom slider;
3. A tool for obtaining information on a point on the map (building address, coordinates, etc.);
4. ???
Demo : share.arkada-sw.ru/canvasmap