October 4, 2011 at 15:54
Code Coverage based on NUnit tests in Visual Studio
Without further ado, suppose you are in the following situation:
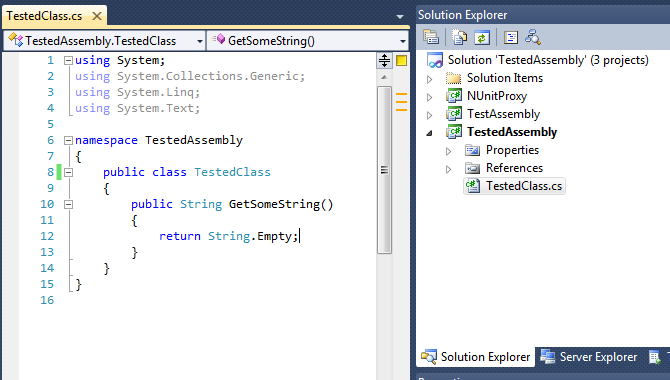
We will consider the above situation for simplicity with a small example. In Visual Studio (in our case, this is Visual Studio 2010 Ultimate), create a new project of the Class Library type and call it TestedAssembly for the sake of obviousness. In the above-mentioned project, we add one single TestedClass class, which we will have from the only simple GetSomeString method.
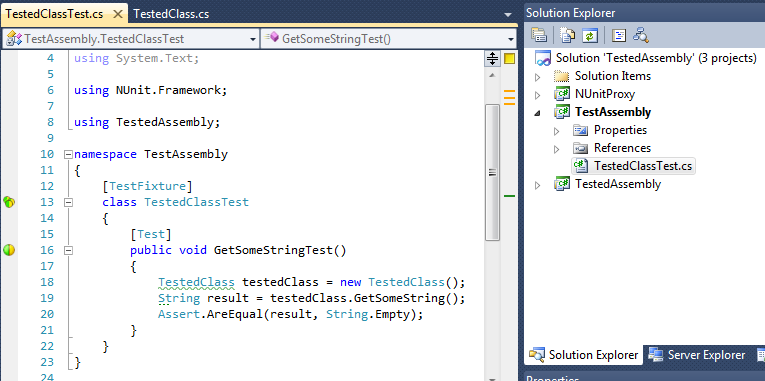
Now we will be engaged in the project with tests. Add another Class Library to the solution, which we will call TestAssembly. In this assembly, we will also have only one TestedClassTest class with a single GetSomeStringTest method.
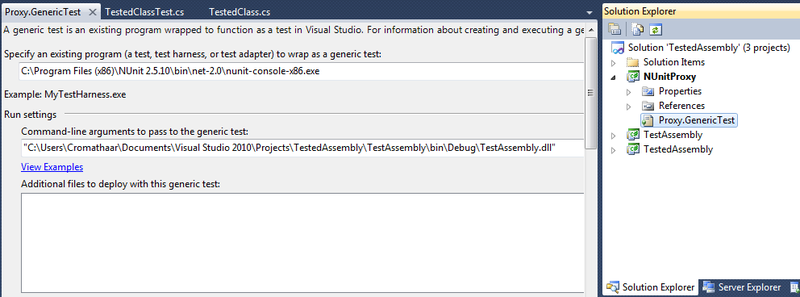
Well, now it’s time to discuss the most interesting: how to get Visual Studio to collect data about code coverage by tests, which it does not want to run. Well, if he doesn’t want, then he won’t be, let a professional in his field, namely NUnit himself, take up this matter. Add another project to our long-suffering solution, this time of the Test Project type, and call it, say, NUnitProxy. The studio will automatically put the UnitTest1.cs file in it, which we, with a clear conscience, will delete and add the Generic Test instead. In the first field of test settings, we need to specify the full path to nunit-console-x86.exe (note that x86 is important), and in the second field we will write the full path to the assembly with tests (in our case, this is the TestAssembly project). The main thing - do not forget the quotation marks.
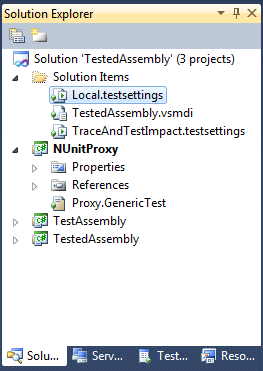
Now let's go to the Solution Items folder, which magically materialized in the solution after adding the NUnitProxy project, and double-click on the Local.testsettings file.
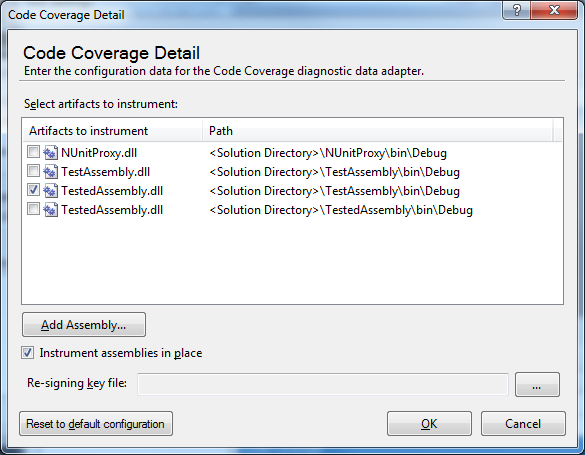
The Test Settings dialog opens, in which we need to go to the Data and Diagnostics tab, check the Code Coverage checkbox and click the Configure button. You will see the Code Coverage Detail window, designed to select assemblies for which Visual Studio will collect code coverage data. Here is another small nuance: if you browse the assembly, which lies in the \ bin \ Debug \ folder of the tested project, then the result of the analysis will be the enchanting emptiness of the universe. Click the Add Assembly ... button and specify the path to the assembly under test, which lies in the \ bin \ Debug \ folder of the project with tests (in our case TestAssembly). Make sure that the Instrument assemblies in place checkbox is selected, and with a calm soul, click OK, Apply and Close.
That's all. Visual Studio sees our proxy test, run it, watch the NUnit console open, and upon completion of the test run we head to the Code Coverage tab, where we see quite expressive results.
Well, lastly, two tablespoons of tar in a barrel of honey. Firstly, Visual Studio is not able to instrument x64 assemblies with all the consequences: if you want Code Coverage - recompile for x86 (Any CPU also works). Secondly, if the code in the assembly is not covered at all, then this assembly will not be included in the final report (you can experiment by commenting out the body of the GetSomeStringTest method), which, as you know, in certain situations can lead to an incorrect value of the final coverage (when they are collected data for multiple assemblies).
- you have some .NET project;
- for this project you wrote NUnit tests (or they are already written);
- you were solemnly presented with Visual Studio 2008 Team System (or higher) or Visual Studio 2010 Premium (or higher) and instructed to analyze the code coverage with tests (aka code coverage).
We will consider the above situation for simplicity with a small example. In Visual Studio (in our case, this is Visual Studio 2010 Ultimate), create a new project of the Class Library type and call it TestedAssembly for the sake of obviousness. In the above-mentioned project, we add one single TestedClass class, which we will have from the only simple GetSomeString method.
Now we will be engaged in the project with tests. Add another Class Library to the solution, which we will call TestAssembly. In this assembly, we will also have only one TestedClassTest class with a single GetSomeStringTest method.
Well, now it’s time to discuss the most interesting: how to get Visual Studio to collect data about code coverage by tests, which it does not want to run. Well, if he doesn’t want, then he won’t be, let a professional in his field, namely NUnit himself, take up this matter. Add another project to our long-suffering solution, this time of the Test Project type, and call it, say, NUnitProxy. The studio will automatically put the UnitTest1.cs file in it, which we, with a clear conscience, will delete and add the Generic Test instead. In the first field of test settings, we need to specify the full path to nunit-console-x86.exe (note that x86 is important), and in the second field we will write the full path to the assembly with tests (in our case, this is the TestAssembly project). The main thing - do not forget the quotation marks.
Now let's go to the Solution Items folder, which magically materialized in the solution after adding the NUnitProxy project, and double-click on the Local.testsettings file.
The Test Settings dialog opens, in which we need to go to the Data and Diagnostics tab, check the Code Coverage checkbox and click the Configure button. You will see the Code Coverage Detail window, designed to select assemblies for which Visual Studio will collect code coverage data. Here is another small nuance: if you browse the assembly, which lies in the \ bin \ Debug \ folder of the tested project, then the result of the analysis will be the enchanting emptiness of the universe. Click the Add Assembly ... button and specify the path to the assembly under test, which lies in the \ bin \ Debug \ folder of the project with tests (in our case TestAssembly). Make sure that the Instrument assemblies in place checkbox is selected, and with a calm soul, click OK, Apply and Close.
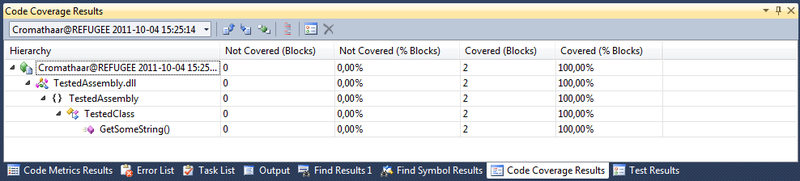
That's all. Visual Studio sees our proxy test, run it, watch the NUnit console open, and upon completion of the test run we head to the Code Coverage tab, where we see quite expressive results.
Well, lastly, two tablespoons of tar in a barrel of honey. Firstly, Visual Studio is not able to instrument x64 assemblies with all the consequences: if you want Code Coverage - recompile for x86 (Any CPU also works). Secondly, if the code in the assembly is not covered at all, then this assembly will not be included in the final report (you can experiment by commenting out the body of the GetSomeStringTest method), which, as you know, in certain situations can lead to an incorrect value of the final coverage (when they are collected data for multiple assemblies).