We go around other people's brakes
I backed up the message history from Skype with a self-written utility, a year ago it worked fine, and now it has become fiercely slow. This is unacceptable, maybe. including for the sake of export speed, it was written, so I climbed into the profiler. As a result, he learned everything and received multiple enlightenments. It turns out that you have to set a breakpoint on a function in a loaded system DLL with a sub-envelope, and not just by name, but it can be easy. It turns out that the Skype API is written in places brutally crooked, which is why the brakes. It turns out that foreign binaries can sometimes be very easy to poke and optimize (the glory of MS Research!). It turns out that the profiler can lie a lot, and not just lightly chop it. Keywords for the impatient: C ++, VS, CodeAnalyst, Skype COM API, MS Research, Detours, SQLite; and for everyone else, the details are under the cut.
In short, the background. About a year and a half ago, I wanted to export Skype logs in a text format that was convenient for me personally (almost cut / paste from the chat, with tiny improvements). All found utilities for export did not suit anything. Or they brutally braked (because there are a little less than 300 contacts and a little more than 360,000 messages in the logs); Either wrote logs in an uncomfortable format; either all these troubles at once; either stupidly did not work, etc. I decided to write my own, it turned out. At first I tried the Skype API bindings for Python, it turned out to be slow. Then I tried Skype4COM and C ++, it turned out much faster. The result is a pretty quick utility for exporting logs. Hardcore, console and in C ++, of course.
Once again I remembered about backups a couple of weeks ago, launched a proven utility and ... I realized that I couldn’t wait for the end. Exports, which used to take several minutes, advanced about 10% in about half an hour, totaling ETA about 5 hours. Unacceptably long. What's up ?!
We slightly correct the utility, limit the number of chats exported (as I understand it, Skype for some reason breaks individual communication sessions with the same contacts into separate so-called chats, IChat), we note the base time. Then we launch the profiler, fortunately, CodeAnalyst is now integrated into Visual Studio and launches in just 2-3 clicks. And carefully look at the results.
The profile looks curly, 81% of the process time is consumed by kernelbase.dll, another 12% skype4com.dll, you can’t even see the program itself. Cheating! It’s not my code that slows down (which is easy to edit), but some kind of third-party one. But which one?
Confidently win the functions InternalLcidToName, LCMapStringEx, NlsValidateLocale. Who are all these people? I do not call anything like this from my code. So I’m not calling. So, you need to find out where they are called from, and then it will probably become clear why, and what can be done about it. We need to put a breakpoint on the top function InternalLcidToName, see the stack. Oops, a problem. Stupidly by the name of the function of the breaker is not put. How to be
I know two options, but there are probably even more. First, since the whole function in the profile is top-end, then we just accidentally interrupt the execution several times, we will definitely get into it. Secondly, by slightly googling, I can find the magic line {,, KernelBase.dll} @ InternalLcidToName @ 8 - it turns out that the desired character is called that way, with dogs and a number. Running a bit ahead, the digits are always a multiple of 4, and generally look a lot like the size of the stack, and instead of the leading dog, underscores are typical for “public” characters. Having noticed this, the exact rules of mangling are much longer to look for, study and apply than to sort out a couple of options (dog / underscore, 4/8/12/16 ...), or even get into some _GetStringTypeW @ 16 s the first shot. Well, returning from the near future to the urgent InternalLcidToName, having repeatedly poked F5 and typing statistics, two amusing things become visible. The first thing is that the stack of most calls looks like this.
The second, that repeatedly executed code looks like this. At the same time, it always walks along the same codepath. Those. all three of our top profile features come down to one, _LCMapStringW. Unlike the other two, internal, this function is a part of the public interface and is described in MSDN, Google instantly finds the link msdn.microsoft.com/en-us/library/dd318700%28v=vs.85%29.aspx - it turns out for some reason this conversion of lines from one locale to another eats, if not into itself.
Well, put the next break (the symbol _LCMapStringW @ 24 is visible immediately on the stack, conveniently) and a few more in the program, and look at two things. Which, in fact, an API call leads to a call to this most expensive LCMapString (for this, breaks in the program). And which parameters are ultimately transferred (for this breakdown to the function itself). Having stepped through the function several times, it is clear that the code always follows this path: Correspondingly, all the parameters are seen very clearly; here they all are pushed onto the stack (in reverse order). The results of their careful examination, however, at first simply shock, and then cause involuntary dropping of the jaw and uncontrolled leakage of foam from the mouth. It turns out that for each (each) call to the IChatMessage :: GetBody method, the following happens.
First, the data # APPLICATIONCALLCHATMESSAGECHATMEMBERCHATGROUPSMSUSERVOICEMAIL #, with the only LCMAP_LOWERCASE flag (“make lowercase based on the locale”) arrives in the LCMapStringEx function, while the locale is en-US. It may be that the other machine will have a different one (I have the interface language of Windows specifically en-US), but it doesn’t matter for converting ordinary Latin letters to lower case. That's just this data arrives not in one long line, and not even in a few short lines, but ... one character at a time .
Then, apparently, the Hindu who wrote this frenzy begins to suspect something was wrong, what if you have to bring another protocol command to lower case, and we have brakes and a bunch of siskolls? Therefore, a brilliant preventive optimization. And the whole table from 0 to 255 inclusively arrives in the LCMapStringEx function, again, one byte per call. And just in case, this is done 2 more times in a row.
Then brilliant optimization continues. (Or maybe it’s just done by another Indian in another place in the code.) And again, the whole table from 0 to 255 flies into the function! But each byte is now repeated in a row 3 times. I personally think this approach is more correct than the previous one, of course. Two chronometers cannot be taken at sea; one or three must be taken.
In total, more than 1000 LCMapStringEx calls for each [censored] attempt to take the text of 1 (one) message, each call is made on a line exactly 1 byte in size. Through this, 5000 takes of the message text takes 5-10 seconds of the CPU. It does not depend on the version of Skype COM API that two years ago, that the current one slows down equally.
Fuck, fuck inside the Skype API. It feels like writing strong professionals.
The problem is clear, what to do? Ideally, these calls should be eliminated altogether, but patching skype4com.dll in an unknown number of places is lazy (who knows how many different points this LCMapString is pulled from), and secondly it is fraught (who knows what bugs will suddenly lead to). It begs to replace the function itself and make a quick exit from it for the very case of a call with 1 byte. A simple technique has long been known: take the address of a function in memory, put jmp there on your function, from your own, if necessary, execute the instructions that were jammed at the beginning and jmp-thread back to the original one. However, the technique is tedious and it is a little lazy to cut it with assembler pens.
It turns out that it is no longer necessary! MS Research already thought and did everything for us. In nature, there is a library called Detours, which can do just that and all else. You can, for example, replace a function in some third-party .exe without modifying it at all, push your implementation on the fly from your DLL. Well, for my utility, Detours provides a simple and intuitive C / C ++ interface for the necessary substitution, an example with the name simple.cpp is more than enough. We hook the subsistence minimum into the project (detours.h, syelog.lib, detoured.lib, detours.lib), add 20 lines of code, and ... Total shortening the idiotic and generally unnecessary (!) Byte translation of everything into lower case using a system call, accelerated the program 3.1 times overall. Not bad, not bad. We look in the profile further!

The picture has changed dramatically. Now KernelBase.dll eats only 20%, the rest is carried out in the unknown wilds of skype4com.dll, which you can’t take so easily. However, it clearly begs to check the situation with the GetDriveType call. This function determines the type of disk (removable, non-removable, CD-ROM, RAM, or network), if it is also called thousands of times, it begs to cache the result. Here we are waiting for another small discovery.
It turns out that the profiler is lying and quite noticeable. The function _GetDriveTypeW is called 1 (one) time for the entire duration of the program. In the profile, it reflects quite noticeably, even if you export 1000 chats, and not 100, but it does not really eat time.
However, the profiler does not lie about _GetStringTypeW. Having done some simple manipulations similar to _LCMapStringW call analysis, we find out that during the export, its parent function GetStringTypeEx is also constantly pulled for every byte from 0 to 255 (who would doubt it). By intercepting GetStringTypeEx and returning the results for a single-byte case from the cache of another 20 lines, we get another 15% acceleration, but only 3.6 times.
Interestingly, after this optimization, KernelBase.dll disappears from the profile altogether. 62% of the remaining time is consumed by skype4com.dll, another 12% uses ntdll.dll (for allocations and critical sections), the program itself eats about 8%, and then any systemic stuff. It is felt that the potential for optimization is 3-5 times quite present, however, it is quick to deal with what is happening with the names of the function and the documentation for them on MSDN, and there is no hotspot to disassemble the gutter skype4com.dll. And the export of the treasured 360 thousand messages already takes less than 10 minutes, which is acceptable.
A short technical summary seems to have already been summarized at the beginning of the article. Around are living people, including in eminent companies such as Skype, and in some places they write code ... like living people. Sometimes the situation can still be corrected with minimal effort, even if it slows down in a third-party library, for which there are no sources. It took me just a couple of hours to investigate the brakes and optimize, including mastering the Detours (the first time I saw it and tried it). I am afraid that it took more to prepare the notes. A powerful tool, when used correctly, it can clearly do small miracles.
... and Skype, by the way, stores the message logs in a regular SQLite database, which is successfully opened and managed by SQLite Browser using the usual SQL syntax. Clear history for one contact selectively? You are welcome. For everyone, to the right depth (what does Skype itself when changing settings do not)? Easy. Optimize stripped base? Again one click. But this is another, not at all C ++ - naya story;)
Successful optimizations to you.
In short, the background. About a year and a half ago, I wanted to export Skype logs in a text format that was convenient for me personally (almost cut / paste from the chat, with tiny improvements). All found utilities for export did not suit anything. Or they brutally braked (because there are a little less than 300 contacts and a little more than 360,000 messages in the logs); Either wrote logs in an uncomfortable format; either all these troubles at once; either stupidly did not work, etc. I decided to write my own, it turned out. At first I tried the Skype API bindings for Python, it turned out to be slow. Then I tried Skype4COM and C ++, it turned out much faster. The result is a pretty quick utility for exporting logs. Hardcore, console and in C ++, of course.
Once again I remembered about backups a couple of weeks ago, launched a proven utility and ... I realized that I couldn’t wait for the end. Exports, which used to take several minutes, advanced about 10% in about half an hour, totaling ETA about 5 hours. Unacceptably long. What's up ?!
We slightly correct the utility, limit the number of chats exported (as I understand it, Skype for some reason breaks individual communication sessions with the same contacts into separate so-called chats, IChat), we note the base time. Then we launch the profiler, fortunately, CodeAnalyst is now integrated into Visual Studio and launches in just 2-3 clicks. And carefully look at the results.
exporting chat 100/7014...
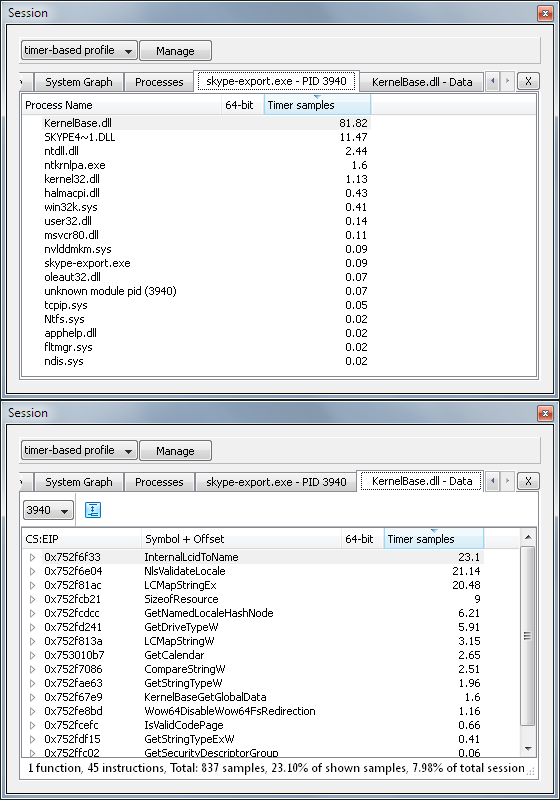
exported 3925 events in 18.1 secThe profile looks curly, 81% of the process time is consumed by kernelbase.dll, another 12% skype4com.dll, you can’t even see the program itself. Cheating! It’s not my code that slows down (which is easy to edit), but some kind of third-party one. But which one?
Confidently win the functions InternalLcidToName, LCMapStringEx, NlsValidateLocale. Who are all these people? I do not call anything like this from my code. So I’m not calling. So, you need to find out where they are called from, and then it will probably become clear why, and what can be done about it. We need to put a breakpoint on the top function InternalLcidToName, see the stack. Oops, a problem. Stupidly by the name of the function of the breaker is not put. How to be
I know two options, but there are probably even more. First, since the whole function in the profile is top-end, then we just accidentally interrupt the execution several times, we will definitely get into it. Secondly, by slightly googling, I can find the magic line {,, KernelBase.dll} @ InternalLcidToName @ 8 - it turns out that the desired character is called that way, with dogs and a number. Running a bit ahead, the digits are always a multiple of 4, and generally look a lot like the size of the stack, and instead of the leading dog, underscores are typical for “public” characters. Having noticed this, the exact rules of mangling are much longer to look for, study and apply than to sort out a couple of options (dog / underscore, 4/8/12/16 ...), or even get into some _GetStringTypeW @ 16 s the first shot. Well, returning from the near future to the urgent InternalLcidToName, having repeatedly poked F5 and typing statistics, two amusing things become visible. The first thing is that the stack of most calls looks like this.
KernelBase.dll!@InternalLcidToName@8()

KernelBase.dll!_LCMapStringW@24() + 0x46 bytes

Skype4COM.dll!280c69f2()

// тут еще много строк про дебри Skype4COM.dll

// и только про них, стека самой программы не видно
The second, that repeatedly executed code looks like this. At the same time, it always walks along the same codepath. Those. all three of our top profile features come down to one, _LCMapStringW. Unlike the other two, internal, this function is a part of the public interface and is described in MSDN, Google instantly finds the link msdn.microsoft.com/en-us/library/dd318700%28v=vs.85%29.aspx - it turns out for some reason this conversion of lines from one locale to another eats, if not into itself.
@InternalLcidToName@8:

752F6F33 mov edi,edi

752F6F35 push ebp

752F6F36 mov ebp,esp

752F6F38 push ecx

752F6F39 push edx

752F6F3A lea eax,[ebp-4]

752F6F3D push eax

752F6F3E mov dword ptr [ebp-4],ecx

752F6F41 call _NlsValidateLocale@8 (752F6E04h)

752F6F46 test eax,eax

752F6F48 je @InternalLcidToName@8+17h (7531BAB0h)

752F6F4E push eax

752F6F4F call _LocaleNameFromHash@4 (752F6F13h)

752F6F54 leave

752F6F55 ret
Well, put the next break (the symbol _LCMapStringW @ 24 is visible immediately on the stack, conveniently) and a few more in the program, and look at two things. Which, in fact, an API call leads to a call to this most expensive LCMapString (for this, breaks in the program). And which parameters are ultimately transferred (for this breakdown to the function itself). Having stepped through the function several times, it is clear that the code always follows this path: Correspondingly, all the parameters are seen very clearly; here they all are pushed onto the stack (in reverse order). The results of their careful examination, however, at first simply shock, and then cause involuntary dropping of the jaw and uncontrolled leakage of foam from the mouth. It turns out that for each (each) call to the IChatMessage :: GetBody method, the following happens.
752F8188 push 0

752F818A push 0

752F818C push 0

752F818E push dword ptr [ebp+1Ch]

752F8191 push dword ptr [ebp+18h]

752F8194 push dword ptr [ebp+14h]

752F8197 push dword ptr [ebp+10h]

752F819A push dword ptr [ebp+0Ch]

752F819D push eax

752F819E call _LCMapStringEx@36 (752F81ACh)
First, the data # APPLICATIONCALLCHATMESSAGECHATMEMBERCHATGROUPSMSUSERVOICEMAIL #, with the only LCMAP_LOWERCASE flag (“make lowercase based on the locale”) arrives in the LCMapStringEx function, while the locale is en-US. It may be that the other machine will have a different one (I have the interface language of Windows specifically en-US), but it doesn’t matter for converting ordinary Latin letters to lower case. That's just this data arrives not in one long line, and not even in a few short lines, but ... one character at a time .
Then, apparently, the Hindu who wrote this frenzy begins to suspect something was wrong, what if you have to bring another protocol command to lower case, and we have brakes and a bunch of siskolls? Therefore, a brilliant preventive optimization. And the whole table from 0 to 255 inclusively arrives in the LCMapStringEx function, again, one byte per call. And just in case, this is done 2 more times in a row.
Then brilliant optimization continues. (Or maybe it’s just done by another Indian in another place in the code.) And again, the whole table from 0 to 255 flies into the function! But each byte is now repeated in a row 3 times. I personally think this approach is more correct than the previous one, of course. Two chronometers cannot be taken at sea; one or three must be taken.
In total, more than 1000 LCMapStringEx calls for each [censored] attempt to take the text of 1 (one) message, each call is made on a line exactly 1 byte in size. Through this, 5000 takes of the message text takes 5-10 seconds of the CPU. It does not depend on the version of Skype COM API that two years ago, that the current one slows down equally.
Fuck, fuck inside the Skype API. It feels like writing strong professionals.
The problem is clear, what to do? Ideally, these calls should be eliminated altogether, but patching skype4com.dll in an unknown number of places is lazy (who knows how many different points this LCMapString is pulled from), and secondly it is fraught (who knows what bugs will suddenly lead to). It begs to replace the function itself and make a quick exit from it for the very case of a call with 1 byte. A simple technique has long been known: take the address of a function in memory, put jmp there on your function, from your own, if necessary, execute the instructions that were jammed at the beginning and jmp-thread back to the original one. However, the technique is tedious and it is a little lazy to cut it with assembler pens.
It turns out that it is no longer necessary! MS Research already thought and did everything for us. In nature, there is a library called Detours, which can do just that and all else. You can, for example, replace a function in some third-party .exe without modifying it at all, push your implementation on the fly from your DLL. Well, for my utility, Detours provides a simple and intuitive C / C ++ interface for the necessary substitution, an example with the name simple.cpp is more than enough. We hook the subsistence minimum into the project (detours.h, syelog.lib, detoured.lib, detours.lib), add 20 lines of code, and ... Total shortening the idiotic and generally unnecessary (!) Byte translation of everything into lower case using a system call, accelerated the program 3.1 times overall. Not bad, not bad. We look in the profile further!
#define PROTO (LCID Locale, DWORD dwMapFlags, LPCWSTR lpSrcStr, int cchSrc, LPWSTR lpDestStr, int cchDest)

static int (WINAPI * TrueMap) PROTO = LCMapStringW;

int WINAPI MyMap PROTO

{

 if (Locale==1033 && dwMapFlags==256 && cchSrc==1)

 {

 *lpDestStr++ = *lpSrcStr++;

 *lpDestStr++ = 0;

 return 1;

 }

 return TrueMap(Locale, dwMapFlags, lpSrcStr, cchSrc, lpDestStr, cchDest);

}


// ...

 DetourRestoreAfterWith();

 DetourTransactionBegin();

 DetourUpdateThread(GetCurrentThread());

 DetourAttach(&(PVOID&)TrueMap, MyMap);

 LONG error = DetourTransactionCommit();

 if (error != NO_ERROR)

 printf ( "error detouring LCMapStringW(); export might be slower (code=%d)\n", error );


// ...


exporting chat 100/7014...

exported 3925 events in 5.8 sec
The picture has changed dramatically. Now KernelBase.dll eats only 20%, the rest is carried out in the unknown wilds of skype4com.dll, which you can’t take so easily. However, it clearly begs to check the situation with the GetDriveType call. This function determines the type of disk (removable, non-removable, CD-ROM, RAM, or network), if it is also called thousands of times, it begs to cache the result. Here we are waiting for another small discovery.
It turns out that the profiler is lying and quite noticeable. The function _GetDriveTypeW is called 1 (one) time for the entire duration of the program. In the profile, it reflects quite noticeably, even if you export 1000 chats, and not 100, but it does not really eat time.
However, the profiler does not lie about _GetStringTypeW. Having done some simple manipulations similar to _LCMapStringW call analysis, we find out that during the export, its parent function GetStringTypeEx is also constantly pulled for every byte from 0 to 255 (who would doubt it). By intercepting GetStringTypeEx and returning the results for a single-byte case from the cache of another 20 lines, we get another 15% acceleration, but only 3.6 times.
exporting chat 100/7014...

exported 3925 events in 5.0 sec
Interestingly, after this optimization, KernelBase.dll disappears from the profile altogether. 62% of the remaining time is consumed by skype4com.dll, another 12% uses ntdll.dll (for allocations and critical sections), the program itself eats about 8%, and then any systemic stuff. It is felt that the potential for optimization is 3-5 times quite present, however, it is quick to deal with what is happening with the names of the function and the documentation for them on MSDN, and there is no hotspot to disassemble the gutter skype4com.dll. And the export of the treasured 360 thousand messages already takes less than 10 minutes, which is acceptable.
A short technical summary seems to have already been summarized at the beginning of the article. Around are living people, including in eminent companies such as Skype, and in some places they write code ... like living people. Sometimes the situation can still be corrected with minimal effort, even if it slows down in a third-party library, for which there are no sources. It took me just a couple of hours to investigate the brakes and optimize, including mastering the Detours (the first time I saw it and tried it). I am afraid that it took more to prepare the notes. A powerful tool, when used correctly, it can clearly do small miracles.
... and Skype, by the way, stores the message logs in a regular SQLite database, which is successfully opened and managed by SQLite Browser using the usual SQL syntax. Clear history for one contact selectively? You are welcome. For everyone, to the right depth (what does Skype itself when changing settings do not)? Easy. Optimize stripped base? Again one click. But this is another, not at all C ++ - naya story;)
Successful optimizations to you.