Visual Studio 2010: working with the new profiler
- Transfer
 I’ve already been able to demonstrate how the new summary page of the profiler makes it easier to find and fix performance problems, but sometimes it takes more effort to search. This time I will delve deeper in my story into another feature of VS2010, which is called Function Details View.
 Again, for demonstration, I will use the PeopleTrax application, which you can download from CodeBox . I have a report that I collected earlier using the CPU Sampling function in the profiler, in which the application heavily loads the CPU (at least on one core).
In this report, I look at the Hot Path and see that the People.GetNames method calls the two hot functions StringReader.ReadLine () and String.Trim ().

I want to see these resource-intensive calls in my code, so I click on GetNames (highlighted in purple above) to display a window with the details of the function.
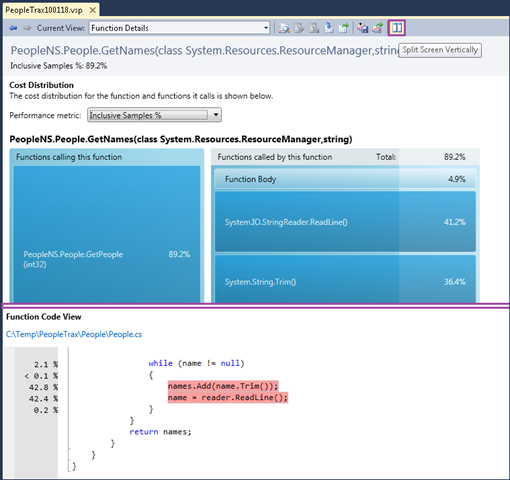
There are a few things worth paying attention to:
- the title indicates the name of the People.GetNames () method;
- using the drop-down menu, you can switch between "Inclusive Samples%" and "Inclusive Samples";
- blue dice show functions that call the People.GetNames () method or are called by it;
- The code that interests me is shown with highlighting and annotation;
- in the default view, we may need to expand the window to see all the code. Instead, you can use the Split Screen Vertically button and change the view.
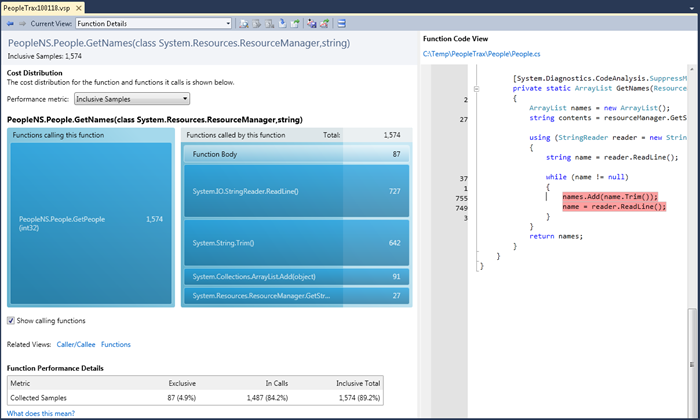
Now, on the right side of the view, we clearly see where the resource-intensive calls to the ReadLine () and Trim () functions occur in our code. In addition, we have a metric table in the Function Performance Details section and some useful links on the topic.
Now, let's take a look at the blue dice. The left plate shows the methods that call our function. Plate height represents the relative value in the currently selected metric (in this case, Inclusive Samples). Since in this case there is only one calling method, it takes up the entire area of the plate.
On the right is another die, which contains the following sections:
- Function Body (87 copies). The height of this section shows the relative number of instances within the function itself.
- ReadLine (727 copies). This is the function with the largest number of instances (Inclusive Samples). Because of this, the height of this section is the largest.
- Trim (642 copies). The function is the second by the number of instances (Inclusive Samples). Slightly lower section height.
- and other functions with fewer instances.
Having studied the code, I cannot find a simple solution to simplify it, I can not control the operation of Trim () or ReadLine (), so let's go one level higher in the calling functions by clicking on GetPeople (this is the only function that calls our GetNames method - approx. Transl.).
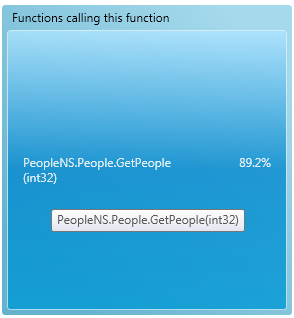
Clicking on GetPeople leads to the transition to details for this function:

From the code on the right side, we can find out that the two highlighted calls to the GetNames method form 89.2% of calls (instances). Because the loop is being used, it is probably a better idea to get GetNames calls out of the loop. Those who study the PeopleTrax application know that the first optimization for this application is to cache the GetNames call in the constructor. The next step in the research will be to change the code, collect new profiling information and compare reports, but I will leave this for you.
Keep in mind: code line level information is only available in CPU Sampling profiling mode and is not available in Instrumentation mode. Highlighting and annotations are also not available in Instrumentation mode.