December 25, 2009 at 22:55
Charts in Nagios - why and why
Introduction
Choosing Nagios as a monitoring system, we get a tracking system for the qualitative characteristics of the environment and a history of state changes. And, if you look at the text of the probe message at the moment and during past state changes it is still possible, then the data on the periods between the changes are absent as a class. With any more or less active work with monitoring, there is a desire to view the history of changes in quantitative characteristics, too, which the standard Nagios can not provide. You can, of course, duplicate all the necessary probes in the same Cacti, but this is at least an additional overhead for both configuring and for a car with a poller. Fortunately, Nagios is able to pass this on to the shoulders of the user, providing a mechanism for the so-called “performance data”.
Performance data
The state of the probe supplemented by performance data looks something like this:

The delivery method and data requirements are detailed in the documentation , but in this case it is important for us that Nagios can both take data from the plug-in output and give it to some external utilities, because there is additional lines in the web interface, although it brings a certain variety, but it brings a little benefit :).
External utilities
Utilities for processing performance data [and turning them into graphs] listed only on exchange.nagios.org/directory/Addons/Graphing-and-Trending about 20. Despite what they seem to do the same thing, they are still different. When I chose the tool for myself, I was guided by the following list of characteristics:
- Interface. Apart from the jokes - look at what is listed on the Graphing-and-Trending list of add-ons - almost everyone looks pale, if not wretched. After Cacti, I wanted at least the opportunity to make Zoom graphics. Well, the chart display templates.
- A way of storing statistics - it could have been in the first place if it weren’t for the almost universal enthusiasm for RRD, among which www.opmon.org/documentation stands out , stores data in a Mysql database, I didn’t look at it further, Zabbix had enough of it storing data in the database.
- Configuration management - after XML, Cacti wanted something human.
Pnp4nagios
Consider what Pnp4nagios offers us.
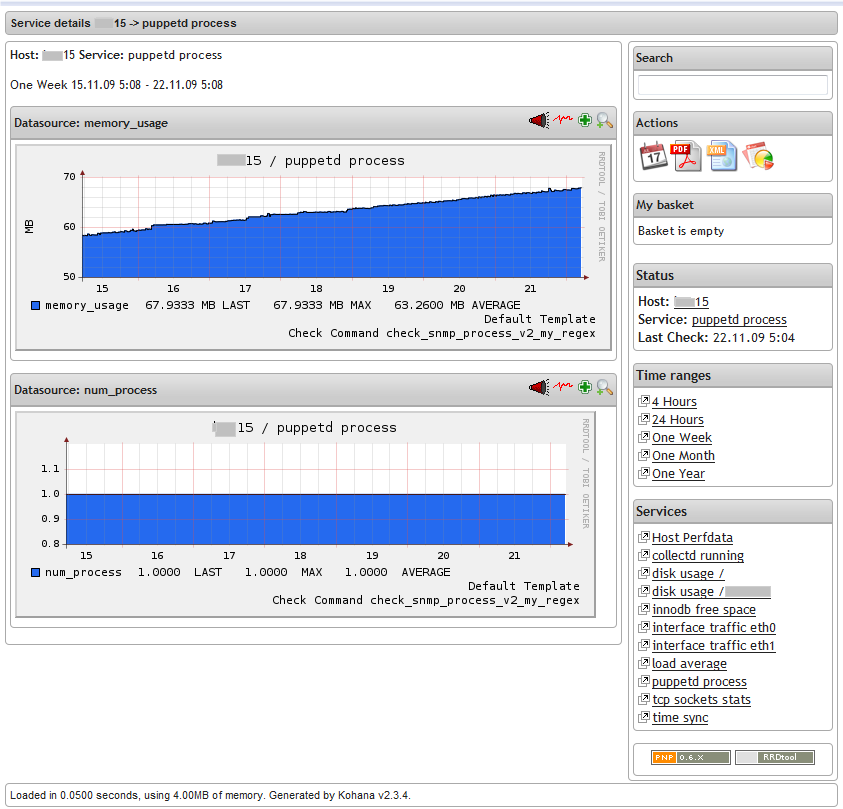
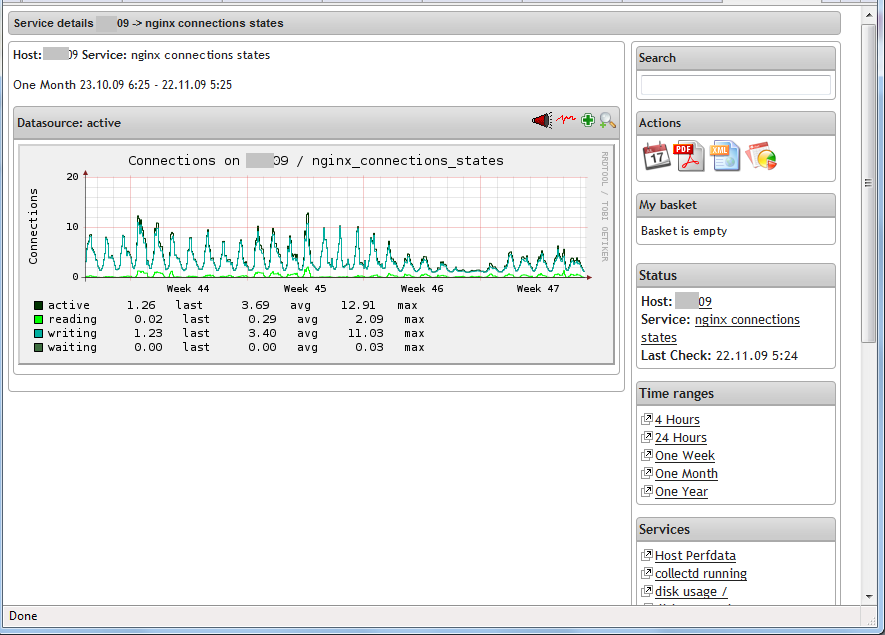
- Interface. A simple comparison of Pnp4Nagios screenshots with NagiosGrapher'ovskie, clearly not in favor of the latter.
pnp4nagios 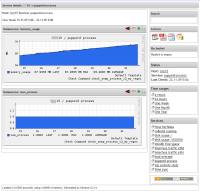

NagiosGraph 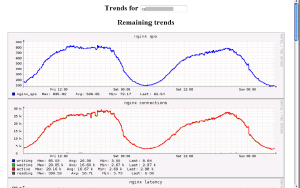
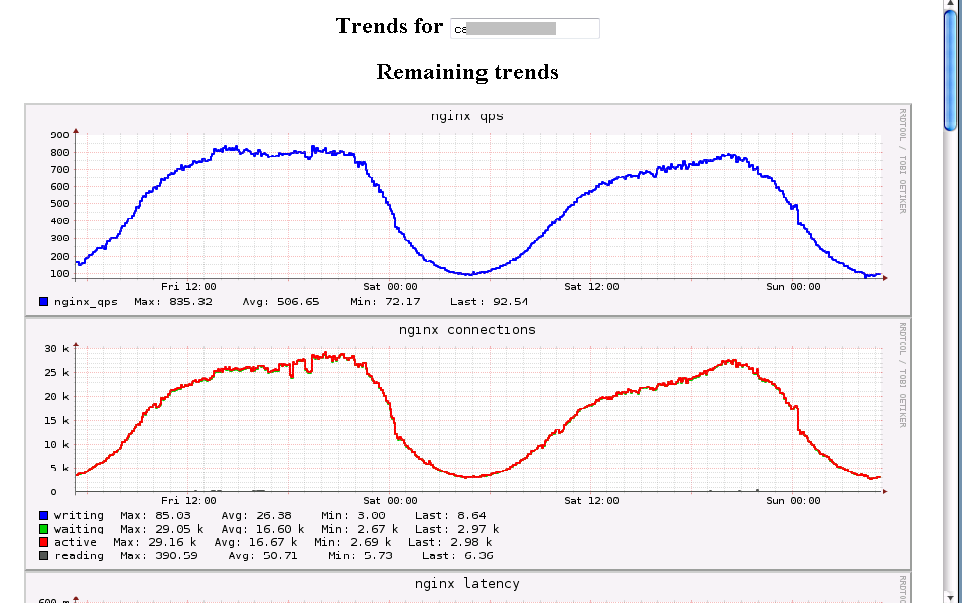
In particular, in Pnp4Nagios you can make an approximation, view graphs for specified periods, including the choice of the date range in the calendar; export the chart as a pdf file, the file can be sent accordingly without suffering the insertion of pictures in the letter; add a schedule to the "basket" for a quick transition in the future; go to the list of alerts in Nagios for the selected period of time. In addition to this, there is a means of grouping charts from different hosts - the so-called "pages". Localization is supported, which, however, is not a fact, which is a plus :) - A method of storing statistics.
There’s nothing to focus on, unless Pnp4Nagios supports RRDCached - it’s useful in large installations. The benefits of RRDCached and iohell are detailed here. - Configuration.
Configuring Pnp4Nagios, of course, is not as flexible as that of the same Zabbix, but OOM-Killer does not come;)
The most noticeable part, the appearance of the charts, is determined by the patterns. The kit comes with a number of standard templates. For your own checks, you can make a separate template if the standard does not suit you. Templates are php scripts executed via include and in essence should form a command line for rrdtool. During template processing, internal data exported by Nagios is available, for example, the time the host was last alive ($ LASTHOSTUP $), which allows you to display graphs of almost any informational content. Templates are determined from the name of the command, and the selection of a significant part is supported, i.e. if you have checks using check_nrpe, then you can configure the selection of the template so that check_nrpe will be discarded.
The parameters specified when creating rrd files can also be changed in the templates. Supported options include data type (datasource) - GAUGE, COUNTER, DERIVE; use restrictions on the minimum and / or maximum value, which is useful for eliminating prominences for counters like COUNTER / DERIVE in case of server reboot / restart of the daemon.
Data processing
3 types of processing performance data are supported:
- Synchronous mode. The data processing command process_perfdata.pl is called for each check. The easiest to configure (edit 4 lines :) but also the “worst” one - until this script finishes, Nagios will be blocked, which with a large number of checks can become noticeable due to the disk subsystem. For example, on an unloaded host you can observe:
At first glance, 3 milliseconds is very small, but keep in mind that file I / O goes to vmcache which is enough to hold rrd files because there are only 28 of them.
2009-12-23 20:41:54 [28100] [2] RRDs::update /var/lib/pnp4nagios/nginx.local/load_average.rrd 1261590114:0.00:0.00:0.00

2009-12-23 20:41:54 [28100] [2] /var/lib/pnp4nagios/nginx.local/load_average.rrd updated

2009-12-23 20:41:54 [28100] [1] PNP exiting (runtime 0.003274s) ... - Scope mode. Nagios writes data to a file and, with a certain frequency, calls the script process_perfdata.pl, which reads and processes the entire file, which is much faster than synchronous mode, but it is possible to lock Nagios for a slightly longer period. Example:
One tenth of a second is already more noticeable, but still fast, since in this case there is still enough vmcache (491 rrd files).
2009-12-23 20:28:11 [7299] [1] 83 Lines processed

2009-12-23 20:28:11 [7299] [1] /var/spool/pnp4nagios/service-perfdata-PID-7299 deleted

2009-12-23 20:28:11 [7299] [1] PNP exiting (runtime 0.118031s) ... - “Skopom”, but with a separate daemon, it’s almost like the second method, but instead of calling our handler, Nagios will transfer files and calm down, and a separately working daemon will check the desired folder with some periodicity and run process_perfdata.pl if files are found. Since transferring files within the same file system is almost instantaneous, this method does not block Nagios and can be recommended for busy environments.
Integration with the web interface Nagios
Integration into Nagios web interface can be done using action_url for hosts and services, which allows a) go to view the graphs in one click 2) you can watch thumbnails of the graphs just by hovering over
Minuses
- The first minus is standard for everyone? RRD-based systems - there is no flexible management of a set of graphs and templates for their display. Editing templates in php, although not difficult, but there are ways to spend time with greater benefit.
- Nagios plugins should support the output of performance data, which not everyone has. For plugins that check “counters” (for example, traffic on the interface), it is very desirable to support the output of the minimum / maximum permissible value in the performance data line, otherwise the rrd database will be created without restrictions and there will be “prominences” when the counter is reset.
- Not that direct, but minus, partially arising from the first - Nagios / Pnp4Nagios is not a substitute for the collection of statistics on the state of the system. That I can claim this role I will write separately.
References:
Project site - contains fairly clear documentation and instructions for installation and configuration. When installing from a package, just follow the instructions from /usr/share/doc/pnp4nagios/README.Debian.gz.
Access to the
Debian source code pnp4nagios package is available in my repository http://repo.coolcold.org .
IRC: # pnp4nagios @ freenode