School project: air quality
The beginning of the school year - it's time to talk about the air in schools. Once, on a wave of nostalgia, we recalled our school years. Satchels, uniforms, a portrait of Pushkin, buns in the dining room, a disco in the gym, “a forest of hands”. And stuffiness in the classrooms, dust on the windowsills, a strict ban on opening the vents ... In short, the air quality is mediocre, if not worse. We wondered if something has changed since we were children. Then we went to eight Novosibirsk schools and conducted an experiment, from which we learned a lot of important things. And now, at the beginning of the school year, they remembered him and decided to share with you.

Last year we conducted a study of the microclimate in one of the schools and wrote an article about it . Then, the Testo 480 sensor was used as the main instrument and the data were recorded only on the level of carbon dioxide in a Moscow school. In this study, we increased the number of schools to eight, and the measured parameters - to three: the level of carbon dioxide, humidity and temperature.
Before turning to the experience itself and its results, we turn to the theory. What should be the microclimate in school, what are the standards and what research has already been conducted in this area? If this data is already known to you, go directly to the description of the experience and results.
We were not the first to be puzzled by the question of the school microclimate in general and its influence on a person. In 2015, the World Health Organization called the air quality in many European schools and kindergartens unfavorable (the news can be read here ) and offered its own solutions to this problem. In addition, there have already been some interesting studies around the world on this topic.
European Union. Scientists investigated the state and well-being of schoolchildren in rooms with a carbon dioxide level of more than 1,000 ppm. Results: children who are in such rooms regularly and for a long time, 3.5 times more often suffer from dry cough and 2 times more often suffer from rhinitis.
Korea.In 110 houses in Seoul, CO, NO levels, house dust mites, cockroaches, mold fungus and CO2 spores were measured. In total, 181 children younger than 14 years old with diagnosed asthma lived in the study rooms. One of the main findings of Koreans: an increase in carbon dioxide levels increases the likelihood of an asthma attack.
USA.The Berkeley Institute investigated the relationship between carbon dioxide levels and productivity. Objective: to evaluate the effect of CO2 on decision-making mechanisms. The test subjects were 22 people who were subjected to 2.5-hour carbon dioxide intoxication at concentrations of 600, 1 000 and 2 500 ppm. During the study, subjects underwent computer tests that required decision making. The results at the level of 600 ppm were considered baseline, when reaching 1,000 ppm, labor productivity decreased by six out of nine indicators, while the level was 2,500 ppm - by seven. Thus, the direct relationship between air quality and labor productivity has been proven. Although the findings of scientists still need further confirmation, the data from this experience is already quite enough to understand
What is in Russia? To date, we, unfortunately, have not managed to find a single serious scientific study of air quality in Russian schools. If you know such work, we will be glad to see it in the comments.
In most European countries, there are now clear microclimate standards for educational classes, based, among other things, on preliminary studies of the effect of carbon dioxide on the human body. As such, the microclimate standards for schools in Russia does not exist. However, in our state there is one very entertaining document - “GOST 30494-2011. Residential and public buildings. The parameters of the microclimate in the premises . It spelled out the norms and standards that must meet the air in the premises.
Standards of CO2 concentration in this GOST indicate the permissible content of carbon dioxide in excess of its amount in the outside air. For ease of perception, we immediately recalculated the standards, taking 400 ppm of carbon dioxide in the street for the default value (by the way, this level reached atmospheric CO2 last fall, to which a separate article in GeekTimes was devoted ). The permissible CO2 content according to GOST for premises in which people are engaged in intellectual work or study (these include school classes) is 400–600 ppm above the CO2 level in the outdoor air. By simple calculations, we calculate that the maximum allowable carbon dioxide content in the classrooms is 800-1,000 ppm. We made a “concession” and took the upper limit as the norm - 1,000 ppm.
As for the temperature, the same GOST states that in the premises for training sessions the optimum temperature is 20–22 in the cold season and 22–25 in the warm season. The data for the experiment were collected in the cold season, so we took the “winter” standard of 22 за as the norm.
The level of humidity is most dependent on the climate of the city, and in Novosibirsk the air is dry. Therefore, in our studies we take as a point of reference the minimum allowed in GOST: the norm for the cold season is from 30%, the warm one from 40% (we were guided by 30%).
All of the above standards during the study were considered as the norm and became the starting point for discussing the results of our experiment.
Eight schools and gymnasiums in different districts of Novosibirsk were chosen as testing grounds. School microclimate parameters were monitored using MagicAir smart microclimate base stations with integrated carbon dioxide, temperature, and humidity sensors. Base stations were installed in 13 offices, where all classes for five school days from Monday to Friday were held according to the usual schedule. The central ventilation in the schools was either absent (5 schools), or was turned off due to the strong noise that interferes with the pupils during the lessons (2 schools), or turned on only at recess (1 school). All data on the level of carbon dioxide, temperature and humidity in the offices came to the cloud server online.
The total amount of data obtained from the studied sites is in the hundreds of numbers and graphs. For clarity, we will start to look at the results using the example of one day in the same classroom of one school. Let's designate it as “School 1”. To understand the picture, we combined graphs of changes in carbon dioxide levels, humidity and temperature, and the school schedule.
Charts 1-3 below the numbers in the circles indicate the numbers of lessons, six lessons in each of the two shifts. Lessons start at 8:00 and last 45 minutes each, between them there are changes of 10 or 20 minutes. Between shifts - a break of 10 minutes. The green line on the graphs indicates the standard values of the parameters.
All digital data are attached at the end of the article, after the list of references (see the file with the name “School1_cabinet1”).
Carbon dioxide
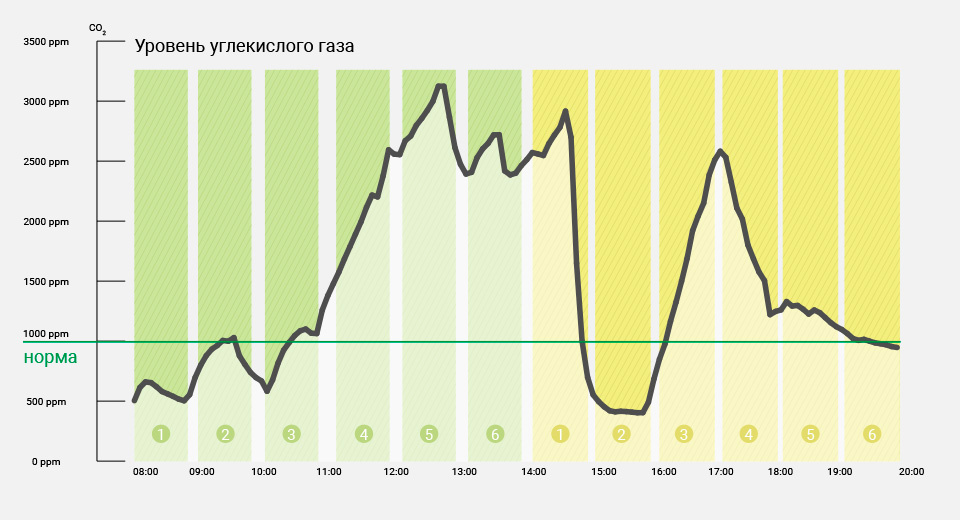
Chart 1. Carbon dioxide level during the school day, School 1, room 1
Chart 1 shows the change in carbon dioxide concentration in the classroom 1 of School 1 during one school day (from 8:00 to 20:00). The measurement error is ± 70 ppm at a concentration of not more than 2300 ppm, ± 3% at a concentration of more than 2300 ppm.
Before the start of the lessons, the level of CO2 still meets the standards, and, it would seem, with a large “margin”: at 7:30 in the air only about 430 ppm. But closer to 8 o'clock the children come to class, and the level of CO2 begins to grow steadily.
The second lesson begins at 8:55 with 770 ppm, and already after fifteen minutes the level of CO2 passes for a standard mark, exceeding 1 000 ppm. In general, it is easy to see that the concentration of CO2 exceeds the norm overwhelmingly most of the time (8.3 hours over the time period studied, that is, 69% of the time).
The most significant excess, 3,170 ppm, is recorded during the fifth lesson of the first shift.
Schedule 2, which shows the changes in air temperature in the classroom (see below), can be traced when the windows were opened: it was cold outside, so an open window invariably led to a decrease in temperature. You can, for example, notice that on the day described during the break, before the third lesson of the first shift, the office was well ventilated: the temperature dropped by almost 3 degrees, and the CO2 level dropped to 660 ppm. But at the beginning of the third lesson, the windows were closed, and the concentration of carbon dioxide began to increase again (temperature too), until it reached a critical 3,169 ppm in the fifth lesson. This is more than three times the norm. The air temperature at the same time reached the level of 29.
The effect of airing with a full class of 20-30 people disappeared in some 15-20 minutes.
A favorable period for CO2 was in the second lesson of the second shift. Such a “luck” is explained simply: first, the cabinet was aired by opening the windows. And secondly, there were no students in it, the class was empty. As soon as the students returned to the third lesson, the CO2 concentration went up again and reached 2 630 ppm (maximum in the second shift).
Air temperature
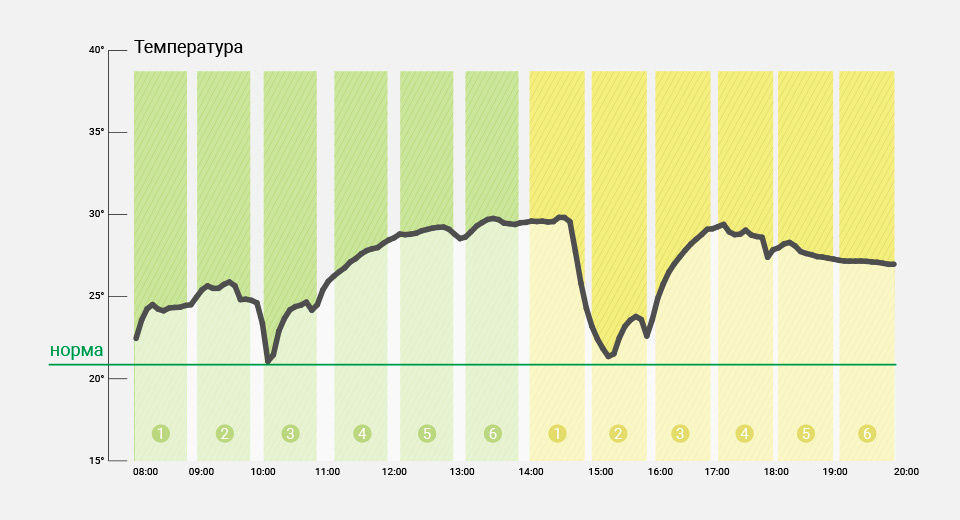
Graph 2. Air temperature during the school day, School 1, room 1
Graph 2 shows the change in air temperature in the classroom 1 of School 1 during one school day (from 8:00 to 20:00). The measurement error is ± 1.5 ° С (measurement range -10 ... + 85 ° С).
The air temperature throughout the school day exceeds the norm, reaching almost 30 ° C. The “best” result was 23 ° С, but it was achieved only for short periods of time. By changing the temperature, you can set the periods when windows were opened in the office. Due to the fact that the study was conducted during the cold season, an open window invariably led to a decrease in temperature in the office. And setting the periods of ventilation, you can compare them with a schedule of CO2. As soon as the window is closed, both the temperature and the CO2 level resume their growth.
Air humidity
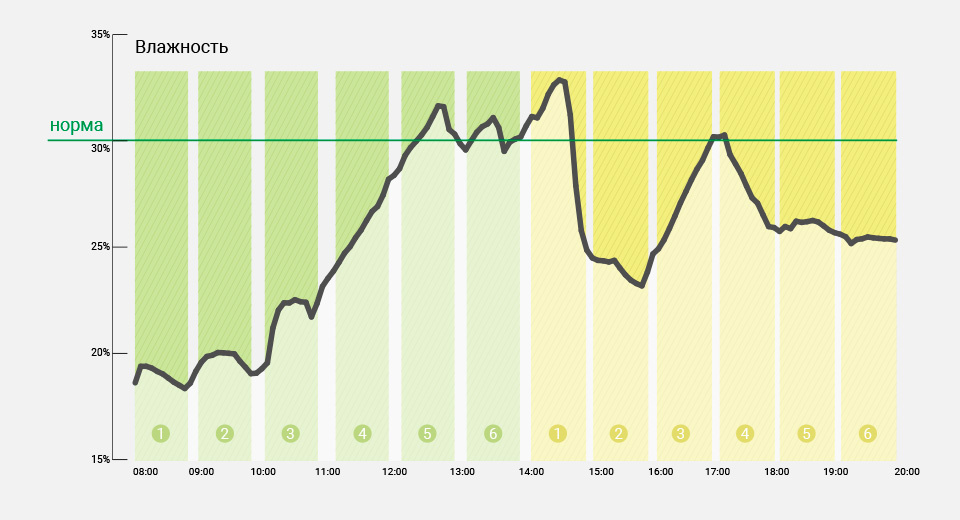
Figure 3. Air humidity during school day, School 1, room 1
Graph 3 shows the change in air humidity in the classroom 1 of School 1 during one school day (from 8:00 to 20:00). The measurement error is ± 4% (measurement range 0 ... 95%).
As you can see, humidity is also far from desired. Most of the time it is lowered and it is extremely rare to get to the standard mark - a total of normal (30% and above) humidity kept only 2.8 hours during the school day (23% of the time). And despite the fact that we took GOST 30% as the norm, and 40–60%, not recommended by many physiologists.
We can not fail to note that periods of normal humidity were accompanied by a significant increase in air temperature (28–29 ° C) and CO2 level (2 3770 - 3 170 ppm).
findings
So, on the observed school day in the study room, according to our data, the average CO2 level during the lessons was 1,250 ppm, the maximum peak value was 3,170 ppm. The average humidity level was 19%, and the average temperature was 27.
Air temperature throughout the school day exceeds the norm. Humidity, by contrast, is critically reduced. The level of carbon dioxide in the air shows a higher amplitude than the other parameters, however, it mostly exceeds the norm, sometimes moving even beyond the 3,000 ppm mark.
In general, the microclimatic parameters that are most important for comfort, well-being and full-fledged work of the brain do not meet the standards throughout either the entire study period, or most of the study period. Not a single gap was recorded, when all three parameters of the microclimate would meet the standards simultaneously.
Then we took the data for all schools, allocated intervals from 8:00 to 19:00 (during these hours most schools have lessons) on weekdays from Monday to Friday and calculated average indicators of microclimate parameters.
The picture was as follows:
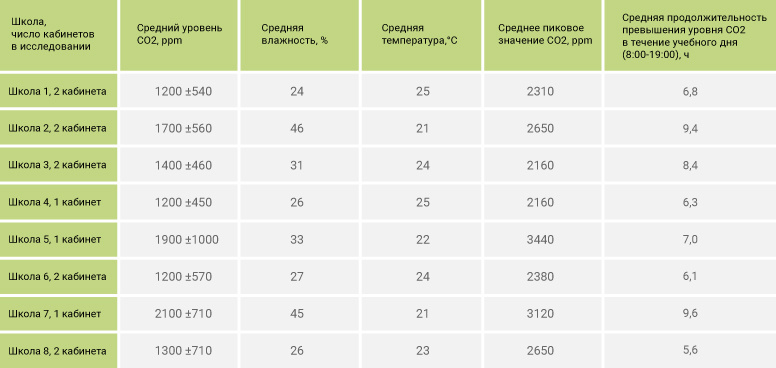
In the columns “Average CO2 Level”, “Average Humidity” and “Average Temperature” we placed the average indicators of carbon dioxide concentration, humidity and air temperature, respectively, in each studied school over the entire observation period. For the average level of CO2, we also indicated the spread of values — the average standard deviation (variance) with a level of reliability of 95%.
In the column “Average Peak CO2”, the average maximum values of carbon dioxide in each school for the entire observation period are recorded (five school days from Monday to Friday, from 8:00 to 19:00).
As you can see, the average temperature corresponds to the norm (20–22) in only three schools. The average humidity is four. But no school would pass the “CO2 test”: in all eight cases it exceeds the standard mark of 1,000 ppm, often 1.5-2 times.
Graph 4 shows the average value of CO2 in the air (data from all thirteen classrooms in eight schools are taken), as well as the average maximum and average minimum during the school day.

Chart 4. Summary of CO2 in the air for all schools
It should, however, be noted that the length of the school day differs depending on the school. Somewhere children are engaged in two shifts, but somewhere only in one, the first, so that in the second half of the day the classrooms are empty. This explains the trajectory of the lines on the right side of the graph. For example, the line of an average minimum during the second shift stably keeps within the limits of norm. But you should not be mistaken: it's not about airing at all. Just the sources of CO2 went home. In the first shift (when classes are held in all the rooms without exception), even the average minimum generally exceeds the norm.
You can orient yourself to the “Average” line in order to imagine a typical air condition on a typical school day of a typical school. Most of the time, CO2 levels are above normal. It is noticeable how the CO2 concentration demonstrates rapid growth with the onset of the lessons. Even the “fresh” early morning class at the end of the first lesson (around 9:00) becomes stuffy.
Digital data for all schools we attached at the end of this article, after the list of references.
Based on our data, we make a general conclusion that in the studied schools of Novosibirsk there is an excess of carbon dioxide during lessons, an average of 500 ppm, insufficient air humidity and too high a temperature. In other words, the microclimate in schools does not meet regulatory requirements. The condition of the air in the classrooms is not only not conducive to effective intellectual work, but also often hinders learning.
In terms of average carbon dioxide levels, no school showed a level below 1,000 ppm. And the maximum CO2 value we recorded during the experiment was 4,230 ppm! Such an excess already poses a serious health hazard.
According to the University of Middlesek researchers, obtained as a result of an experiment with a study group of 300 adults, when the carbon dioxide level reaches 800 ppm, attention decreases by 30%, and at a concentration of more than 1,500 ppm, 79% of the participants experienced fatigue and headache. In addition, in the study of another scientist from the UK, D.S.
Roberts, fatigue and loss of concentration are observed already at a carbon dioxide level of 600 ppm and increase as the amount of CO2 increases. Based on the results of these experiments and other studies, it can be said that carbon dioxide directly affects the well-being (more here ), as well as the student’s progress, preventing him from concentrating and assimilating information in the lesson.
In this case, the problem of excess carbon dioxide in the air in many cases is either not recognized or ignored for various reasons (often financial). Now between the lessons are conducted for forte "micro-ventilation" or airing through the corridor, but the effect of their use disappears almost instantly with the advent of children in the classroom. It should also be noted that the ventilating airing is not carried out in every office, as often the window sills are filled with textbooks, flowers or visual materials that are necessary for training. In any case, there is now insufficient air exchange in the classes.
High temperatures and insufficient moisture are also considered unfavorable conditions for intellectual work. High temperature reduces the level of blood oxygen saturation, which, in turn, results in a feeling of weakness, lethargy, dizziness and shortness of breath are also possible. When the air temperature is about 30, sweating increases and the body's water-salt balance is disturbed. As for dry air, it affects the eyes, causing redness, dryness and contributing to their fatigue.
Since schools in different parts of the city were considered, we assume that it is possible to extrapolate the conclusions of the experiment with known assumptions to all schools of the Siberian Federal District, as well as to regions with a similar climate. However, the climatic difference between regions can affect only the temperature and humidity of the air, but not the level of CO2. Therefore, we assume that conclusions regarding the state of ventilation and carbon dioxide concentration in schools are valid for most schools throughout Russia (and maybe even around the world: it’s not for nothing that Western researchers are also concerned about this problem).
You can independently conduct a similar experiment in your city by installing a MagicAir base station at a school. Perhaps you will share the results here on GeekTimes.
We conducted a study of air quality in eight schools in Novosibirsk, measuring five main microclimate parameters every five minutes for five school days: temperature, air humidity and CO2 levels. As a result, we found that in all the schools studied, one or more of these parameters do not correspond to the norm (GOST 30494-2011). At the same time, the average concentration of CO2 in none of the eight schools is not normal.
The problem of the microclimate is relevant not only for schools, but also for kindergartens, sports clubs and various circles - in general, for all rooms where many children gather at the same time. At the same time, numerous studies prove that the state of the microclimate in these rooms, and especially the level of carbon dioxide, directly affects the state of health, concentration of attention and performance of schoolchildren.
No one will argue that good conditions are necessary in educational and training institutions so that this very upbringing and education can proceed efficiently and comfortably. But, unfortunately, still few people understand that “good conditions” are not only new desks, a projector and plastic windows, it is also a comfortable microclimate: fresh air of normal temperature and humidity.
Bibliography:
→ Experimental data
Last year we conducted a study of the microclimate in one of the schools and wrote an article about it . Then, the Testo 480 sensor was used as the main instrument and the data were recorded only on the level of carbon dioxide in a Moscow school. In this study, we increased the number of schools to eight, and the measured parameters - to three: the level of carbon dioxide, humidity and temperature.
Before turning to the experience itself and its results, we turn to the theory. What should be the microclimate in school, what are the standards and what research has already been conducted in this area? If this data is already known to you, go directly to the description of the experience and results.
Microclimate Theory: Existing Studies
We were not the first to be puzzled by the question of the school microclimate in general and its influence on a person. In 2015, the World Health Organization called the air quality in many European schools and kindergartens unfavorable (the news can be read here ) and offered its own solutions to this problem. In addition, there have already been some interesting studies around the world on this topic.
European Union. Scientists investigated the state and well-being of schoolchildren in rooms with a carbon dioxide level of more than 1,000 ppm. Results: children who are in such rooms regularly and for a long time, 3.5 times more often suffer from dry cough and 2 times more often suffer from rhinitis.
Korea.In 110 houses in Seoul, CO, NO levels, house dust mites, cockroaches, mold fungus and CO2 spores were measured. In total, 181 children younger than 14 years old with diagnosed asthma lived in the study rooms. One of the main findings of Koreans: an increase in carbon dioxide levels increases the likelihood of an asthma attack.
USA.The Berkeley Institute investigated the relationship between carbon dioxide levels and productivity. Objective: to evaluate the effect of CO2 on decision-making mechanisms. The test subjects were 22 people who were subjected to 2.5-hour carbon dioxide intoxication at concentrations of 600, 1 000 and 2 500 ppm. During the study, subjects underwent computer tests that required decision making. The results at the level of 600 ppm were considered baseline, when reaching 1,000 ppm, labor productivity decreased by six out of nine indicators, while the level was 2,500 ppm - by seven. Thus, the direct relationship between air quality and labor productivity has been proven. Although the findings of scientists still need further confirmation, the data from this experience is already quite enough to understand
What is in Russia? To date, we, unfortunately, have not managed to find a single serious scientific study of air quality in Russian schools. If you know such work, we will be glad to see it in the comments.
Fact: In Finland, an increased level of carbon dioxide is sufficient reason to close the school until the ventilation problem is resolved.
The theory of microclimate: norms and standards
In most European countries, there are now clear microclimate standards for educational classes, based, among other things, on preliminary studies of the effect of carbon dioxide on the human body. As such, the microclimate standards for schools in Russia does not exist. However, in our state there is one very entertaining document - “GOST 30494-2011. Residential and public buildings. The parameters of the microclimate in the premises . It spelled out the norms and standards that must meet the air in the premises.
Standards of CO2 concentration in this GOST indicate the permissible content of carbon dioxide in excess of its amount in the outside air. For ease of perception, we immediately recalculated the standards, taking 400 ppm of carbon dioxide in the street for the default value (by the way, this level reached atmospheric CO2 last fall, to which a separate article in GeekTimes was devoted ). The permissible CO2 content according to GOST for premises in which people are engaged in intellectual work or study (these include school classes) is 400–600 ppm above the CO2 level in the outdoor air. By simple calculations, we calculate that the maximum allowable carbon dioxide content in the classrooms is 800-1,000 ppm. We made a “concession” and took the upper limit as the norm - 1,000 ppm.
As for the temperature, the same GOST states that in the premises for training sessions the optimum temperature is 20–22 in the cold season and 22–25 in the warm season. The data for the experiment were collected in the cold season, so we took the “winter” standard of 22 за as the norm.
The level of humidity is most dependent on the climate of the city, and in Novosibirsk the air is dry. Therefore, in our studies we take as a point of reference the minimum allowed in GOST: the norm for the cold season is from 30%, the warm one from 40% (we were guided by 30%).
All of the above standards during the study were considered as the norm and became the starting point for discussing the results of our experiment.
Practice: our experience
Eight schools and gymnasiums in different districts of Novosibirsk were chosen as testing grounds. School microclimate parameters were monitored using MagicAir smart microclimate base stations with integrated carbon dioxide, temperature, and humidity sensors. Base stations were installed in 13 offices, where all classes for five school days from Monday to Friday were held according to the usual schedule. The central ventilation in the schools was either absent (5 schools), or was turned off due to the strong noise that interferes with the pupils during the lessons (2 schools), or turned on only at recess (1 school). All data on the level of carbon dioxide, temperature and humidity in the offices came to the cloud server online.
1. One school day, one school
The total amount of data obtained from the studied sites is in the hundreds of numbers and graphs. For clarity, we will start to look at the results using the example of one day in the same classroom of one school. Let's designate it as “School 1”. To understand the picture, we combined graphs of changes in carbon dioxide levels, humidity and temperature, and the school schedule.
Charts 1-3 below the numbers in the circles indicate the numbers of lessons, six lessons in each of the two shifts. Lessons start at 8:00 and last 45 minutes each, between them there are changes of 10 or 20 minutes. Between shifts - a break of 10 minutes. The green line on the graphs indicates the standard values of the parameters.
All digital data are attached at the end of the article, after the list of references (see the file with the name “School1_cabinet1”).
Carbon dioxide
Chart 1. Carbon dioxide level during the school day, School 1, room 1
Chart 1 shows the change in carbon dioxide concentration in the classroom 1 of School 1 during one school day (from 8:00 to 20:00). The measurement error is ± 70 ppm at a concentration of not more than 2300 ppm, ± 3% at a concentration of more than 2300 ppm.
Before the start of the lessons, the level of CO2 still meets the standards, and, it would seem, with a large “margin”: at 7:30 in the air only about 430 ppm. But closer to 8 o'clock the children come to class, and the level of CO2 begins to grow steadily.
The second lesson begins at 8:55 with 770 ppm, and already after fifteen minutes the level of CO2 passes for a standard mark, exceeding 1 000 ppm. In general, it is easy to see that the concentration of CO2 exceeds the norm overwhelmingly most of the time (8.3 hours over the time period studied, that is, 69% of the time).
The most significant excess, 3,170 ppm, is recorded during the fifth lesson of the first shift.
Schedule 2, which shows the changes in air temperature in the classroom (see below), can be traced when the windows were opened: it was cold outside, so an open window invariably led to a decrease in temperature. You can, for example, notice that on the day described during the break, before the third lesson of the first shift, the office was well ventilated: the temperature dropped by almost 3 degrees, and the CO2 level dropped to 660 ppm. But at the beginning of the third lesson, the windows were closed, and the concentration of carbon dioxide began to increase again (temperature too), until it reached a critical 3,169 ppm in the fifth lesson. This is more than three times the norm. The air temperature at the same time reached the level of 29.
The effect of airing with a full class of 20-30 people disappeared in some 15-20 minutes.
A favorable period for CO2 was in the second lesson of the second shift. Such a “luck” is explained simply: first, the cabinet was aired by opening the windows. And secondly, there were no students in it, the class was empty. As soon as the students returned to the third lesson, the CO2 concentration went up again and reached 2 630 ppm (maximum in the second shift).
Air temperature
Graph 2. Air temperature during the school day, School 1, room 1
Graph 2 shows the change in air temperature in the classroom 1 of School 1 during one school day (from 8:00 to 20:00). The measurement error is ± 1.5 ° С (measurement range -10 ... + 85 ° С).
The air temperature throughout the school day exceeds the norm, reaching almost 30 ° C. The “best” result was 23 ° С, but it was achieved only for short periods of time. By changing the temperature, you can set the periods when windows were opened in the office. Due to the fact that the study was conducted during the cold season, an open window invariably led to a decrease in temperature in the office. And setting the periods of ventilation, you can compare them with a schedule of CO2. As soon as the window is closed, both the temperature and the CO2 level resume their growth.
Air humidity
Figure 3. Air humidity during school day, School 1, room 1
Graph 3 shows the change in air humidity in the classroom 1 of School 1 during one school day (from 8:00 to 20:00). The measurement error is ± 4% (measurement range 0 ... 95%).
As you can see, humidity is also far from desired. Most of the time it is lowered and it is extremely rare to get to the standard mark - a total of normal (30% and above) humidity kept only 2.8 hours during the school day (23% of the time). And despite the fact that we took GOST 30% as the norm, and 40–60%, not recommended by many physiologists.
We can not fail to note that periods of normal humidity were accompanied by a significant increase in air temperature (28–29 ° C) and CO2 level (2 3770 - 3 170 ppm).
findings
So, on the observed school day in the study room, according to our data, the average CO2 level during the lessons was 1,250 ppm, the maximum peak value was 3,170 ppm. The average humidity level was 19%, and the average temperature was 27.
Air temperature throughout the school day exceeds the norm. Humidity, by contrast, is critically reduced. The level of carbon dioxide in the air shows a higher amplitude than the other parameters, however, it mostly exceeds the norm, sometimes moving even beyond the 3,000 ppm mark.
In general, the microclimatic parameters that are most important for comfort, well-being and full-fledged work of the brain do not meet the standards throughout either the entire study period, or most of the study period. Not a single gap was recorded, when all three parameters of the microclimate would meet the standards simultaneously.
2. One school week, all schools
Then we took the data for all schools, allocated intervals from 8:00 to 19:00 (during these hours most schools have lessons) on weekdays from Monday to Friday and calculated average indicators of microclimate parameters.
The picture was as follows:
In the columns “Average CO2 Level”, “Average Humidity” and “Average Temperature” we placed the average indicators of carbon dioxide concentration, humidity and air temperature, respectively, in each studied school over the entire observation period. For the average level of CO2, we also indicated the spread of values — the average standard deviation (variance) with a level of reliability of 95%.
In the column “Average Peak CO2”, the average maximum values of carbon dioxide in each school for the entire observation period are recorded (five school days from Monday to Friday, from 8:00 to 19:00).
As you can see, the average temperature corresponds to the norm (20–22) in only three schools. The average humidity is four. But no school would pass the “CO2 test”: in all eight cases it exceeds the standard mark of 1,000 ppm, often 1.5-2 times.
Graph 4 shows the average value of CO2 in the air (data from all thirteen classrooms in eight schools are taken), as well as the average maximum and average minimum during the school day.
Chart 4. Summary of CO2 in the air for all schools
It should, however, be noted that the length of the school day differs depending on the school. Somewhere children are engaged in two shifts, but somewhere only in one, the first, so that in the second half of the day the classrooms are empty. This explains the trajectory of the lines on the right side of the graph. For example, the line of an average minimum during the second shift stably keeps within the limits of norm. But you should not be mistaken: it's not about airing at all. Just the sources of CO2 went home. In the first shift (when classes are held in all the rooms without exception), even the average minimum generally exceeds the norm.
You can orient yourself to the “Average” line in order to imagine a typical air condition on a typical school day of a typical school. Most of the time, CO2 levels are above normal. It is noticeable how the CO2 concentration demonstrates rapid growth with the onset of the lessons. Even the “fresh” early morning class at the end of the first lesson (around 9:00) becomes stuffy.
Digital data for all schools we attached at the end of this article, after the list of references.
findings
Based on our data, we make a general conclusion that in the studied schools of Novosibirsk there is an excess of carbon dioxide during lessons, an average of 500 ppm, insufficient air humidity and too high a temperature. In other words, the microclimate in schools does not meet regulatory requirements. The condition of the air in the classrooms is not only not conducive to effective intellectual work, but also often hinders learning.
In terms of average carbon dioxide levels, no school showed a level below 1,000 ppm. And the maximum CO2 value we recorded during the experiment was 4,230 ppm! Such an excess already poses a serious health hazard.
According to the University of Middlesek researchers, obtained as a result of an experiment with a study group of 300 adults, when the carbon dioxide level reaches 800 ppm, attention decreases by 30%, and at a concentration of more than 1,500 ppm, 79% of the participants experienced fatigue and headache. In addition, in the study of another scientist from the UK, D.S.
Roberts, fatigue and loss of concentration are observed already at a carbon dioxide level of 600 ppm and increase as the amount of CO2 increases. Based on the results of these experiments and other studies, it can be said that carbon dioxide directly affects the well-being (more here ), as well as the student’s progress, preventing him from concentrating and assimilating information in the lesson.
In this case, the problem of excess carbon dioxide in the air in many cases is either not recognized or ignored for various reasons (often financial). Now between the lessons are conducted for forte "micro-ventilation" or airing through the corridor, but the effect of their use disappears almost instantly with the advent of children in the classroom. It should also be noted that the ventilating airing is not carried out in every office, as often the window sills are filled with textbooks, flowers or visual materials that are necessary for training. In any case, there is now insufficient air exchange in the classes.
High temperatures and insufficient moisture are also considered unfavorable conditions for intellectual work. High temperature reduces the level of blood oxygen saturation, which, in turn, results in a feeling of weakness, lethargy, dizziness and shortness of breath are also possible. When the air temperature is about 30, sweating increases and the body's water-salt balance is disturbed. As for dry air, it affects the eyes, causing redness, dryness and contributing to their fatigue.
Since schools in different parts of the city were considered, we assume that it is possible to extrapolate the conclusions of the experiment with known assumptions to all schools of the Siberian Federal District, as well as to regions with a similar climate. However, the climatic difference between regions can affect only the temperature and humidity of the air, but not the level of CO2. Therefore, we assume that conclusions regarding the state of ventilation and carbon dioxide concentration in schools are valid for most schools throughout Russia (and maybe even around the world: it’s not for nothing that Western researchers are also concerned about this problem).
You can independently conduct a similar experiment in your city by installing a MagicAir base station at a school. Perhaps you will share the results here on GeekTimes.
Conclusion
We conducted a study of air quality in eight schools in Novosibirsk, measuring five main microclimate parameters every five minutes for five school days: temperature, air humidity and CO2 levels. As a result, we found that in all the schools studied, one or more of these parameters do not correspond to the norm (GOST 30494-2011). At the same time, the average concentration of CO2 in none of the eight schools is not normal.
The problem of the microclimate is relevant not only for schools, but also for kindergartens, sports clubs and various circles - in general, for all rooms where many children gather at the same time. At the same time, numerous studies prove that the state of the microclimate in these rooms, and especially the level of carbon dioxide, directly affects the state of health, concentration of attention and performance of schoolchildren.
No one will argue that good conditions are necessary in educational and training institutions so that this very upbringing and education can proceed efficiently and comfortably. But, unfortunately, still few people understand that “good conditions” are not only new desks, a projector and plastic windows, it is also a comfortable microclimate: fresh air of normal temperature and humidity.
Bibliography:
- DS Robertson. The current science. 2006. Vol. 90, N 12.
- Ke schaefer. Effects of increased ambient CO2 levels on human and animals // Experientia. 1982. Vol. 38
- I. V. Gurina. Who is responsible for the stuffiness in the room? // Chemistry and life. 2010. №2.
- Adverse conditions of the indoor school environment
- When carbon dioxide becomes poison
- The hunt for the stifling air, part 1. How much CO2 in Moscow?
- VENTILATION PERFORMANTE DANS LES ECOLES
- Is CO2 an Indoor Pollutant? Direct Effects of Low-to-Moderate CO2.
- Concentrations on Human Decision-Making Performance. Environmental Health Perspectives, December 2012, N 12.
- GOST 30494-2011. Residential and public buildings. The parameters of the microclimate in the premises.
→ Experimental data