Software design
Today, the process of creating complex software applications cannot be imagined without dividing into life cycle stages. By the life cycle of a program we understand the totality of stages:
Let us dwell in detail on the design process. During the design process, an architect or an experienced programmer creates project documentation, including text descriptions, diagrams, models of the future program. In this difficult matter, the UML language will help us.
UML - is a graphic language for visualization, description of parameters, design and documentation of various systems (programs in particular). Charts are created using special CASE tools, for example, Rational Rose (http://www-01.ibm.com/software/rational/) and Enterprise Architect (http://www.sparxsystems.com.au/). Based on UML technology, a single information model is being built. The above CASE tools are able to generate code in various object-oriented languages, as well as have a very useful reverse engineering function. (Reverse engineering allows you to create a graphical model from the existing program code and comments on it.)
Consider the types of diagrams for visualizing the model (this is a must have, although there are many more types):
The designed system is represented in the form of many entities or actors interacting with the system using the so-called precedents. In this case, an actor or actor is any entity that interacts with the system from the outside. In other words, each use case determines a certain set of actions performed by the system in dialogue with the actor. At the same time, nothing is said about how the interaction of actors with the system will be realized.
The class diagram serves to represent the static structure of the system model in the terminology of the classes of object-oriented programming. The class diagram can reflect, in particular, the various relationships between the individual entities of the domain, such as objects and subsystems, and also describes their internal structure (fields, methods ...) and types of relationships (inheritance, implementation of interfaces ...). This diagram does not indicate information on the time aspects of the functioning of the system. From this point of view, the class diagram is a further development of the conceptual model of the designed system. At this stage, fundamentally knowledge of the OOP approach and design patterns.
The main purpose of this diagram is to describe possible sequences of states and transitions that together characterize the behavior of the model element during its life cycle. The state diagram represents the dynamic behavior of entities, based on the specification of their reaction to the perception of certain specific events.

To model the interaction of objects in the UML language, appropriate interaction diagrams are used. The interactions of objects can be considered in time, and then a sequence diagram is used to represent the temporal features of the transmission and reception of messages between objects. Interacting objects exchange some information with each other. Moreover, the information takes the form of finished messages. In other words, although the message has informational content, it acquires the additional property of exerting a directed influence on its recipient.
The cooperation diagram in the form of rectangles depicts the objects participating in the interaction that contain the name of the object, its class and, possibly, attribute values. As in the class diagram, the associations between the objects are indicated in the form of various connecting lines. In this case, you can explicitly specify the names of the associations and the roles that objects play in this association.
Unlike a sequence diagram, a cooperation diagram depicts only the relationships between objects that play certain roles in the interaction.

The component diagram, in contrast to the previously discussed diagrams, describes the features of the physical representation of the system. The component diagram allows you to determine the architecture of the developed system by establishing dependencies between software components, which may be the source, binary and executable code. In many development environments, a module or component corresponds to a file. The dashed arrows connecting the modules show interdependence relationships similar to those that occur when compiling source programs. The main graphic elements of a component diagram are components, interfaces and dependencies between them.

The deployment diagram is intended for visualization of program elements and components that exist only at the runtime stage. In this case, only the component-instances of the program that are executable files or dynamic libraries are presented. Those components that are not used at runtime are not shown on the deployment diagram.
A deployment diagram contains graphical representations of processors, devices, processes, and the relationships between them. Unlike logical presentation diagrams, the deployment diagram is uniform for the system as a whole, since it should fully reflect the features of its implementation. This diagram, in fact, completes the OOAP process for a specific software system and its development, as a rule, is the last stage of the model specification.
This concludes the overview tour of the diagrams in particular and design in general. It is worth noting that the design process has long become the standard in software development, but often you have to deal with a superbly written program, which, due to the lack of normal documentation, acquires unnecessary side functionality, crutches, becomes cumbersome and loses its former quality. = (
I am convinced that the programmer is primarily an encoder - he should NOT communicate with the customer, should NOT think about the system architecture, should not invent an interface to the program, he should only code - implement algorithms, functionality, appearance, usability, but no more ... The designer, starting from abstract diagrams (describing the subject area) to diagrams representing the structure of data, classes, and processes of their interaction, should paint everything in detail step by step. That is, the complexity of the work and the salary of the designer should be an order of magnitude higher than that of the programmer == encoder. Sorry for sedition ....
- Analysis of the subject area and the creation of TK (interaction with the customer)
- Program structure design
- Coding (a set of program code according to project documentation)
- Testing and debugging
- Program implementation
- Program support
- Disposal
Let us dwell in detail on the design process. During the design process, an architect or an experienced programmer creates project documentation, including text descriptions, diagrams, models of the future program. In this difficult matter, the UML language will help us.
UML - is a graphic language for visualization, description of parameters, design and documentation of various systems (programs in particular). Charts are created using special CASE tools, for example, Rational Rose (http://www-01.ibm.com/software/rational/) and Enterprise Architect (http://www.sparxsystems.com.au/). Based on UML technology, a single information model is being built. The above CASE tools are able to generate code in various object-oriented languages, as well as have a very useful reverse engineering function. (Reverse engineering allows you to create a graphical model from the existing program code and comments on it.)
Consider the types of diagrams for visualizing the model (this is a must have, although there are many more types):
- Use case diagram
- Class diagram
- Statechart diagram
- Sequence diagram
- Collaboration Diagram
- Component diagram
- Deployment diagram
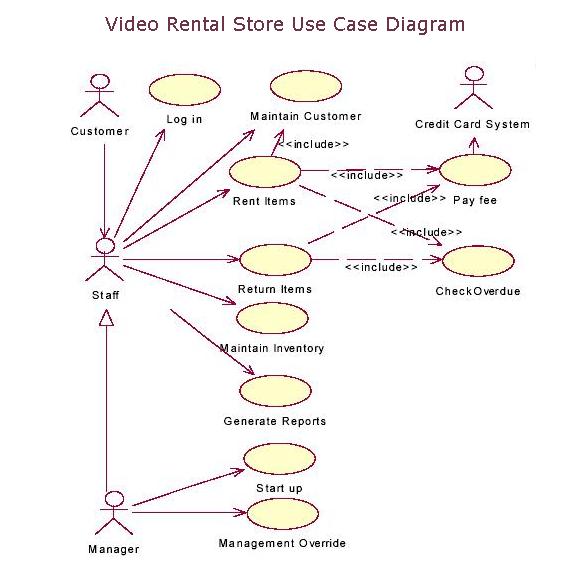
Use case diagram
The designed system is represented in the form of many entities or actors interacting with the system using the so-called precedents. In this case, an actor or actor is any entity that interacts with the system from the outside. In other words, each use case determines a certain set of actions performed by the system in dialogue with the actor. At the same time, nothing is said about how the interaction of actors with the system will be realized.
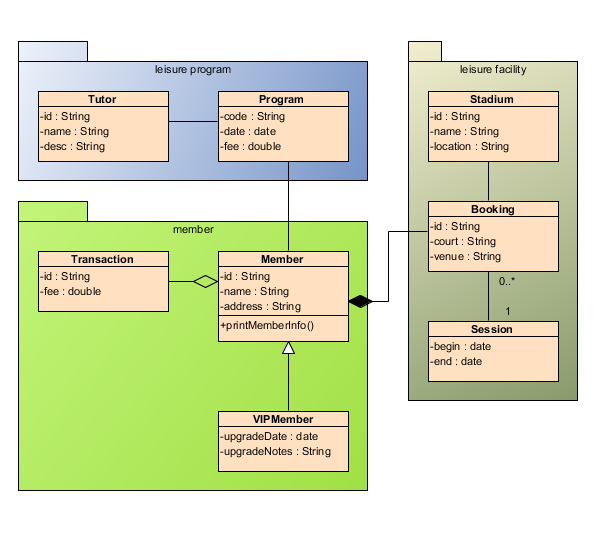
Class diagram
The class diagram serves to represent the static structure of the system model in the terminology of the classes of object-oriented programming. The class diagram can reflect, in particular, the various relationships between the individual entities of the domain, such as objects and subsystems, and also describes their internal structure (fields, methods ...) and types of relationships (inheritance, implementation of interfaces ...). This diagram does not indicate information on the time aspects of the functioning of the system. From this point of view, the class diagram is a further development of the conceptual model of the designed system. At this stage, fundamentally knowledge of the OOP approach and design patterns.
Statechart diagram
The main purpose of this diagram is to describe possible sequences of states and transitions that together characterize the behavior of the model element during its life cycle. The state diagram represents the dynamic behavior of entities, based on the specification of their reaction to the perception of certain specific events.
Sequence diagram
To model the interaction of objects in the UML language, appropriate interaction diagrams are used. The interactions of objects can be considered in time, and then a sequence diagram is used to represent the temporal features of the transmission and reception of messages between objects. Interacting objects exchange some information with each other. Moreover, the information takes the form of finished messages. In other words, although the message has informational content, it acquires the additional property of exerting a directed influence on its recipient.
Collaboration Diagram
The cooperation diagram in the form of rectangles depicts the objects participating in the interaction that contain the name of the object, its class and, possibly, attribute values. As in the class diagram, the associations between the objects are indicated in the form of various connecting lines. In this case, you can explicitly specify the names of the associations and the roles that objects play in this association.
Unlike a sequence diagram, a cooperation diagram depicts only the relationships between objects that play certain roles in the interaction.
Component diagram
The component diagram, in contrast to the previously discussed diagrams, describes the features of the physical representation of the system. The component diagram allows you to determine the architecture of the developed system by establishing dependencies between software components, which may be the source, binary and executable code. In many development environments, a module or component corresponds to a file. The dashed arrows connecting the modules show interdependence relationships similar to those that occur when compiling source programs. The main graphic elements of a component diagram are components, interfaces and dependencies between them.
Deployment diagram
The deployment diagram is intended for visualization of program elements and components that exist only at the runtime stage. In this case, only the component-instances of the program that are executable files or dynamic libraries are presented. Those components that are not used at runtime are not shown on the deployment diagram.
A deployment diagram contains graphical representations of processors, devices, processes, and the relationships between them. Unlike logical presentation diagrams, the deployment diagram is uniform for the system as a whole, since it should fully reflect the features of its implementation. This diagram, in fact, completes the OOAP process for a specific software system and its development, as a rule, is the last stage of the model specification.
This concludes the overview tour of the diagrams in particular and design in general. It is worth noting that the design process has long become the standard in software development, but often you have to deal with a superbly written program, which, due to the lack of normal documentation, acquires unnecessary side functionality, crutches, becomes cumbersome and loses its former quality. = (
I am convinced that the programmer is primarily an encoder - he should NOT communicate with the customer, should NOT think about the system architecture, should not invent an interface to the program, he should only code - implement algorithms, functionality, appearance, usability, but no more ... The designer, starting from abstract diagrams (describing the subject area) to diagrams representing the structure of data, classes, and processes of their interaction, should paint everything in detail step by step. That is, the complexity of the work and the salary of the designer should be an order of magnitude higher than that of the programmer == encoder. Sorry for sedition ....