Maximum flow of minimum cost. Solution in Excel
In response to a similar post, which spurred me on to write this ...
Since I graduated recently from a railway university, and there was a course in logistics, pleasant memories flooded over me. As always, all calculations were carried out, of course, manually, after thinking about it a little simple program was written, so to speak, to help classmates ...
but what was my surprise when I found out that all this, as they say, was invented without me, and besides and not one time))).
The article will focus on solving the transport problem using Microsoft Excel.
as always, everything is ingenious is simple, there is such a menu item - Search for solutions ...
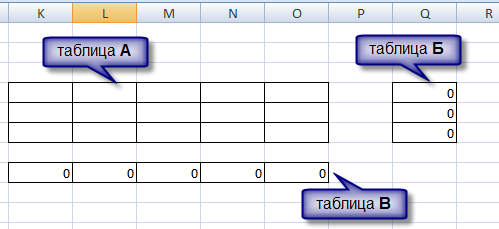
Let's create a new project in Excel'e, it has three tables: consumers, suppliers and cost

Next, somewhere nearby, create 3 similarly sized tables, where table A will be empty, the elements of table B will be equal to the sum of the corresponding rows of table A (from K to O), table C is similar to table B, only with columns of table A.
Further it will be more complicated we need to create a table T (this results table that reflects the optimal transportation costs), each element of which will be equal to the product of the value of the corresponding element of the table and table A

Well, I think so far everything was Nitak too difficult ...
Now, etc. I further optimization calculations, we need a target, so skazhat function.
To do this, select an empty space on the Sheet, and write the formula there:

Inside the function “the sum of the works” we have the addresses of our two tables that have already come to life: cost and table A.
Well, all the preparatory moments have been passed, now it's up to excel…
I use the 2007 version, although the difference is only in the location key elements ... and so, go to the Data ribbon and find
such a fad there , most likely it will not be there)))), you just need to add it there. It is located in the D construction sites, from there and pull it to the panel.
Running the “search for solutions” we will see the following window
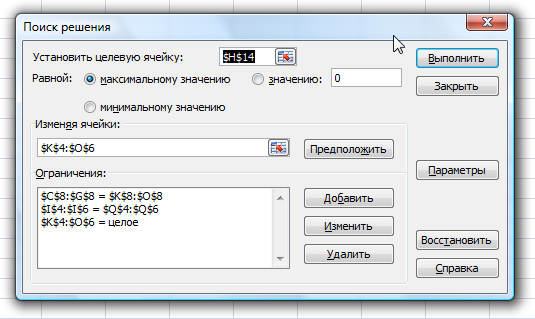
, where as the target cell we indicate our cell with the objective function; Next, you need to reflect on the goal of the task. My goal is to maximize profits, therefore I choose the maximum value (everything is clear at this point); set the table A as the variable cells.
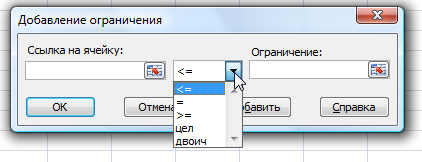
Now set the limits. It can be seen from the figure that we have them 3. Constraints are added elementary
Constraints:
1) table suppliers = table B
2) table consumers = table B
3) we say that the elements of our table A must be whole After
adding 3 restrictions, click the parameters button
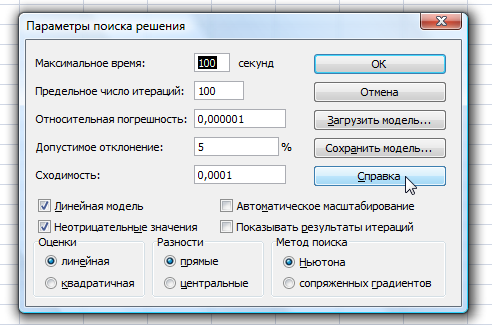
Here it is important to check the box with the linear model and non-negative values.
ALL!
Click OK, execute ...
and we have the result-solution of our transport task in Excel

upd. How to add a solution search menu
Since I graduated recently from a railway university, and there was a course in logistics, pleasant memories flooded over me. As always, all calculations were carried out, of course, manually, after thinking about it a little simple program was written, so to speak, to help classmates ...
but what was my surprise when I found out that all this, as they say, was invented without me, and besides and not one time))).
The article will focus on solving the transport problem using Microsoft Excel.
as always, everything is ingenious is simple, there is such a menu item - Search for solutions ...
Let's create a new project in Excel'e, it has three tables: consumers, suppliers and cost
Next, somewhere nearby, create 3 similarly sized tables, where table A will be empty, the elements of table B will be equal to the sum of the corresponding rows of table A (from K to O), table C is similar to table B, only with columns of table A.
Further it will be more complicated we need to create a table T (this results table that reflects the optimal transportation costs), each element of which will be equal to the product of the value of the corresponding element of the table and table A
Well, I think so far everything was Nitak too difficult ...
Now, etc. I further optimization calculations, we need a target, so skazhat function.
To do this, select an empty space on the Sheet, and write the formula there:
Inside the function “the sum of the works” we have the addresses of our two tables that have already come to life: cost and table A.
Well, all the preparatory moments have been passed, now it's up to excel…
I use the 2007 version, although the difference is only in the location key elements ... and so, go to the Data ribbon and find
such a fad there
, most likely it will not be there)))), you just need to add it there. It is located in the D construction sites, from there and pull it to the panel. Running the “search for solutions” we will see the following window
, where as the target cell we indicate our cell with the objective function; Next, you need to reflect on the goal of the task. My goal is to maximize profits, therefore I choose the maximum value (everything is clear at this point); set the table A as the variable cells.
Now set the limits. It can be seen from the figure that we have them 3. Constraints are added elementary
Constraints:
1) table suppliers = table B
2) table consumers = table B
3) we say that the elements of our table A must be whole After
adding 3 restrictions, click the parameters button
Here it is important to check the box with the linear model and non-negative values.
ALL!
Click OK, execute ...
and we have the result-solution of our transport task in Excel
upd. How to add a solution search menu