Coronavirus: why you need to act right now
- Transfer
- Tutorial
Introduction
Given everything that happens with coronavirus, it can be very difficult to decide what to do right now. Should I wait for more information? Should I do something today? If so, then what?
In this article with many graphs, data and models from a large number of sources, we will try to answer the questions:
- How many people will get coronavirus in your area?
- What will happen when they start to get sick?
- What should you do?
- When?
When you finish reading the article, you will come to the following conclusions:
- Coronavirus is approaching you.
- It is approaching at an exponential rate: first gradually, and then suddenly.
- This is a matter of several days. Maybe a week or two.
- When this happens, your healthcare system will be overloaded.
- Your fellow citizens will be treated in the corridors.
- Exhausted medical workers will break. Some will die.
- They will have to decide which patient will receive treatment and who will die.
- The only way to prevent this is by social exclusion today. Not tomorrow. Today.
- This means keeping as many people as possible at home, starting today.
If you are a politician, public figure or leader, you have the power and responsibility to prevent the above.
Now you may be afraid: what if it is an overreaction? Won't people laugh at me? What if they get mad at me? Wouldn't I look stupid? Isn't it better to wait for others to take their first steps? What if it hurts the business too much?
However, after 2-4 weeks, when the whole world will be closed and isolated, when it turns out that the several precious days of social isolation that you organized, saved lives, you will no longer be criticized. People will thank you for making the right decision.
So let's get it right.
1. How many coronavirus cases will be in your area?
Country Growth
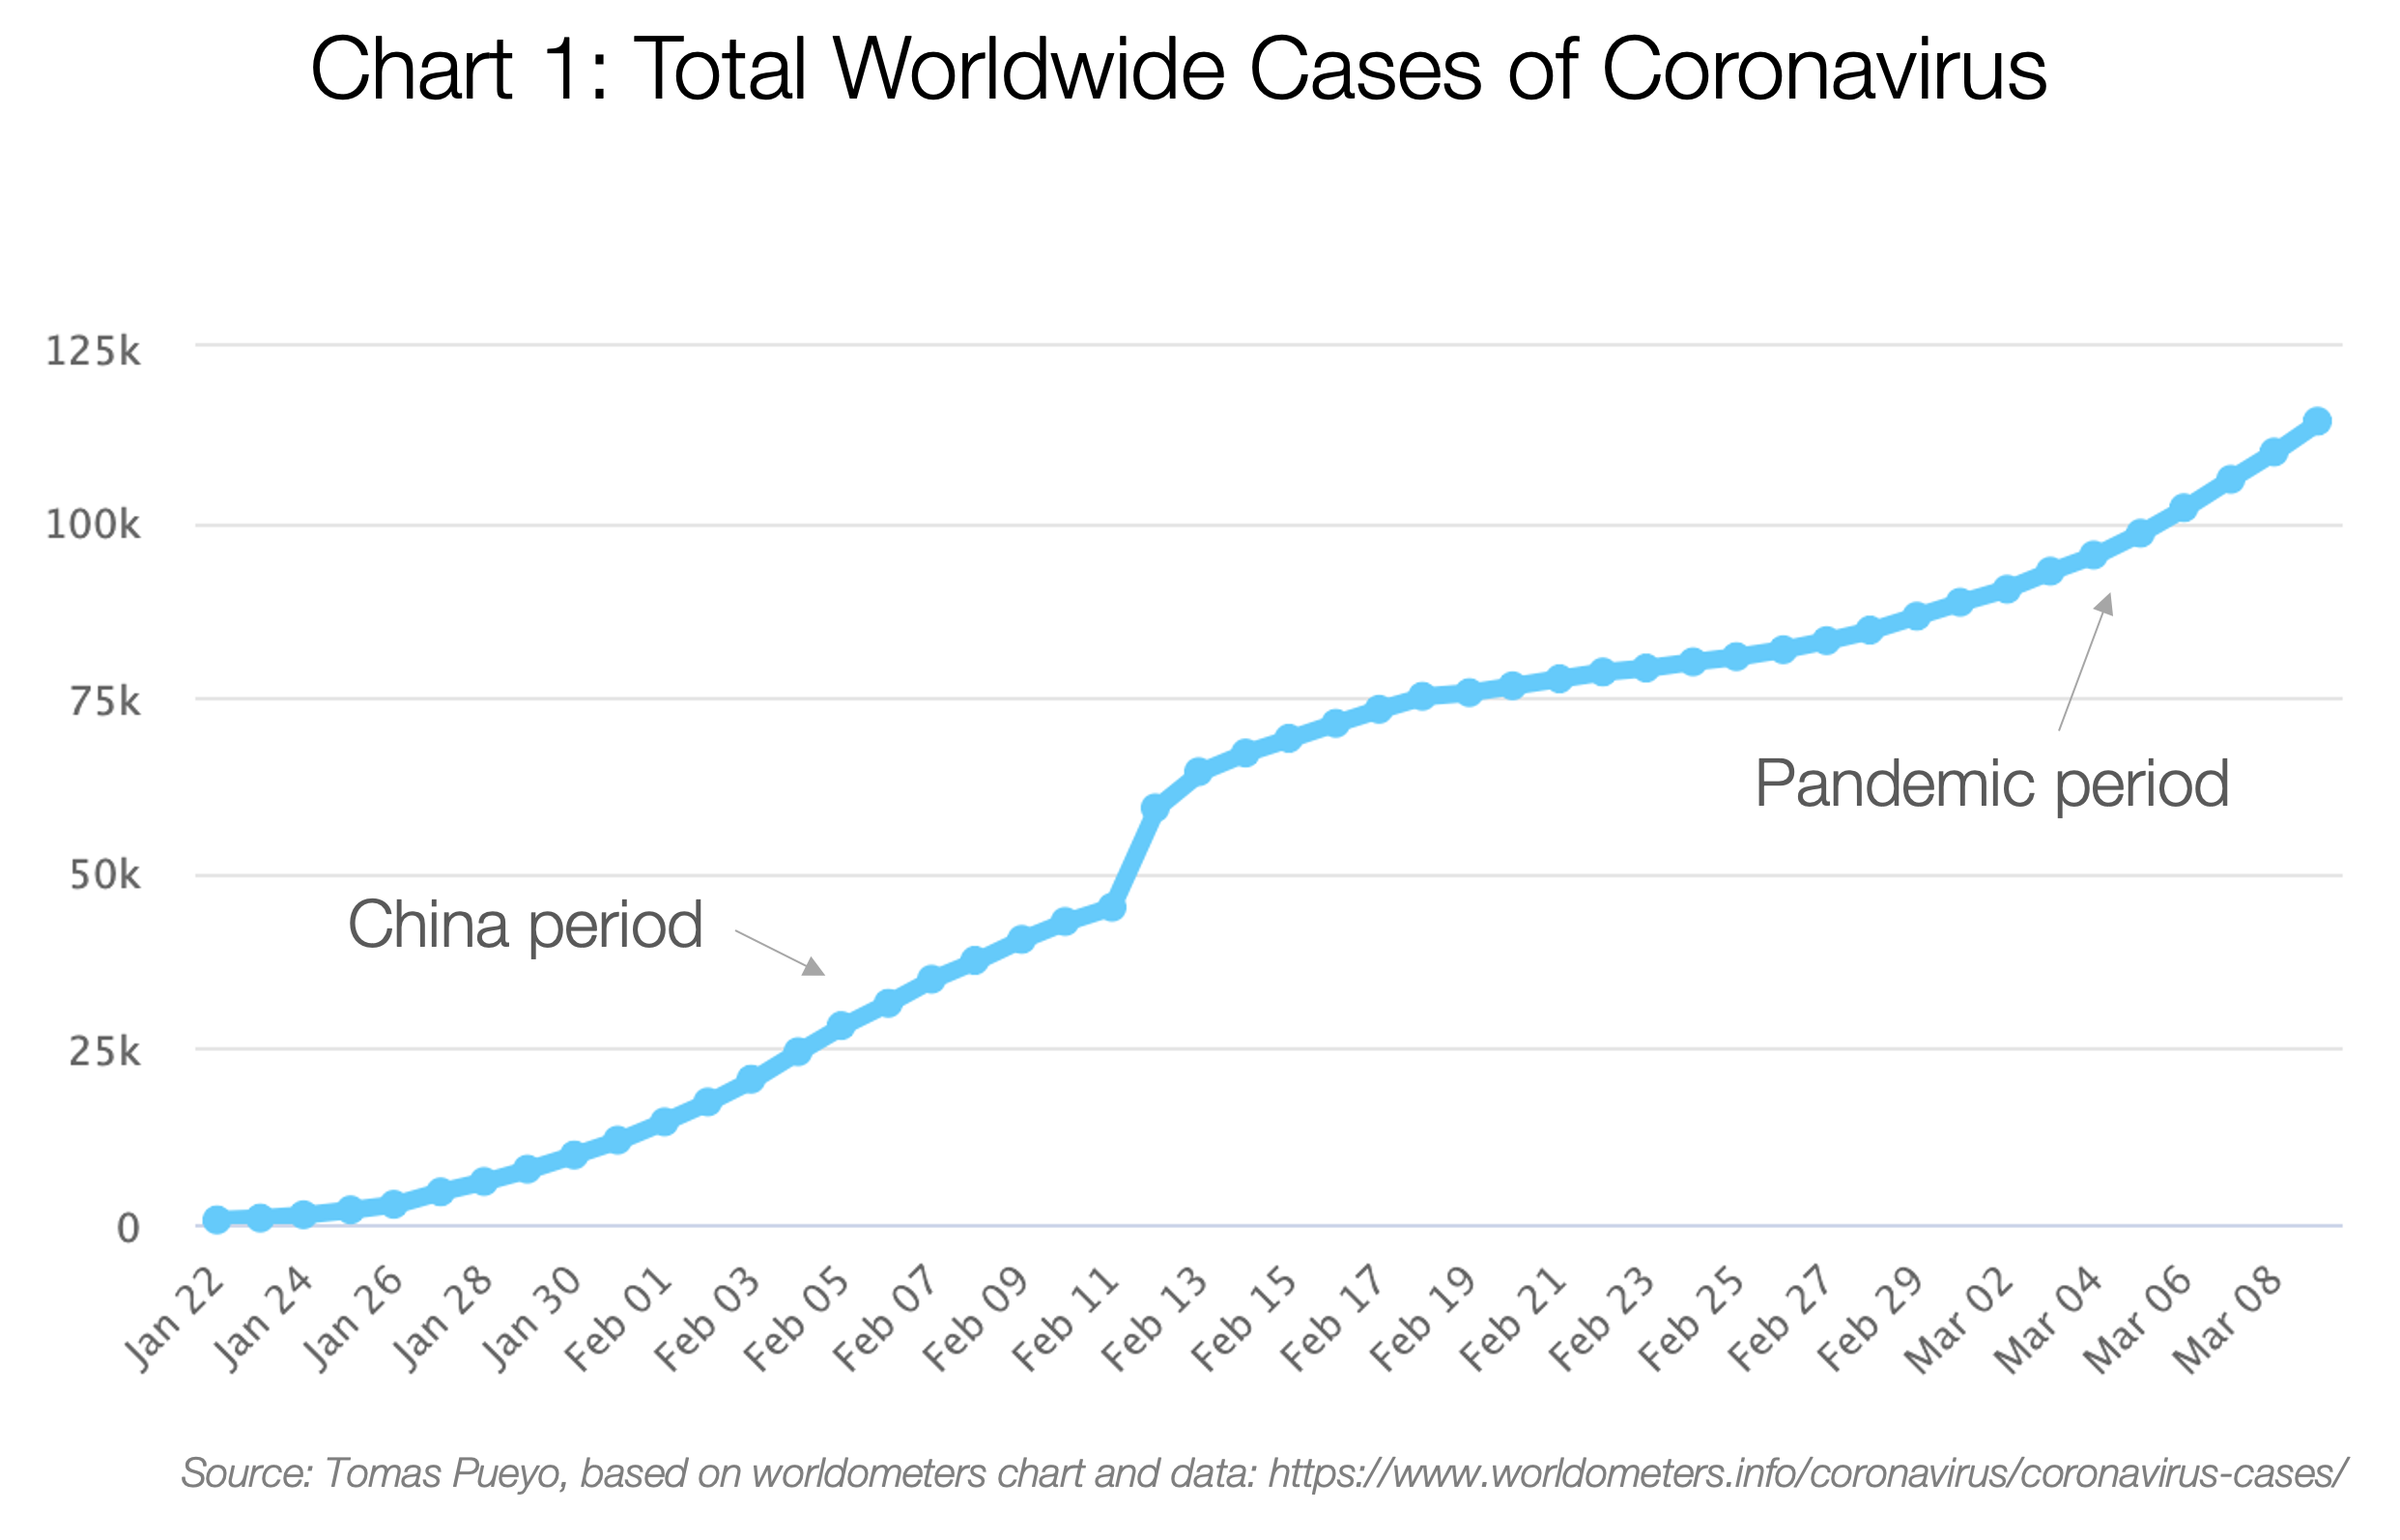
The total number of patients grew exponentially until China stopped this process. But then the coronavirus leaked out, and now it's a pandemic that no one can stop.
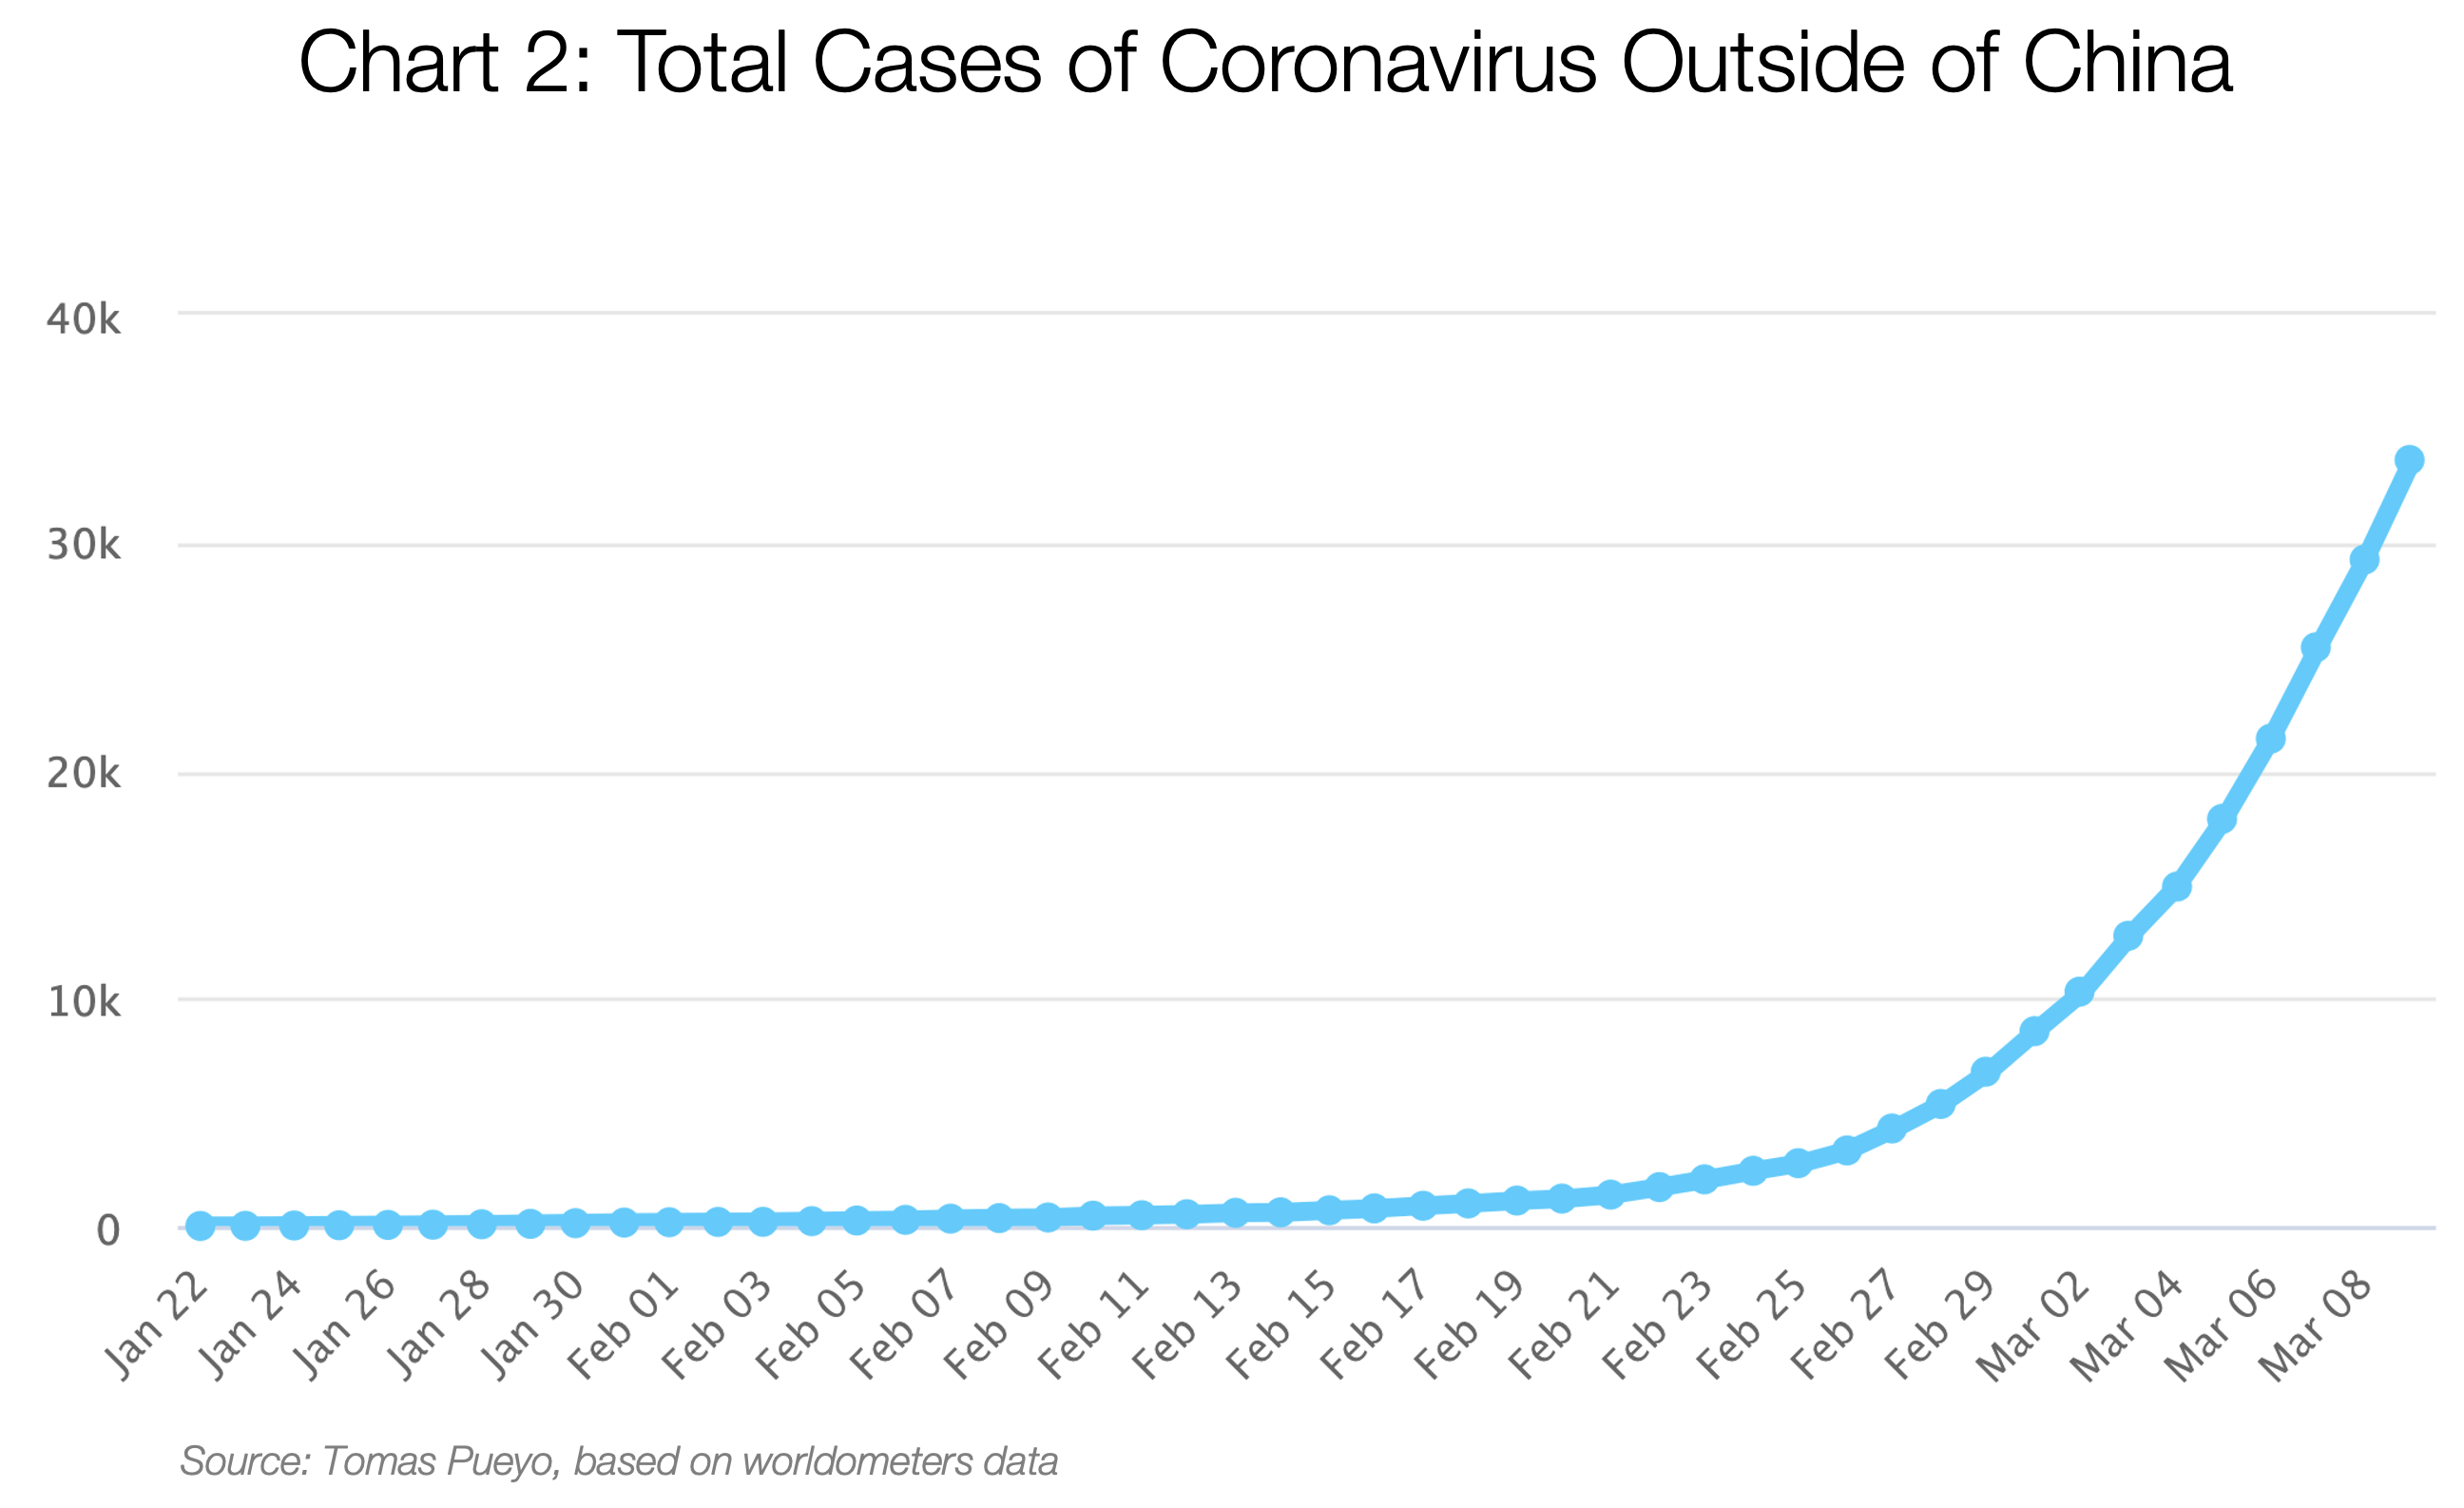
To date, Italy, Iran and South Korea have made the main contribution:
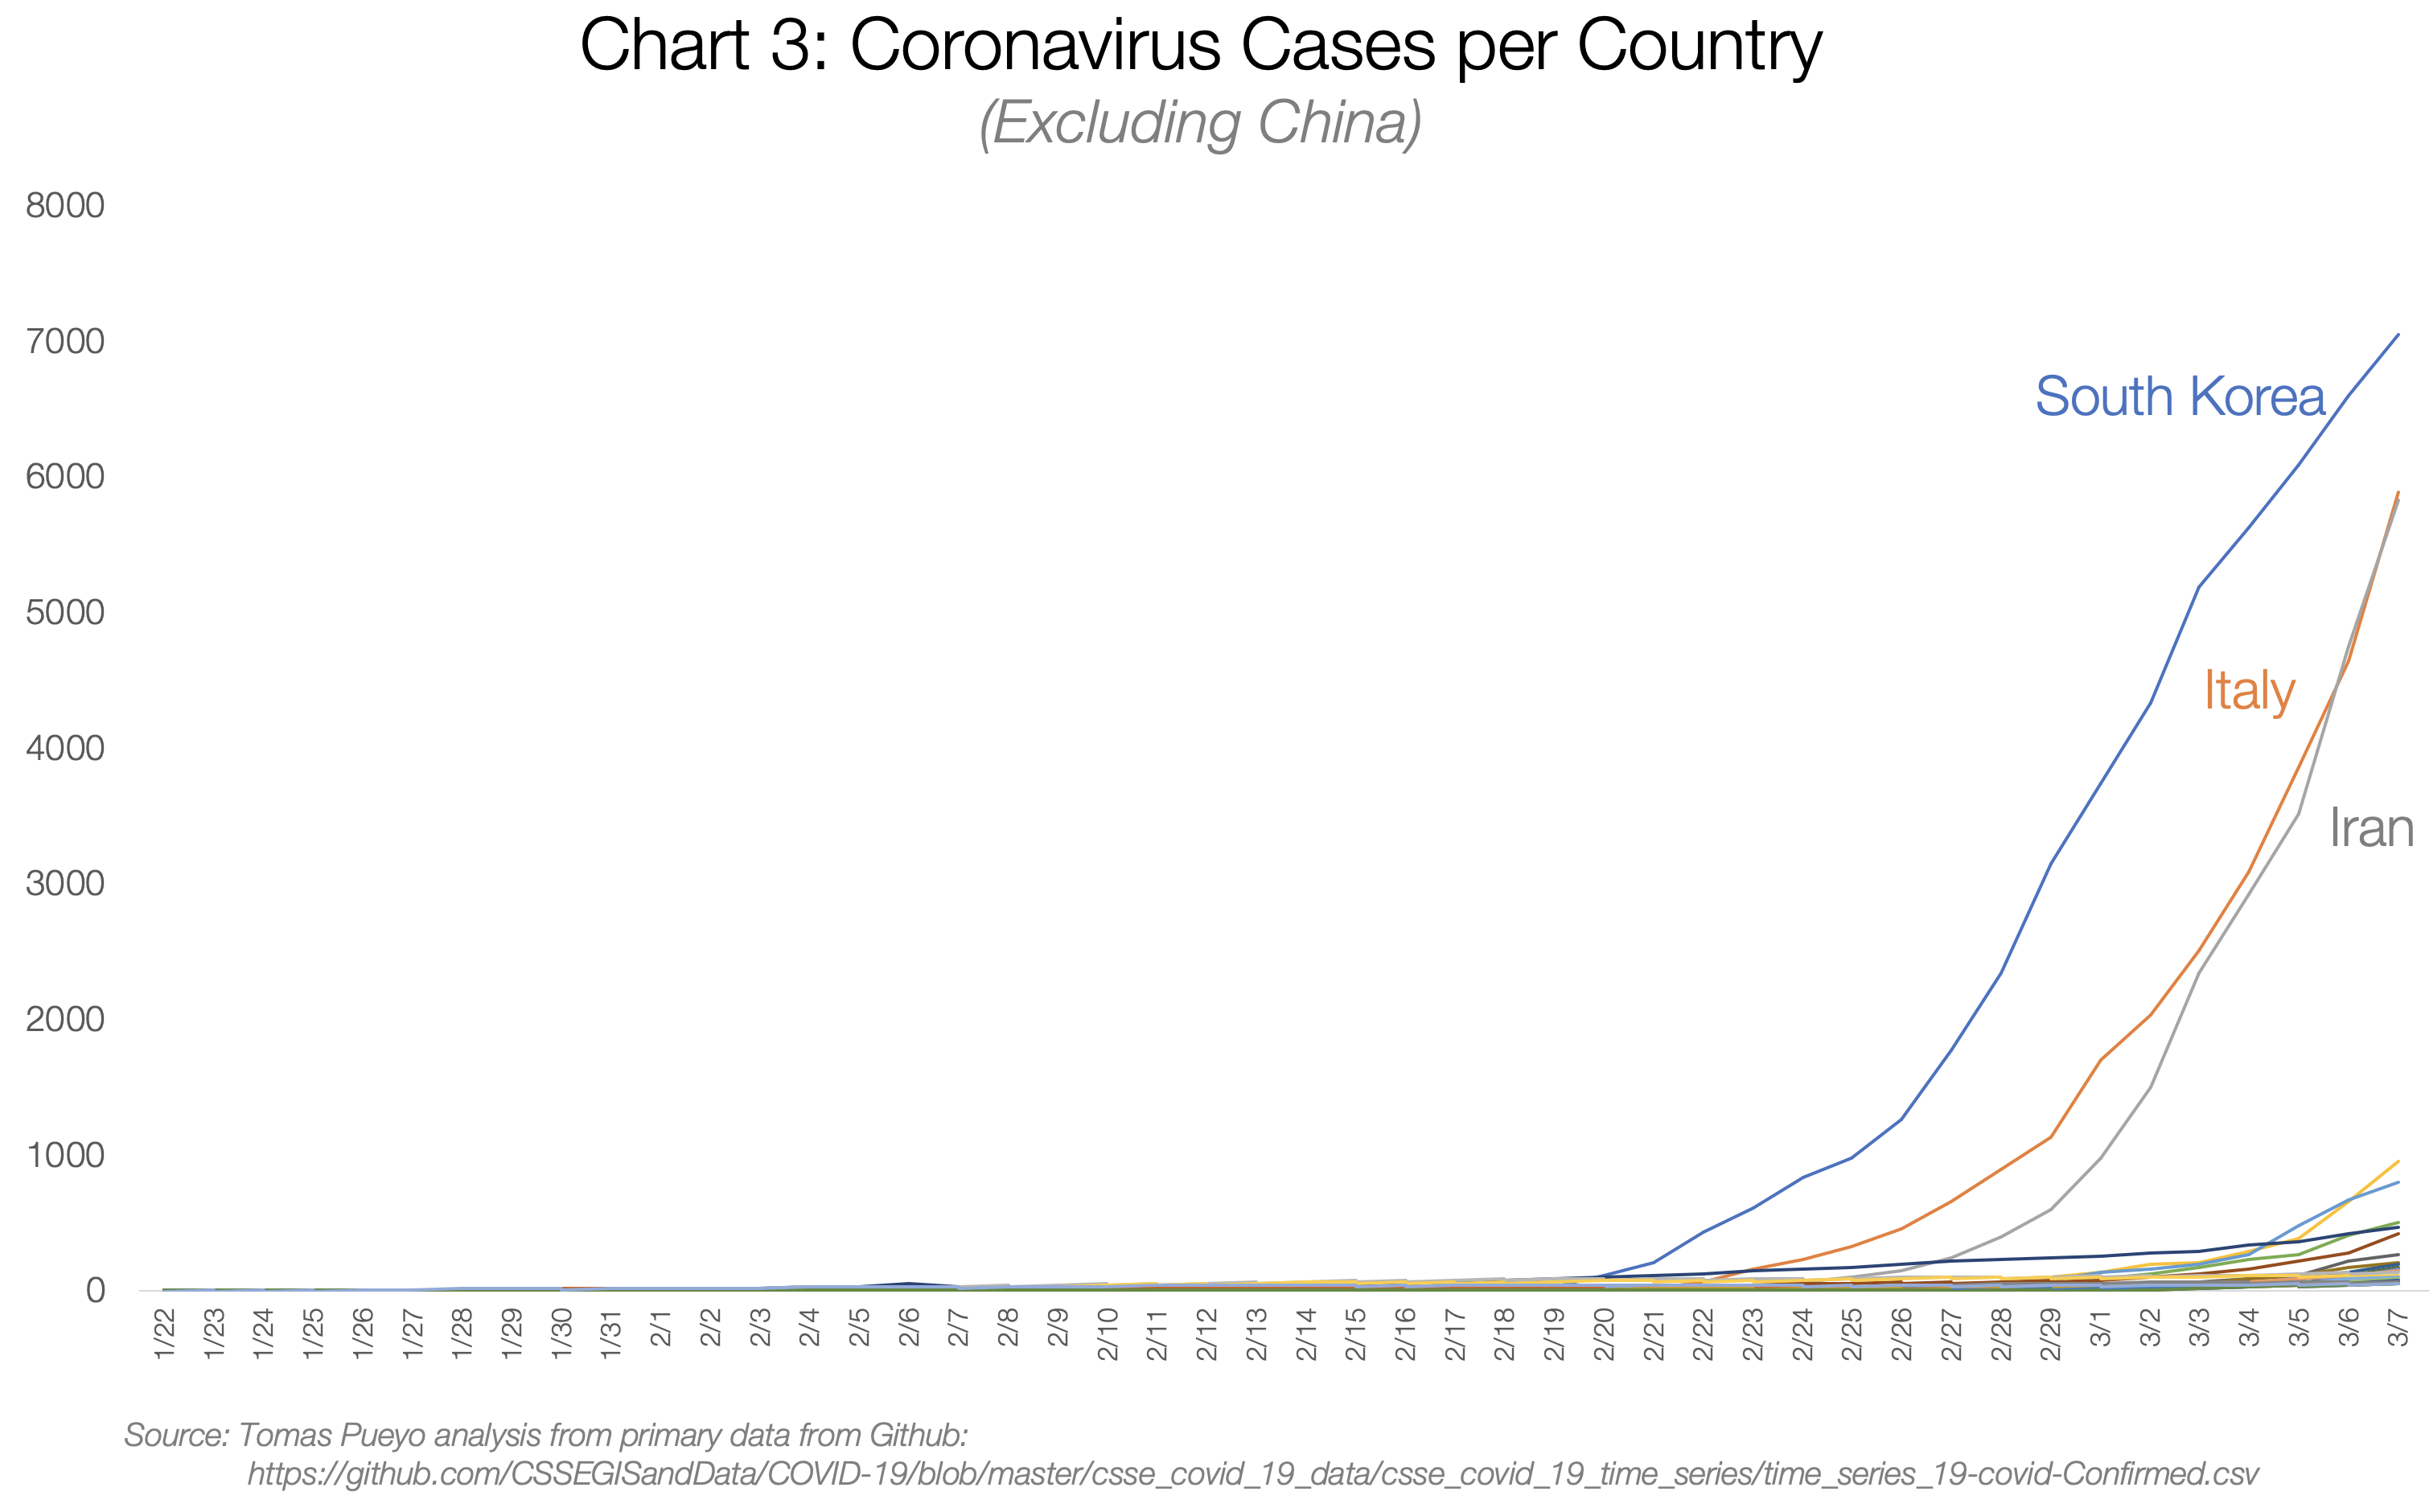
there are so many cases in South Korea, Italy and China that the rest of the countries are hard to see, but let's look at the lower right corner.
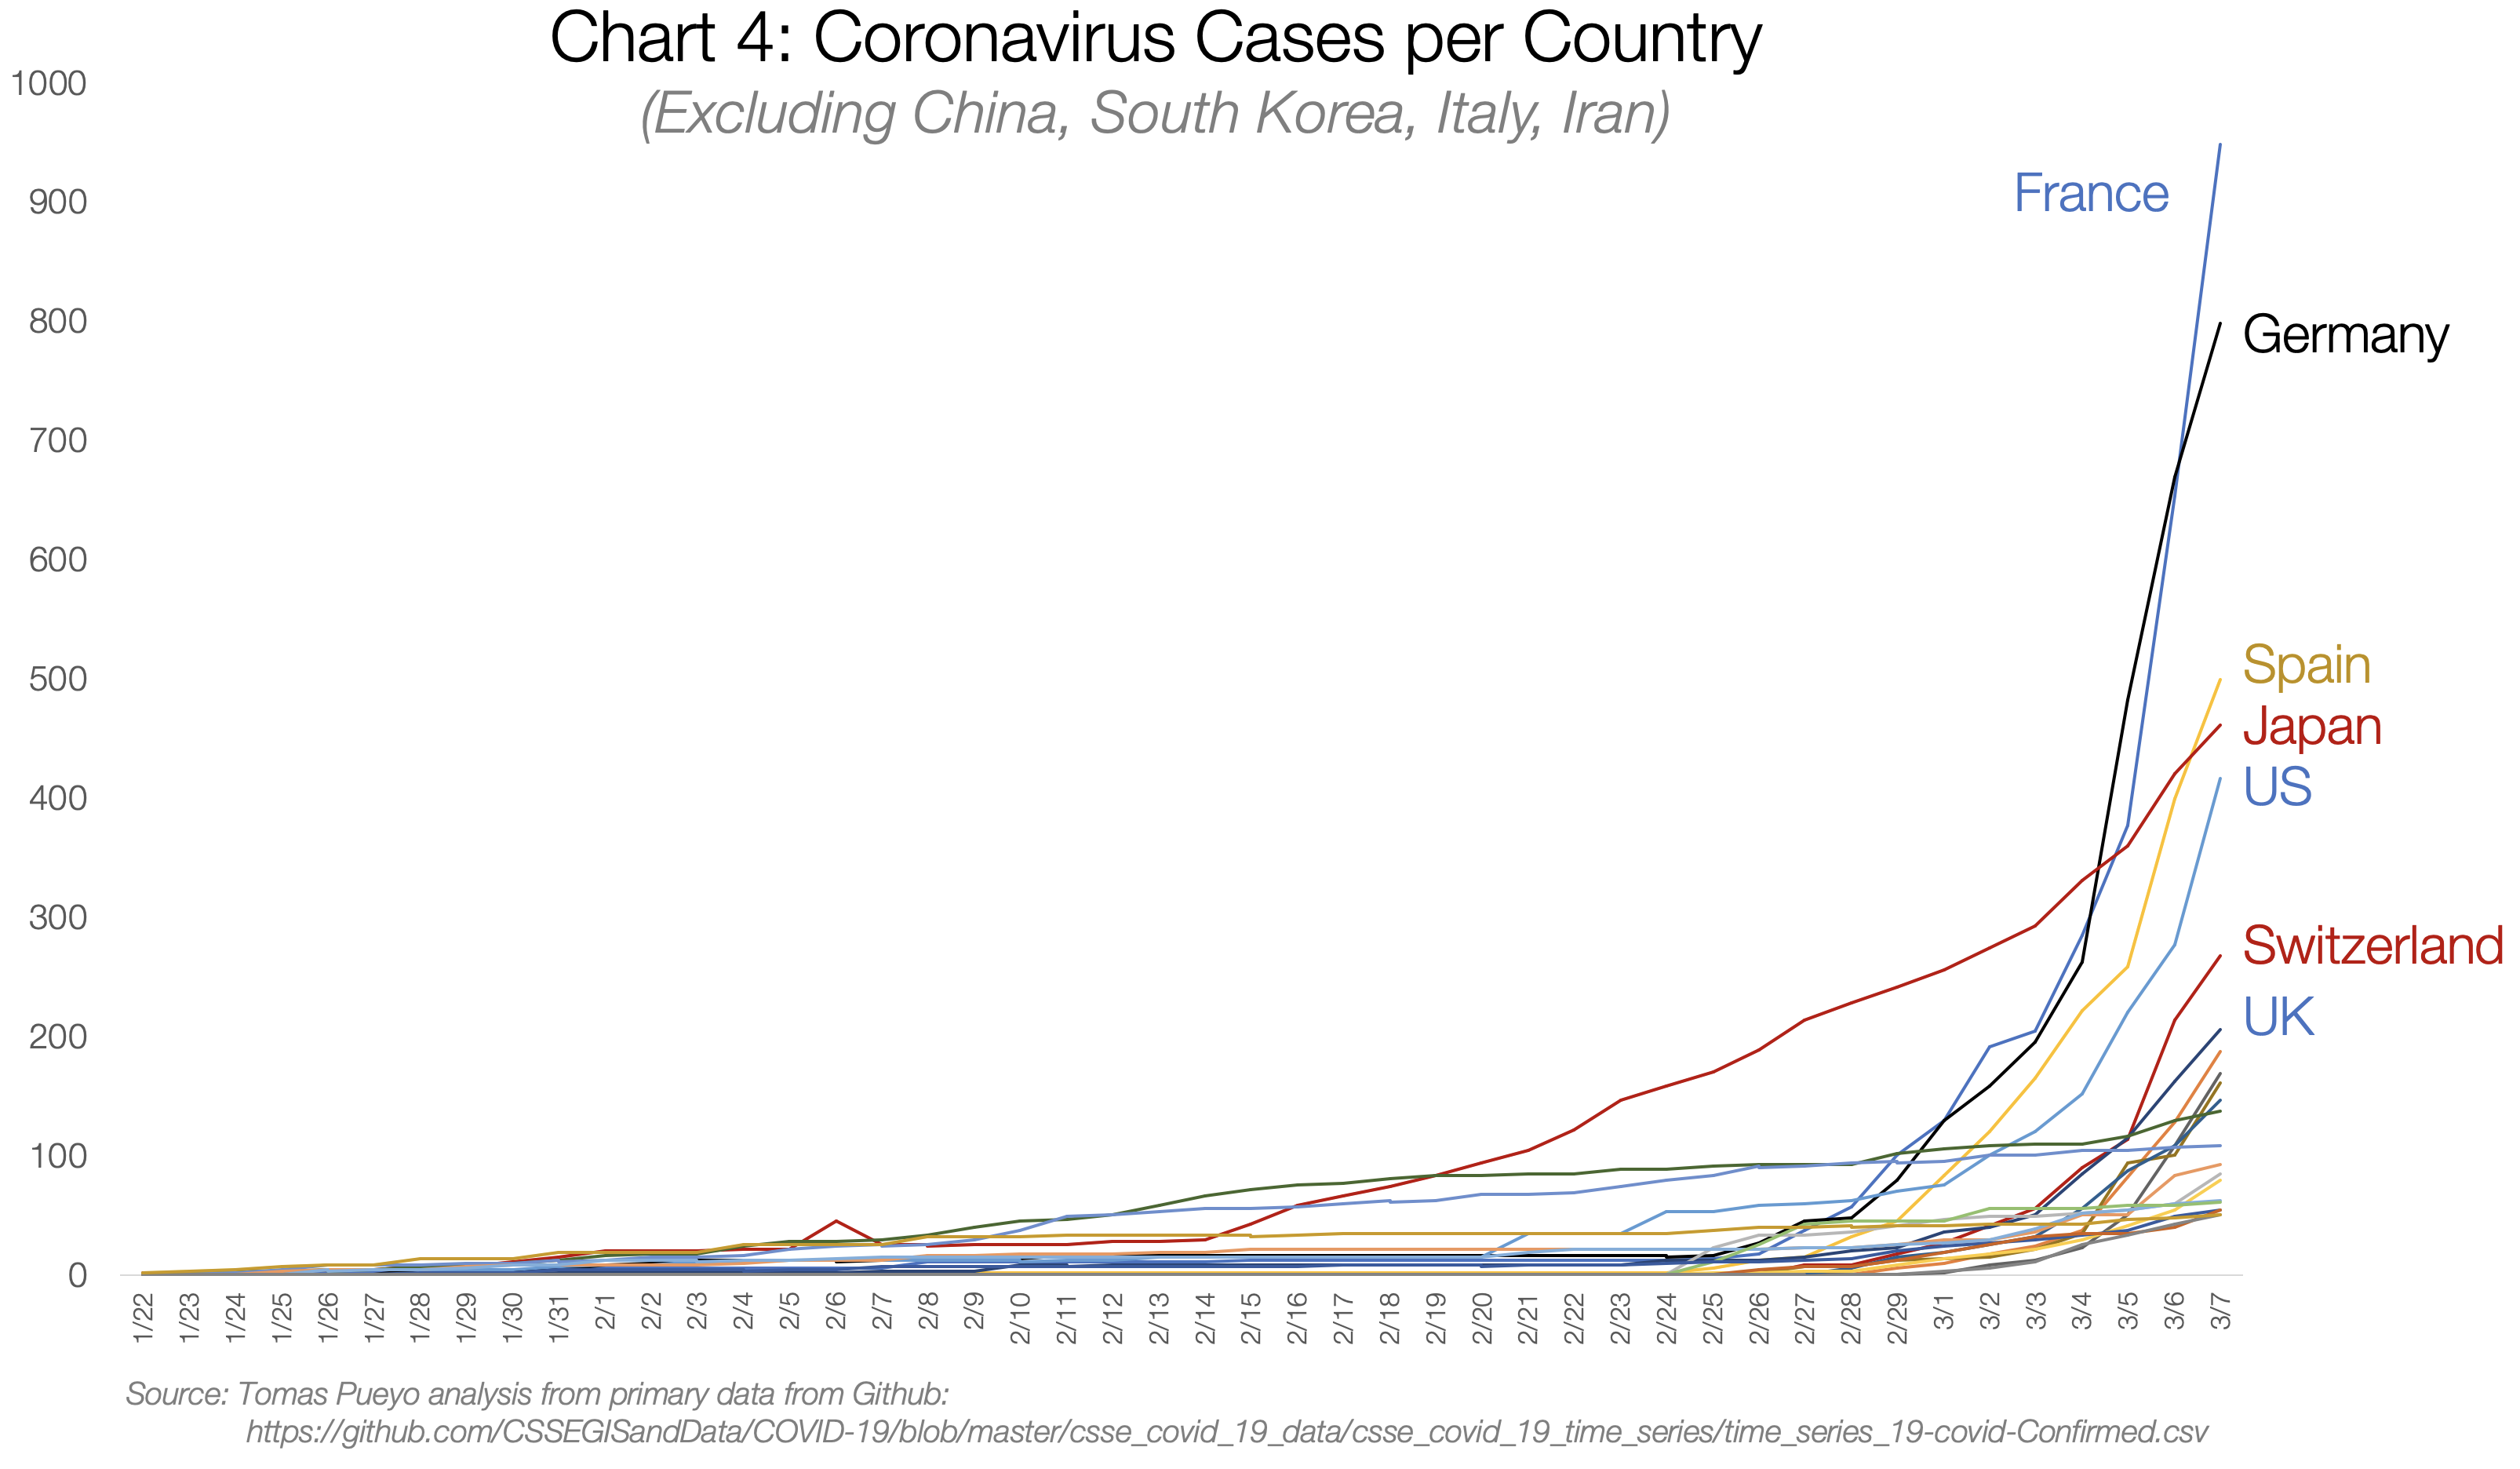
There are dozens of countries with exponential growth. Today, most of them are Western.
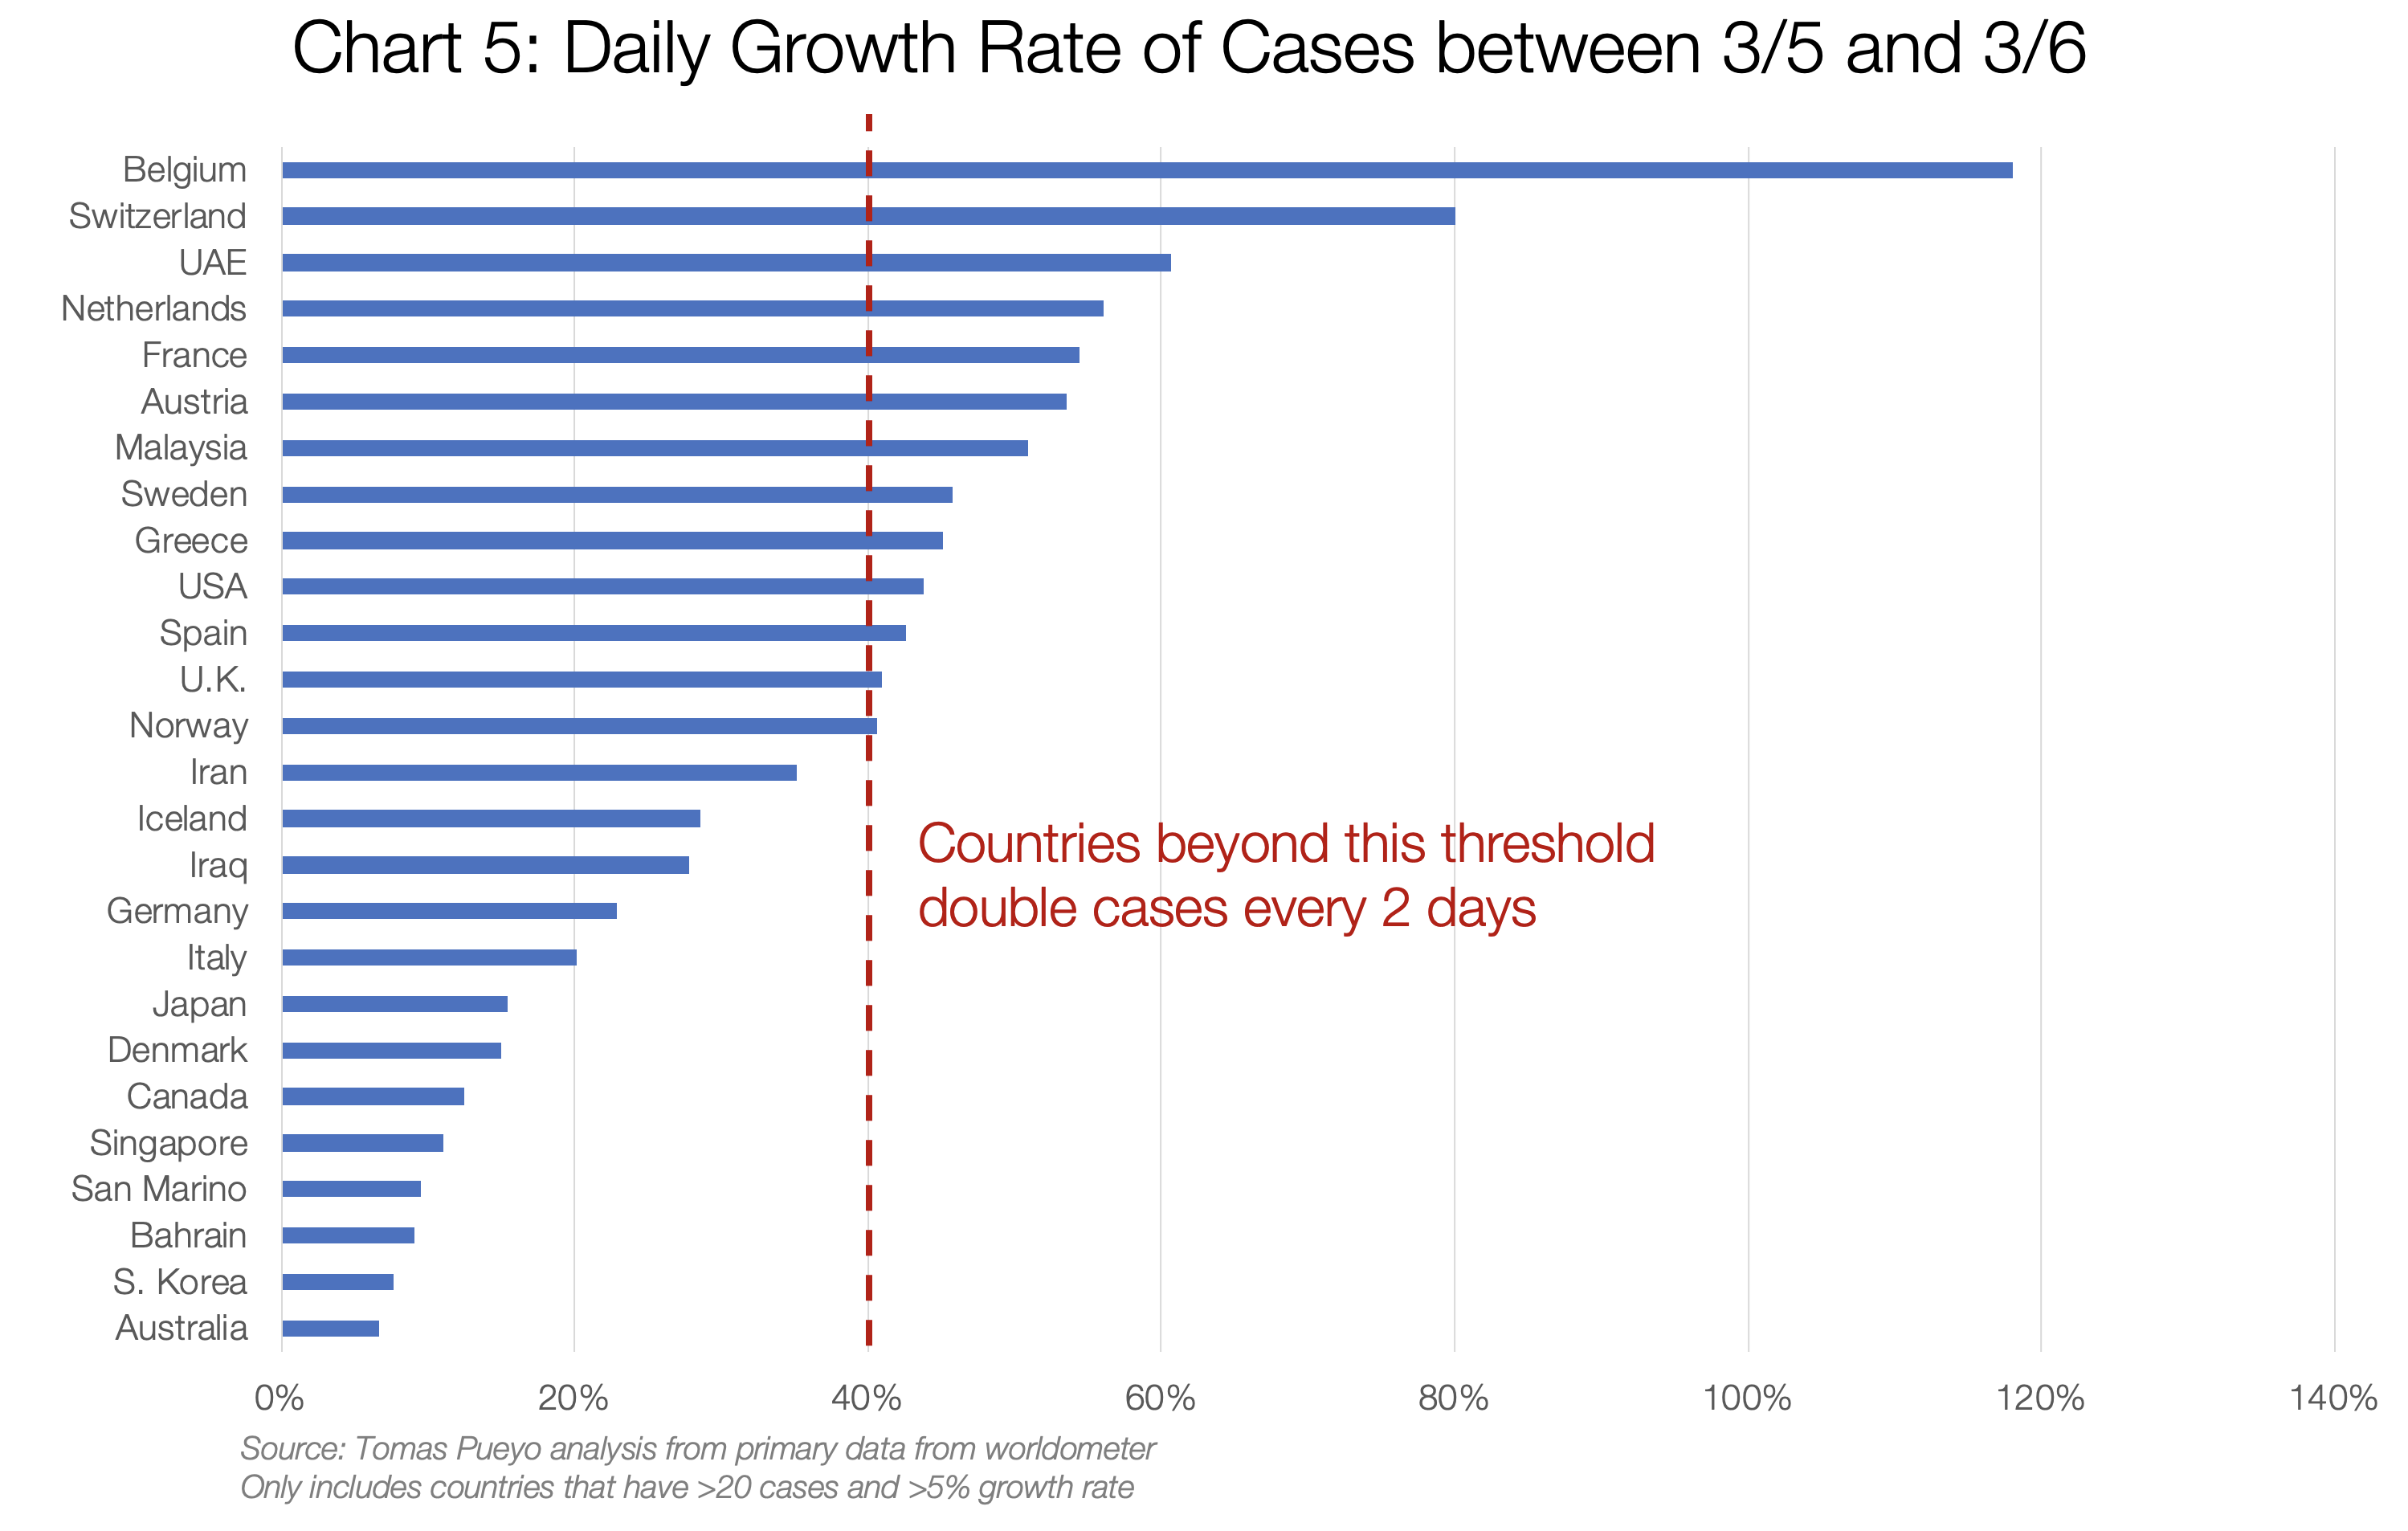
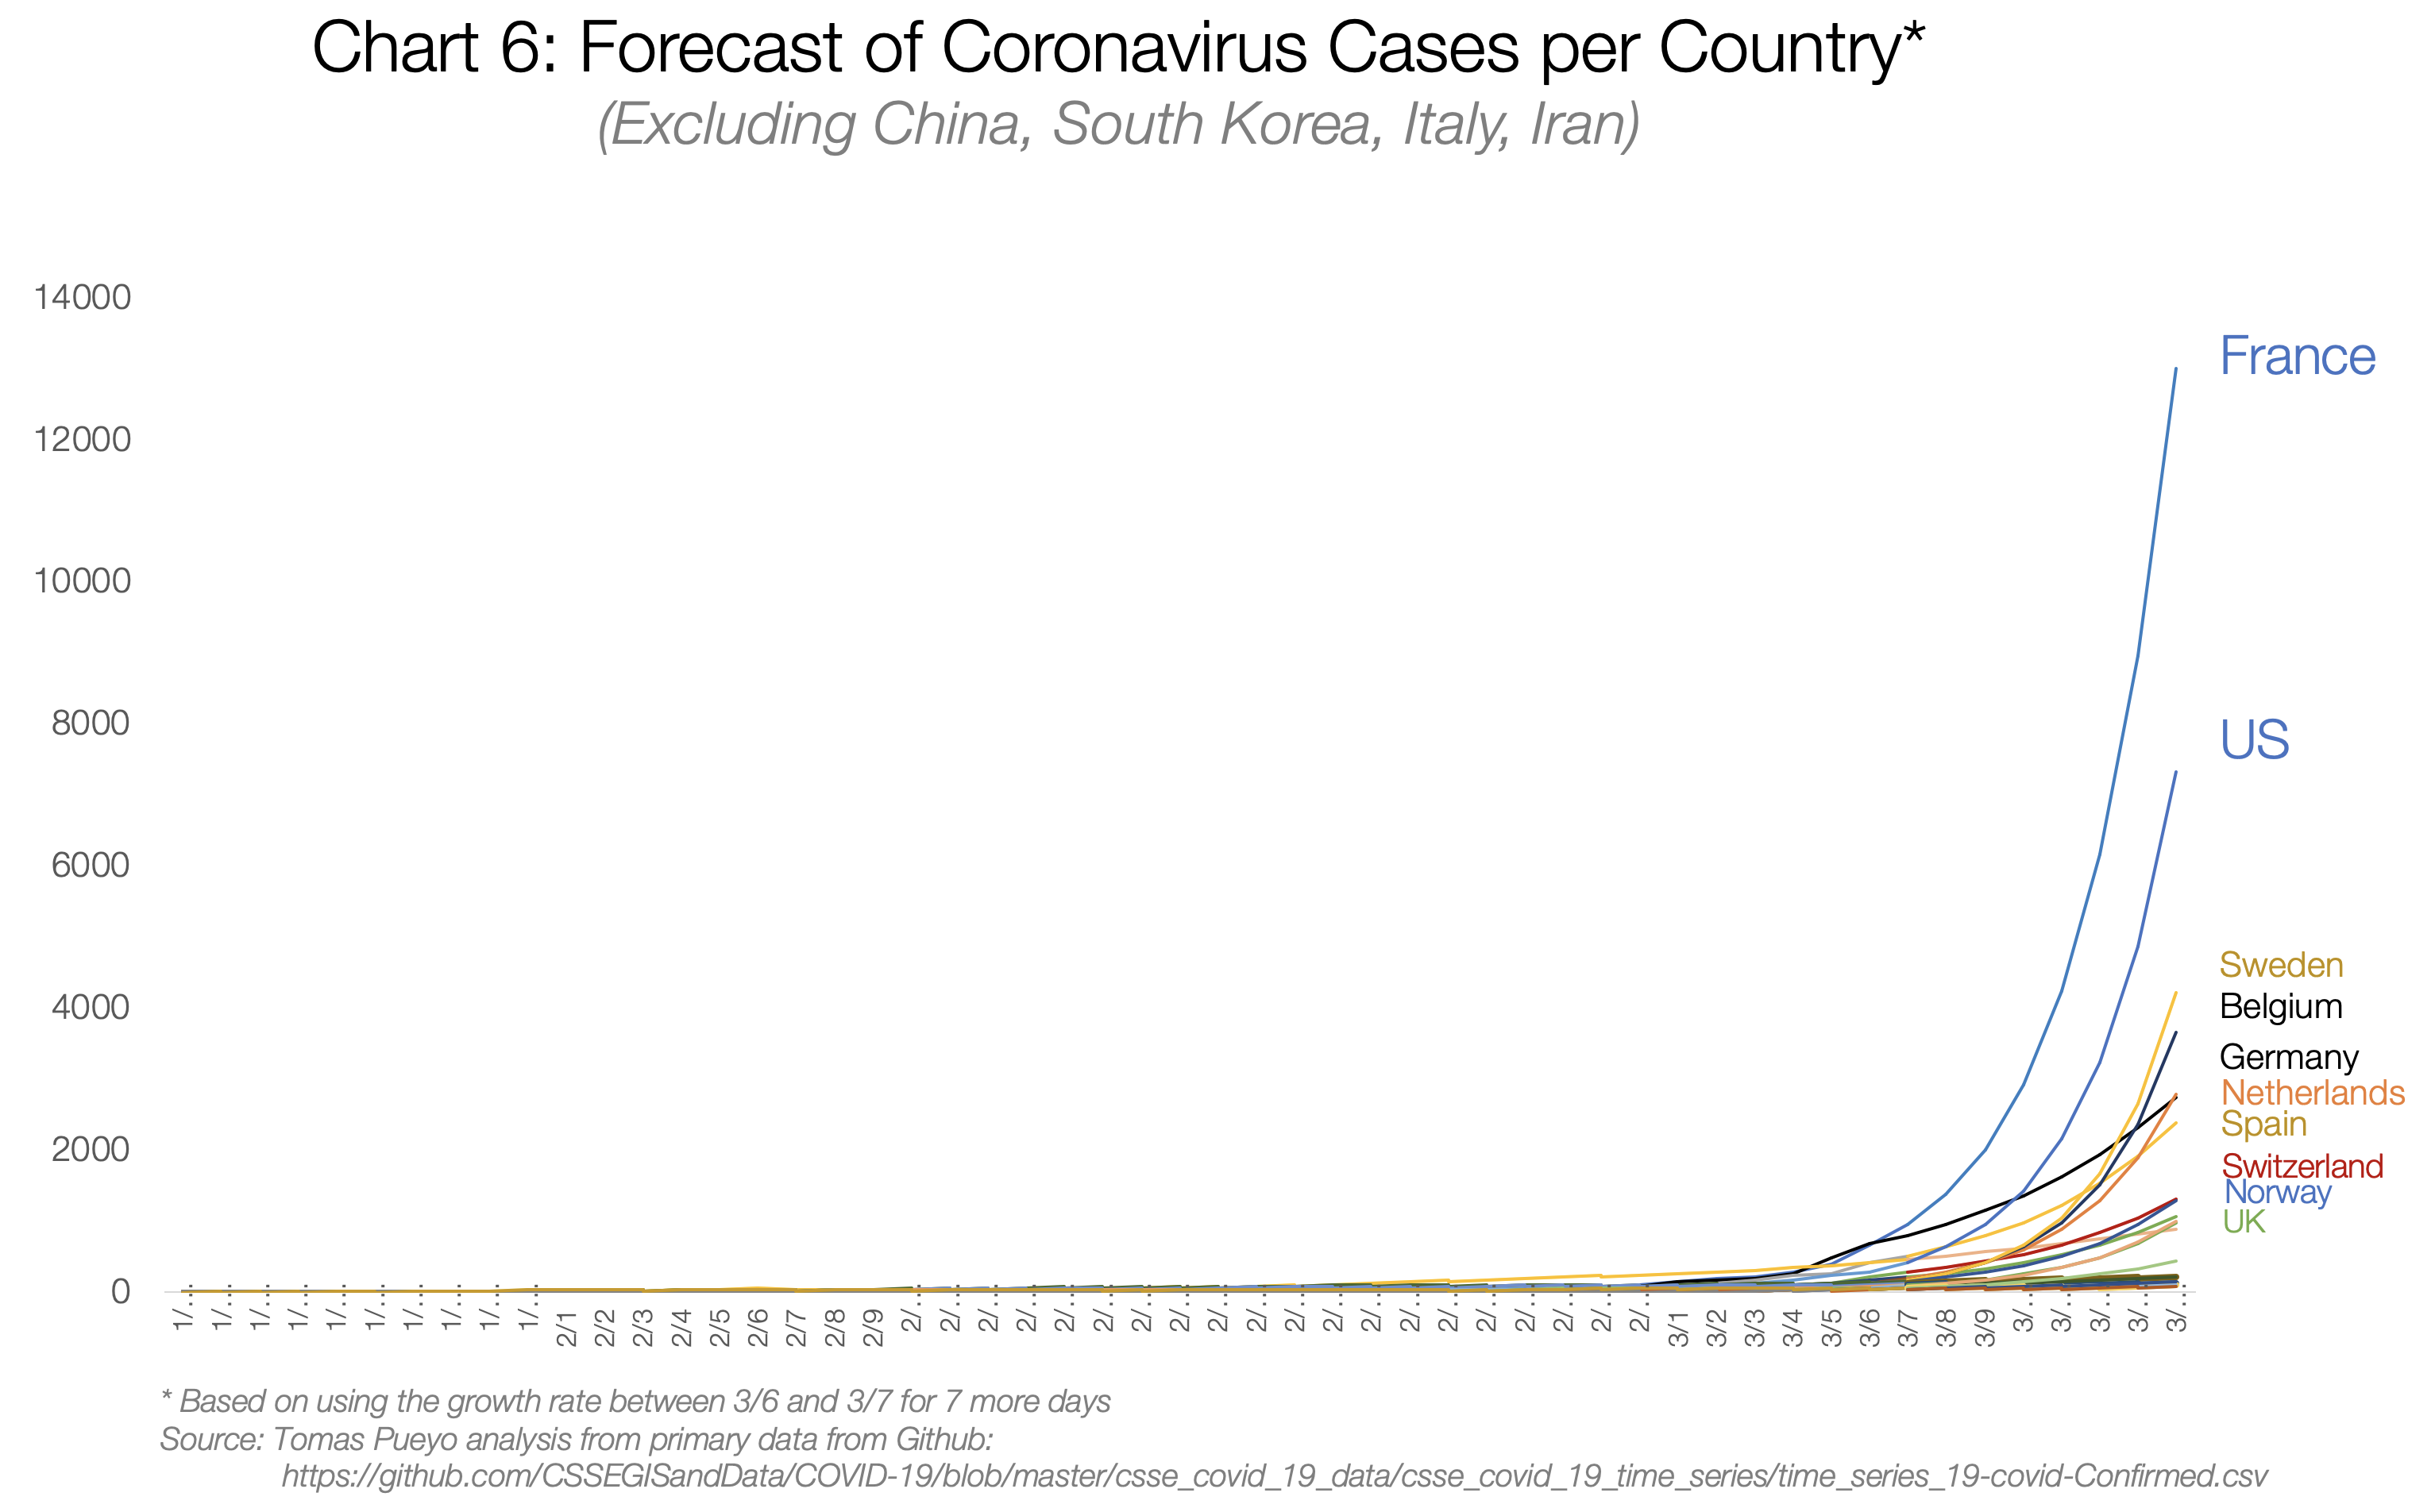
If you can keep up with this growth rate for at least a week, here is what you get:
If you want to understand what will happen - or how to prevent it - you need to look at countries that have already gone through this: these are China, eastern countries with SARS, and Italy.
China
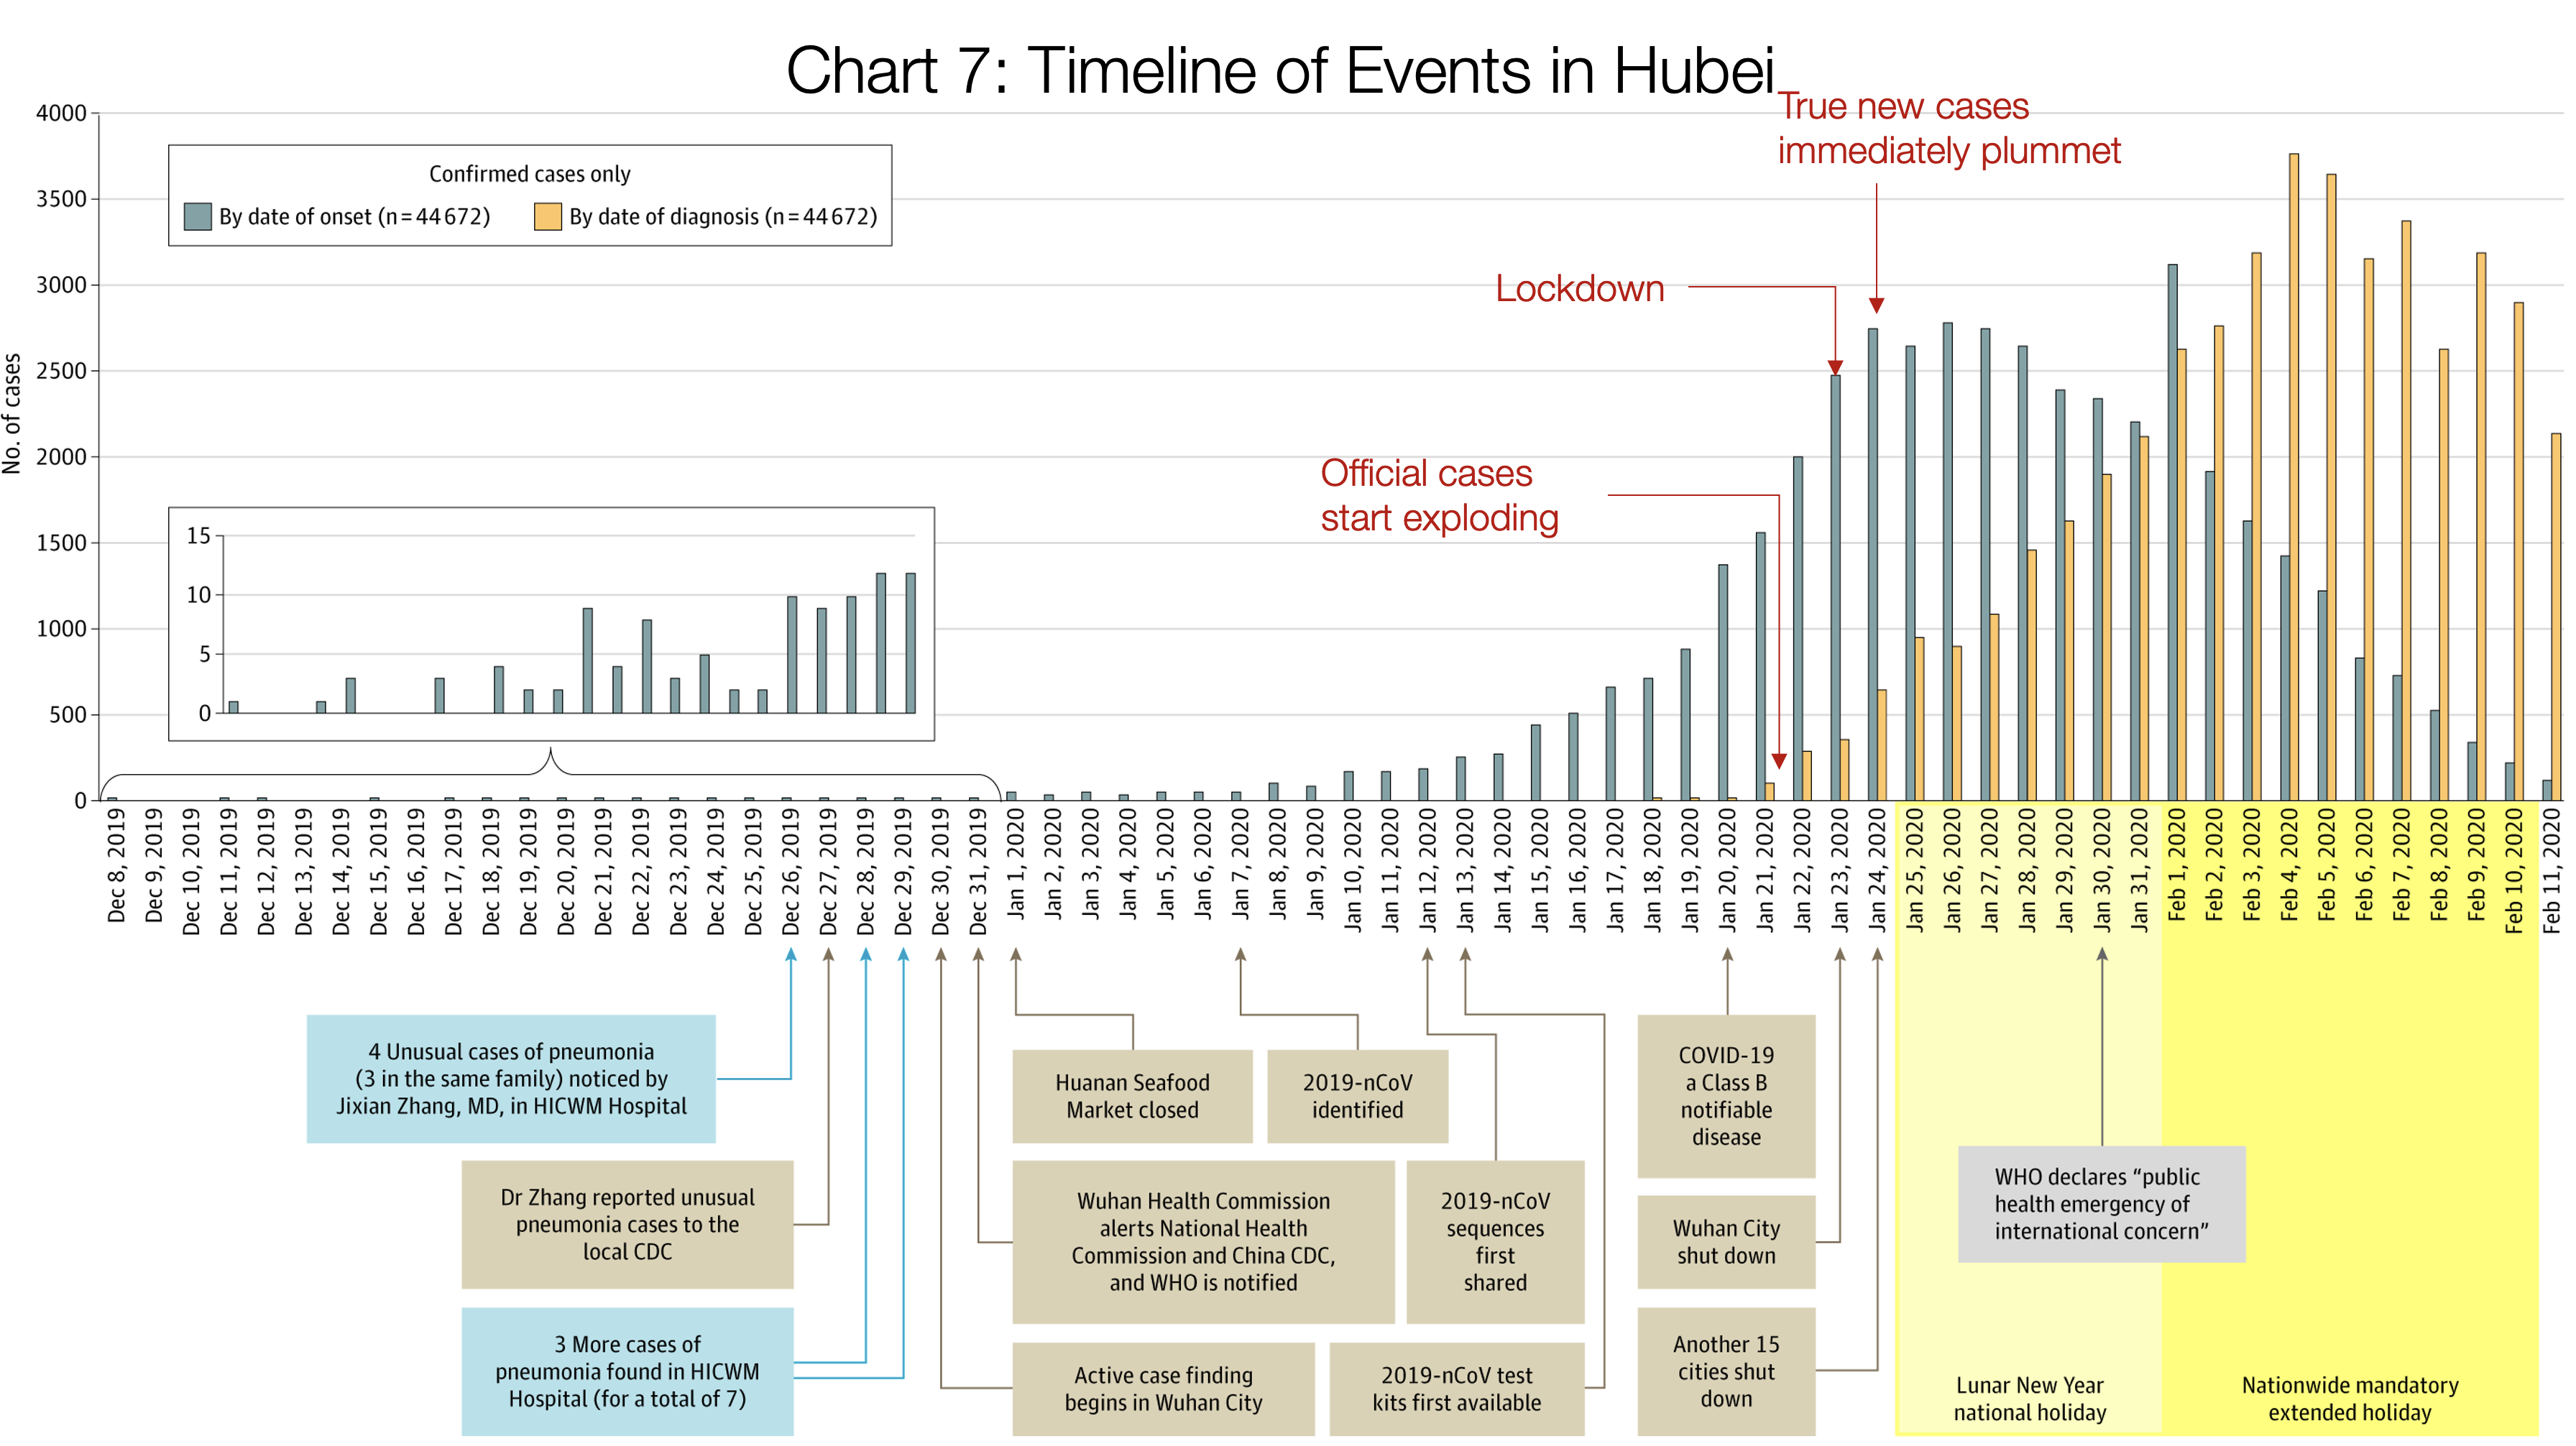
Source: Visual analysis of the author and data from the Journal of the American Medical Association.
This is one of the most important graphs.
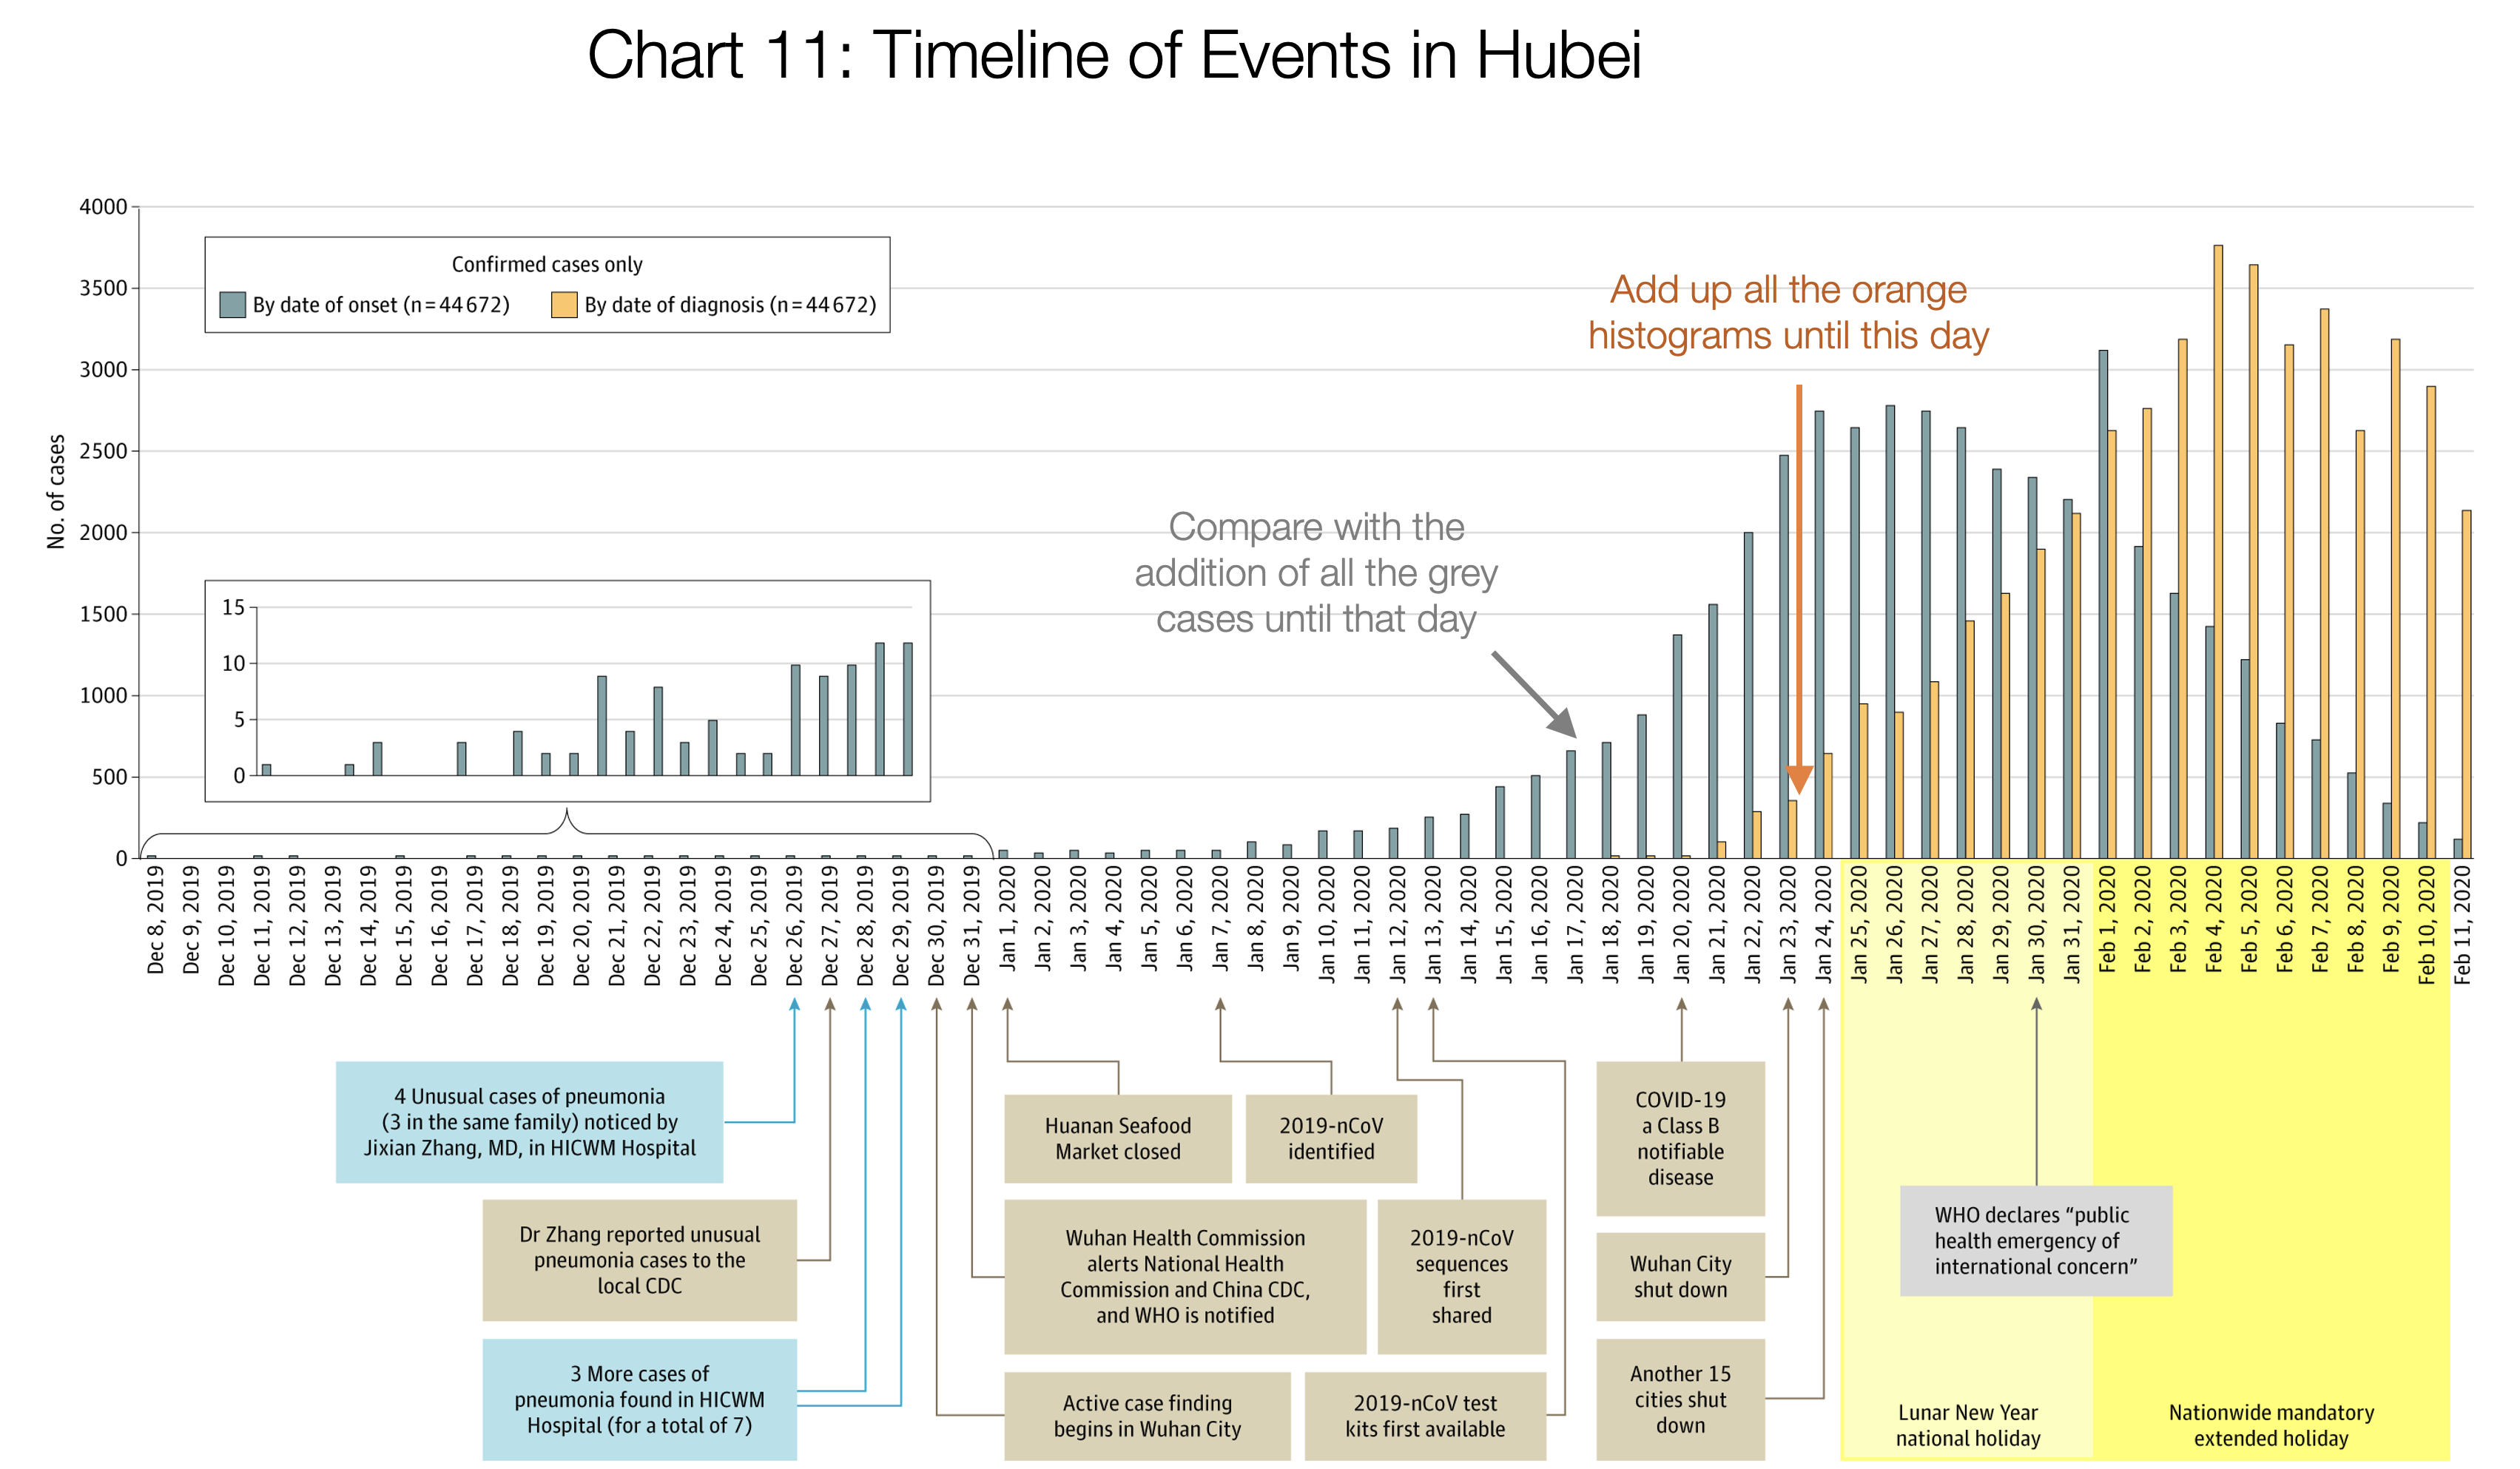
The orange bars show the daily official number of cases in Hubei: how many people were diagnosed that day.
The gray bars show the true daily number of coronavirus cases. It is imperative that they were not known at the time. We can figure them out only by looking back.
Thus, orange shows what the authorities knew, and gray - what really happened.
The number of newly diagnosed cases (orange) takes off on January 21: there are about a hundred of them. In fact, on that day there were 1,500 new cases that grew exponentially. But the authorities did not know about this - they knew that 100 new cases of coronavirus were suddenly discovered.
Two days later, authorities closed Wuhan. At that time, the number of new cases diagnosed daily was about 400. Pay attention to this figure: they decided to close the city for only four hundred new cases per day. In fact, there were 2,500 new cases that day, but they did not know.
The next day, another 15 cities in Hubei Province closed.
Take a look at the gray graph until January 23, when Wuhan was still open: it is growing exponentially, the number of cases is increasing at a monstrous rate. Once Wuhan is shut down, growth slows. On January 24, when another 15 cities closed, the growth in the true number of diseases (we are still talking about gray bars) stopped. Two days later, the maximum number of new cases was reached, and since then it has been falling.
Note that the orange (official) cases were still growing exponentially, and for 12 days it might have seemed like the epidemic had explosive growth. In fact, this is not true - just the symptoms became stronger and more often people went to the doctor, and the system for detecting the disease became more effective.
This concept of formal cases and true cases is very important. Let's remember her and come back to her later.
The remaining regions of China were well coordinated by the central government, so they took immediate and decisive action. This is the result:
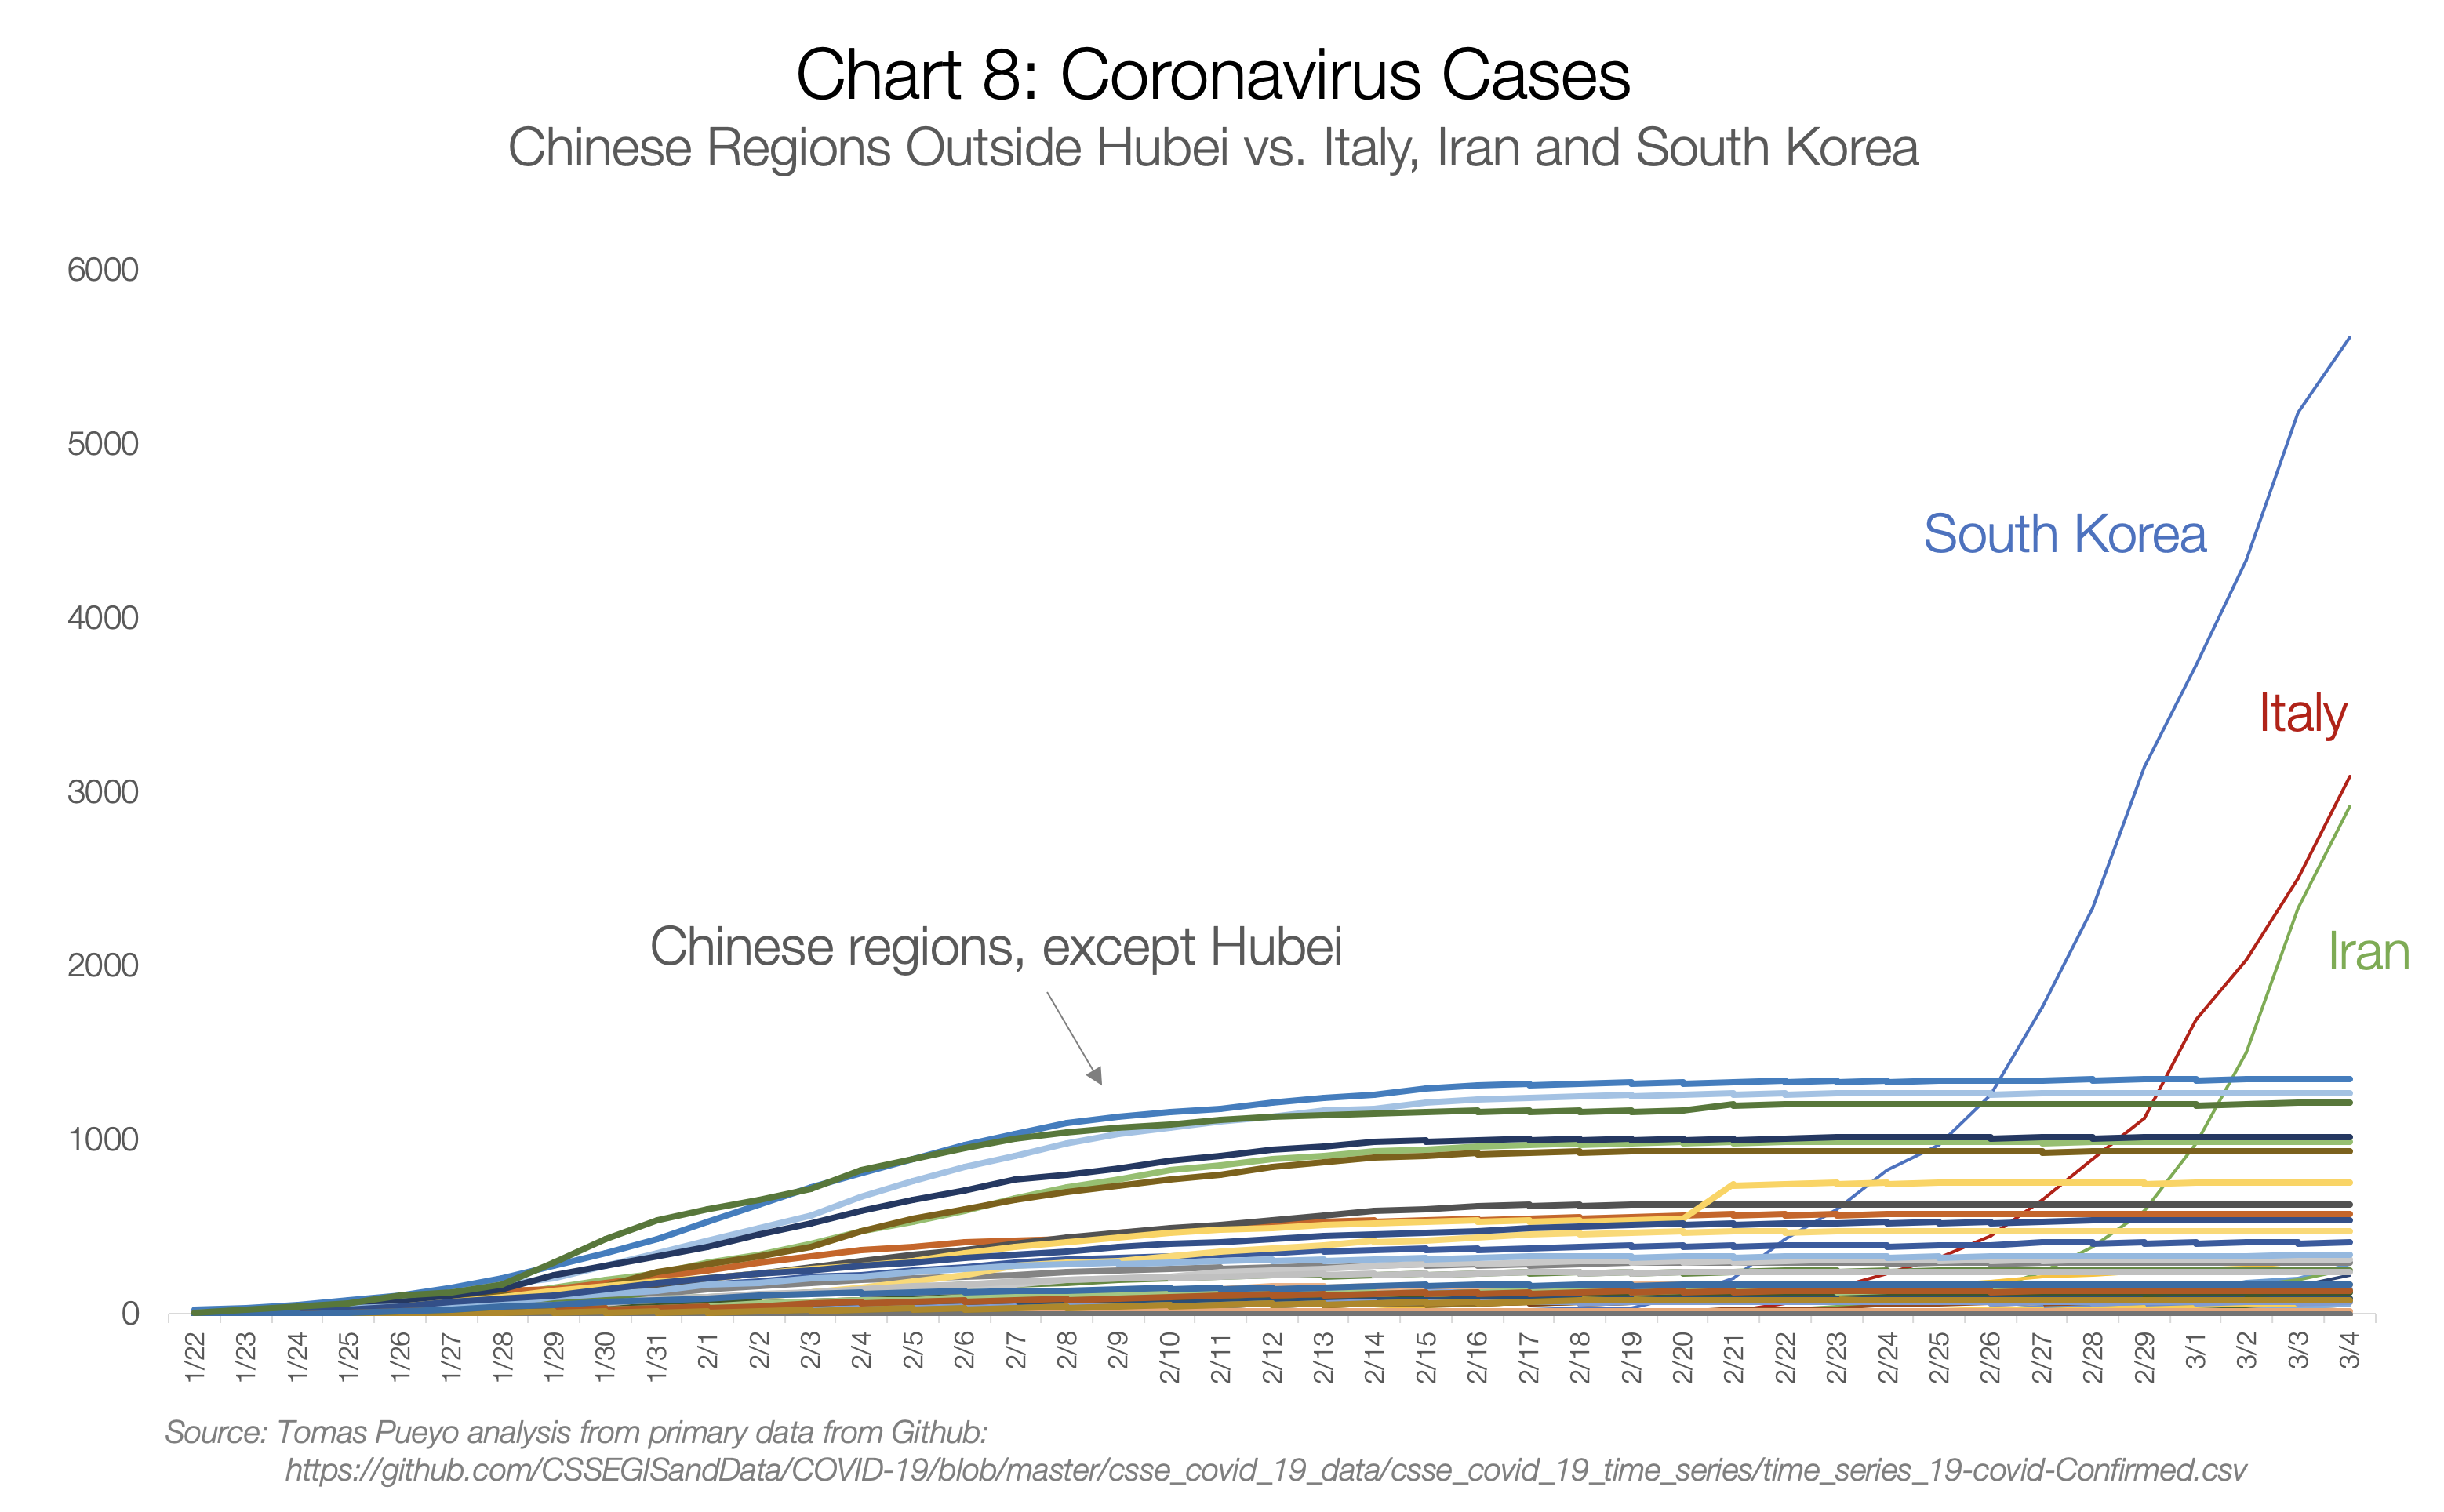
Each flat line is a Chinese region with cases of coronavirus. Any of them had a chance to become exponential, but thanks to measures taken at the end of January, they all stopped the virus before it could spread.
Meanwhile, South Korea, Italy and Iran had a whole month to learn from someone else's example, but they did not. Starting with the same exponential growth as Hubei, they overtook all Chinese regions by the end of February.
Eastern countries
Crazy growth has occurred in South Korea - but it is curious why this did not happen in Japan, Taiwan, Singapore, Thailand or Hong Kong?
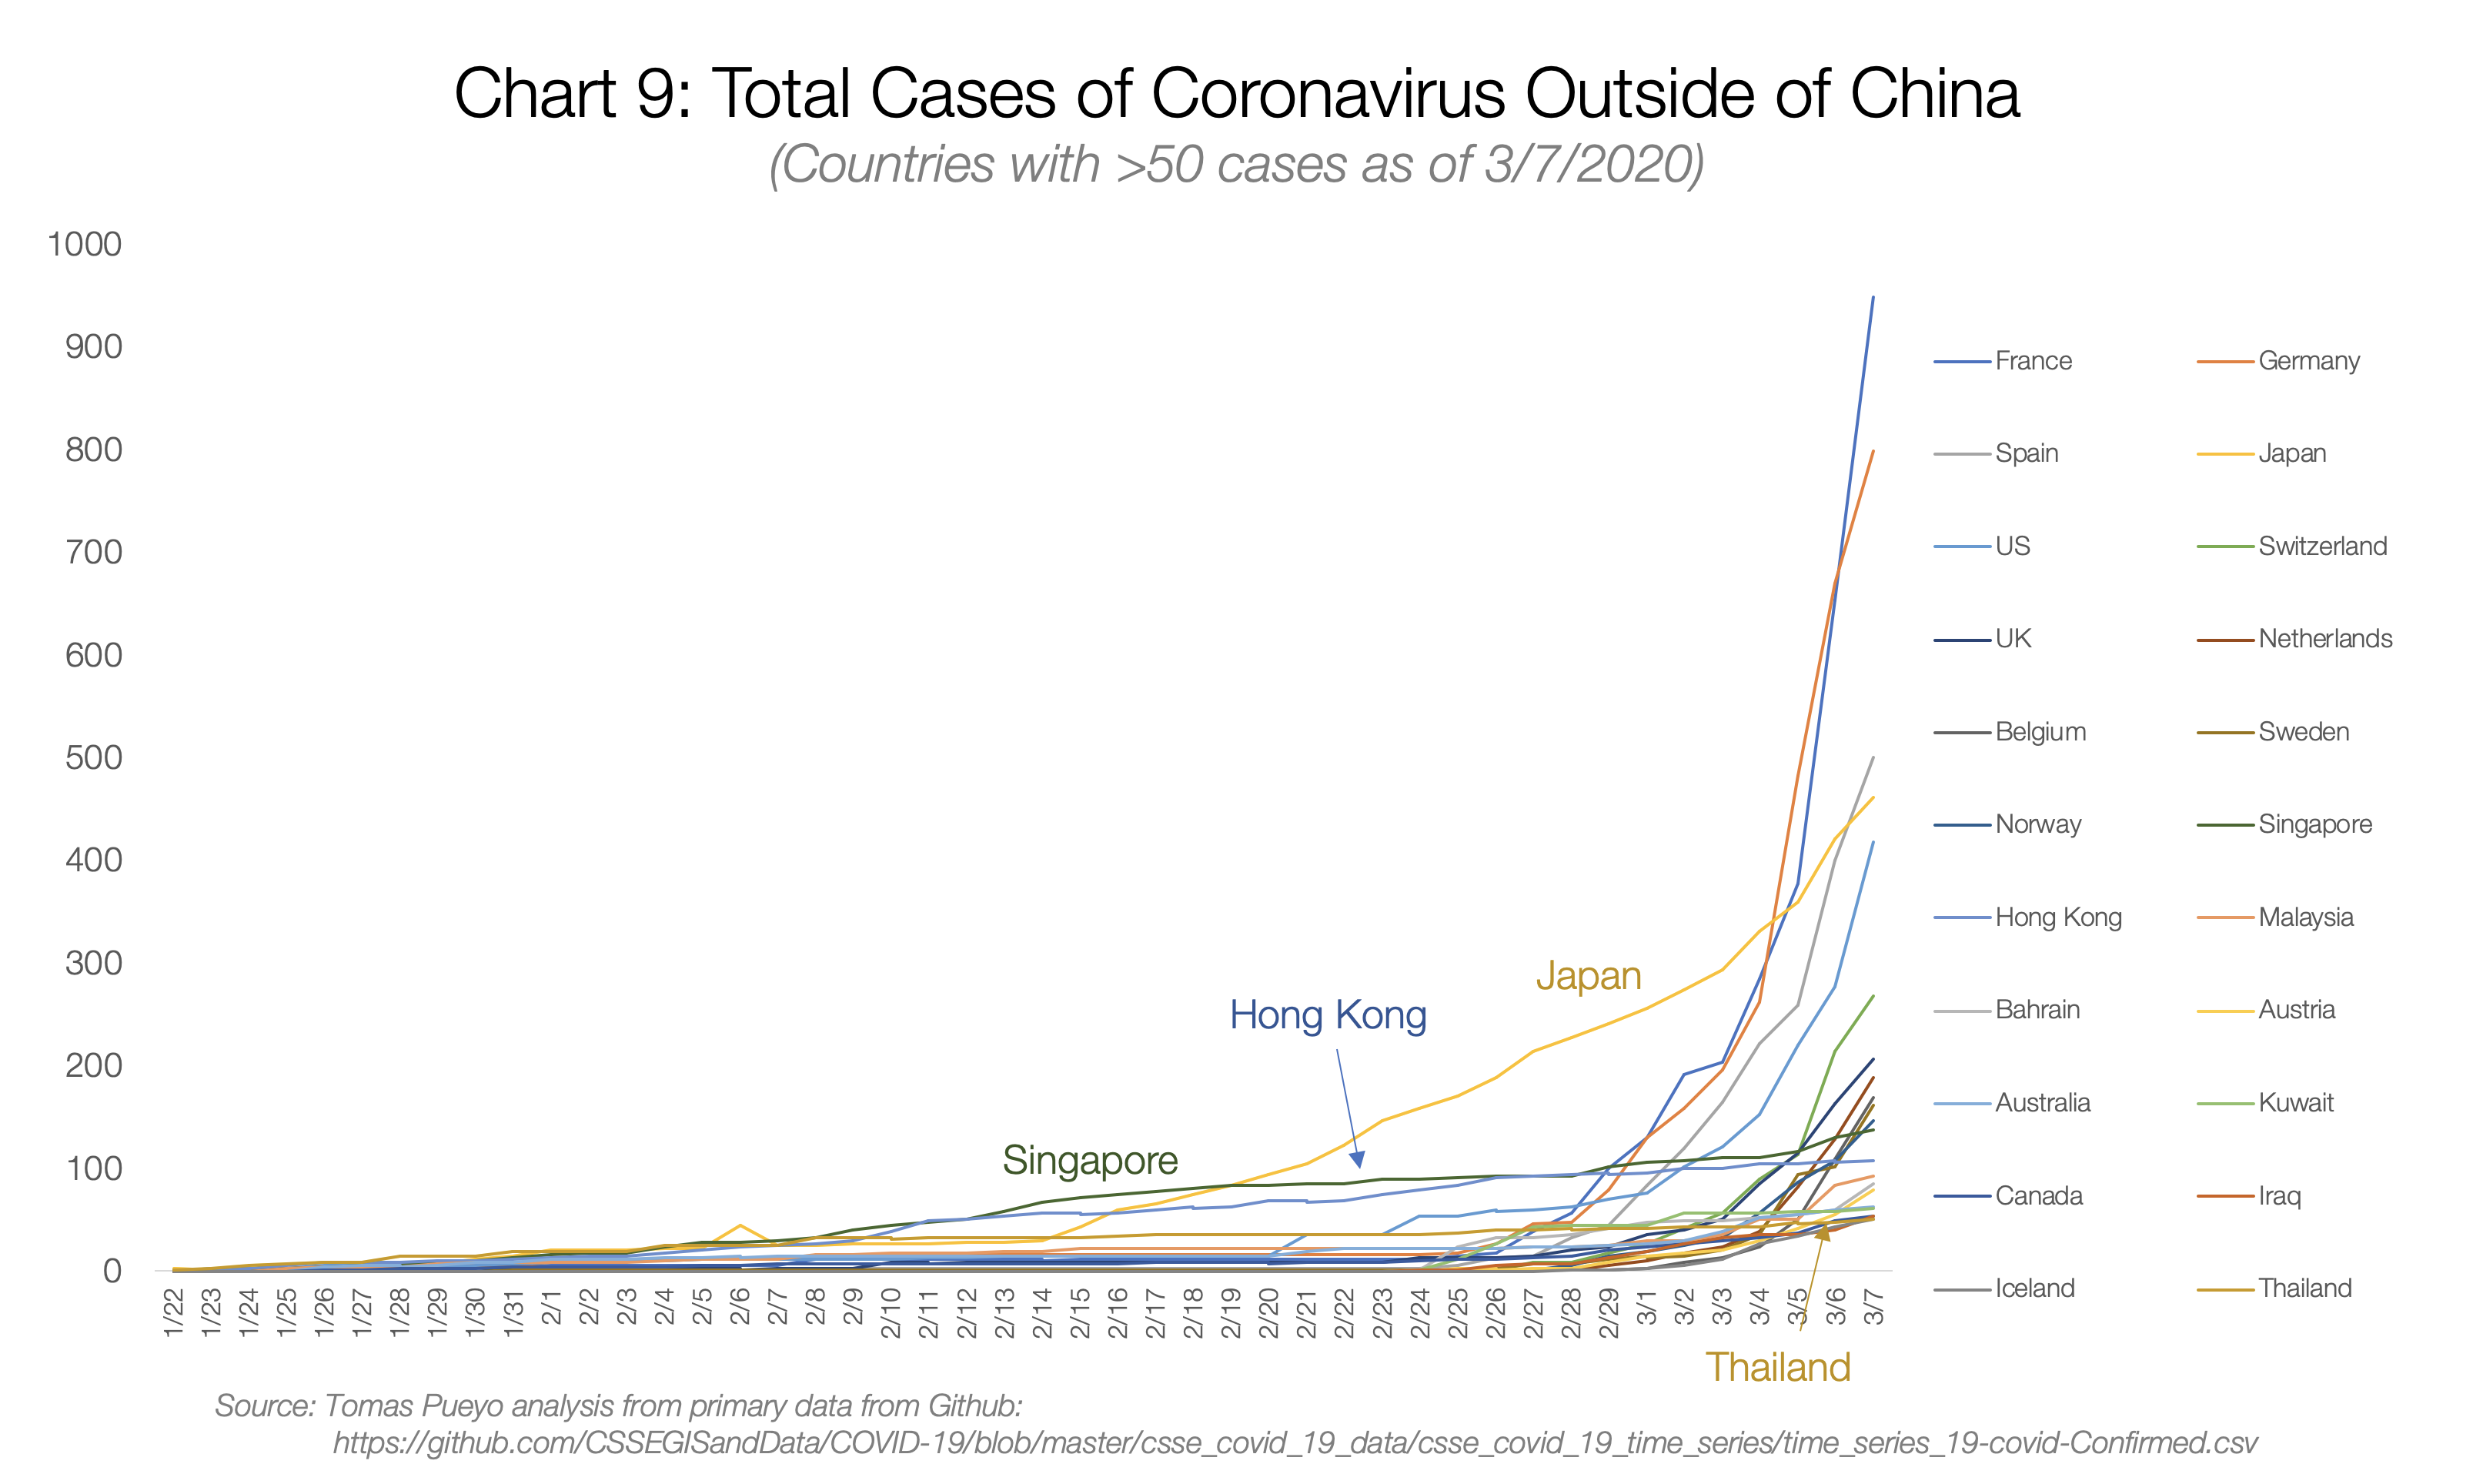
Taiwan is not even on the chart, as it has not crossed the threshold of 50 cases chosen for visualization.
All of these countries suffered from SARS in 2003, and they all learned something. Upon learning how viral and deadly a disease could be, they understood that they needed to be taken seriously. Therefore, their graphs, despite the fact that they began to grow much earlier, still do not look like exhibitors.
So, we have stories about outbreaks of coronavirus, about how governments realized the threat and contained them. For the rest of the countries, however, the story will be completely different.
Before I move on to them, a note on South Korea: this country is probably an exception. Coronavirus was restrained in the first 30 cases of disease, but patient number 31 turned out to be a super-distributor that transmitted the virus to thousands of others. Since the spread occurs before the symptoms manifest, by the time the authorities realized the problem, the virus was already free. Now they are paying for the consequences of this incident, but their containment efforts are showing their effectiveness: Italy has already outstripped it in the number of cases, and Iran will outstrip it on March 10th.
USA. Washington state
You have already seen growth in Western countries, and you know how depressing forecasts look just one week in advance. Now imagine that deterrence does not happen like in Wuhan or other eastern countries, and you will get a colossal epidemic.
Let's look at a few cases, such as in the state of Washington, in the Bay Area of San Francisco, in Paris and in Madrid.
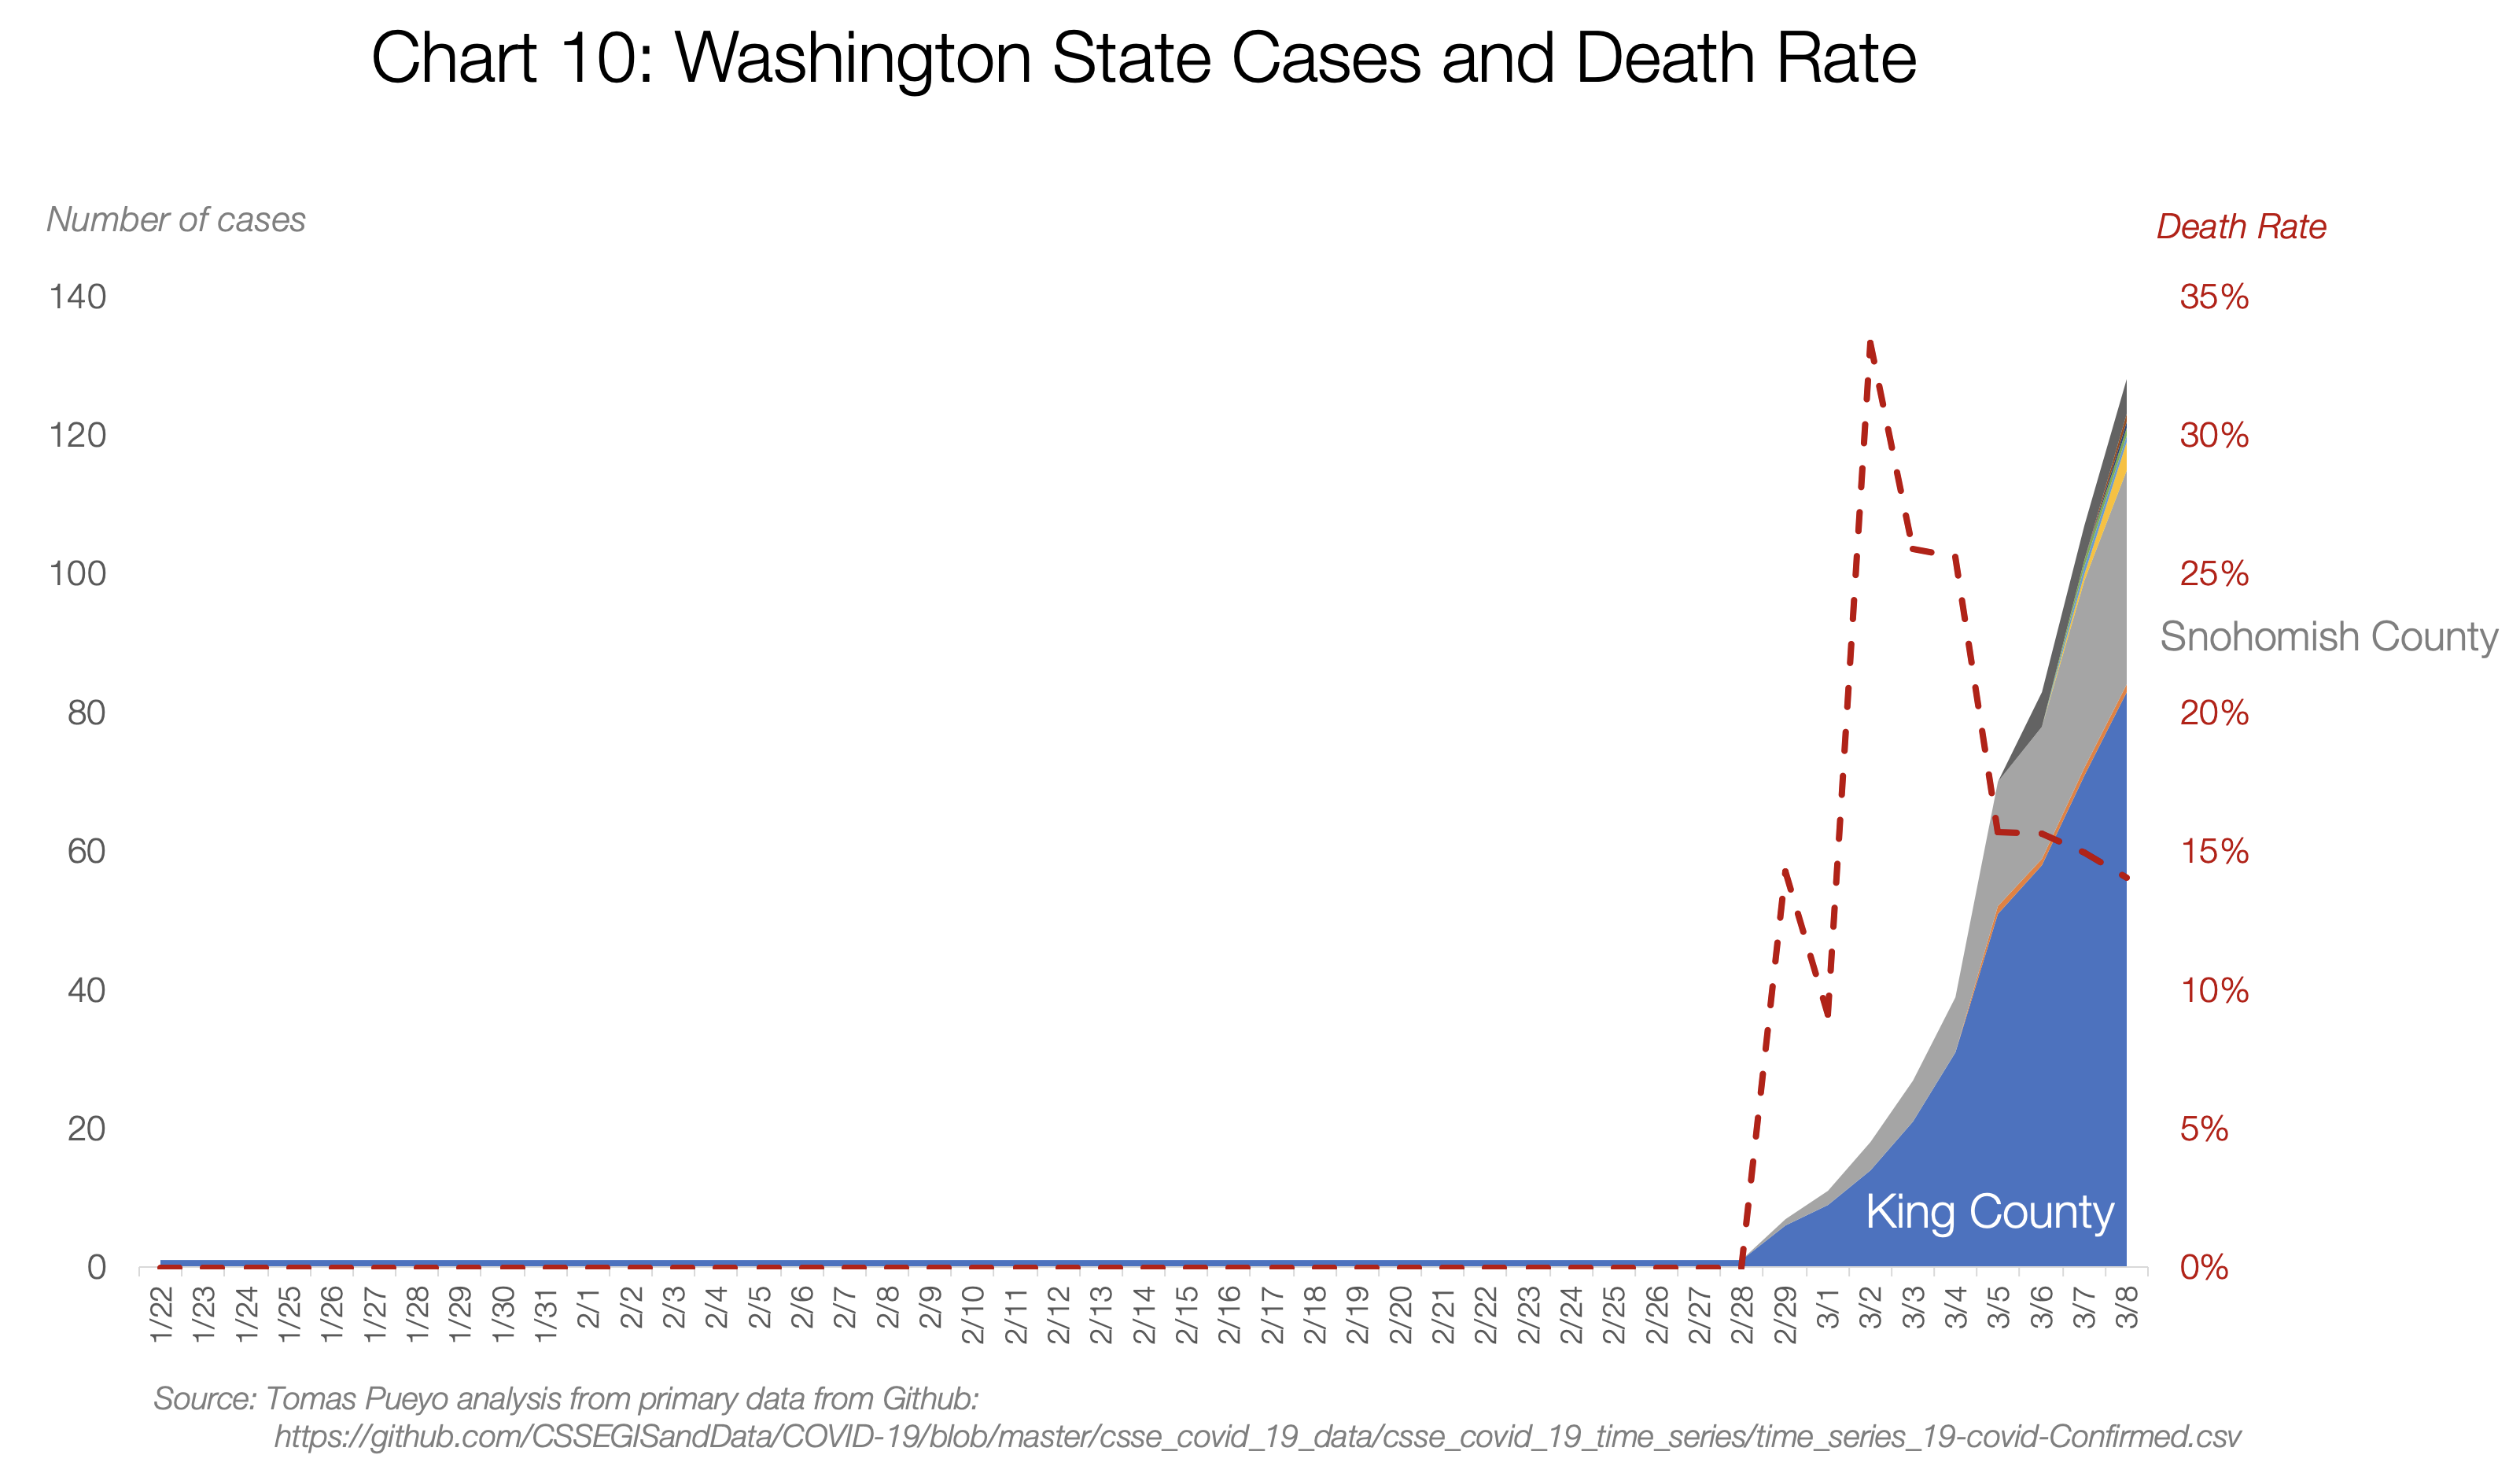
Washington State is Wuhan. The number of cases there is growing exponentially, and now it is 140.
But the most interesting thing happened at the very beginning - the lethality was outrageous, at some point in the state there were three cases and one death. From other places we know that mortality in coronavirus is from 0.5% to 5% (more on this later). How could it be equal to 33%?
It turns out that the virus spread undetected for weeks. It does not seem that there were only three cases - rather, the fact is that the authorities knew only about three, and one of them was dead, because the more serious the condition, the greater the likelihood that someone will be tested for the virus.
This is a bit like our orange-gray columns in China: here they knew only about orange (official) cases and looked good (only three). But in reality there were hundreds, maybe thousands of real cases.
This is the difficulty: you know only the official state of affairs, but not the true one. You need to find out what is really happening. How to estimate the true number of cases? It turns out there are a couple of ways. And I have a model for both , so you can play with numbers too (heredirect link to copy the model).
First, through deaths. If there are deaths in your area, you can use their number to estimate the number of true current cases. We know approximately how much time it takes on average to die from the time the virus is received - it's 17.3 days . It turns out that the man who died on February 29 in Washington State became infected around February 12.
In addition, mortality is known. In this scenario, 1% is used (we will discuss the details later). This means that around February 12 there were already about a hundred cases in the region, and only one of them ended in death 17 days later.
Now use the average case doubling time for coronavirus - it's 6.2 days. Thus, in the 17 days before the death of this person, the number of cases should have been multiplied by ≈8 (= 2 ^ (17/6)). It turns out that if you do not diagnose all cases without exception, then only one confirmed death per day means 800 true cases of infection on the same day.
There are 22 dead in Washington state today. Using our rough estimates, we get ≈16000 true cases of coronavirus only today. This is as much as official cases in Italy and Iran combined.
If we study the details, we will understand that 19 of these deaths were from one cluster, which, perhaps, did not spread the virus on a large scale. If we consider these 19 deaths as one, then the total number of deaths in the state will be four - updating the calculations for this number, we still get ≈3000 cases today. Trevor Bedford
's approach examines the viruses themselves and their mutations to assess the current number of cases.
The conclusion is that in the state of Washington now, most likely, ≈1100 cases.
None of these approaches is perfect, but they all point to the same thing: we do not know the true number of cases, but it is definitely much higher than the official one. Not hundreds of times higher, but thousands or more higher.
USA. San Francisco Bay Area
Until March 3, there were no deaths in the San Francisco area. Because of this, it was difficult to estimate the number of true cases. The official number was 86, but the United States estimate is underestimated, because there are not enough test kits for detecting coronavirus. It was decided to create my own test suite, but it turned out that it did not work .
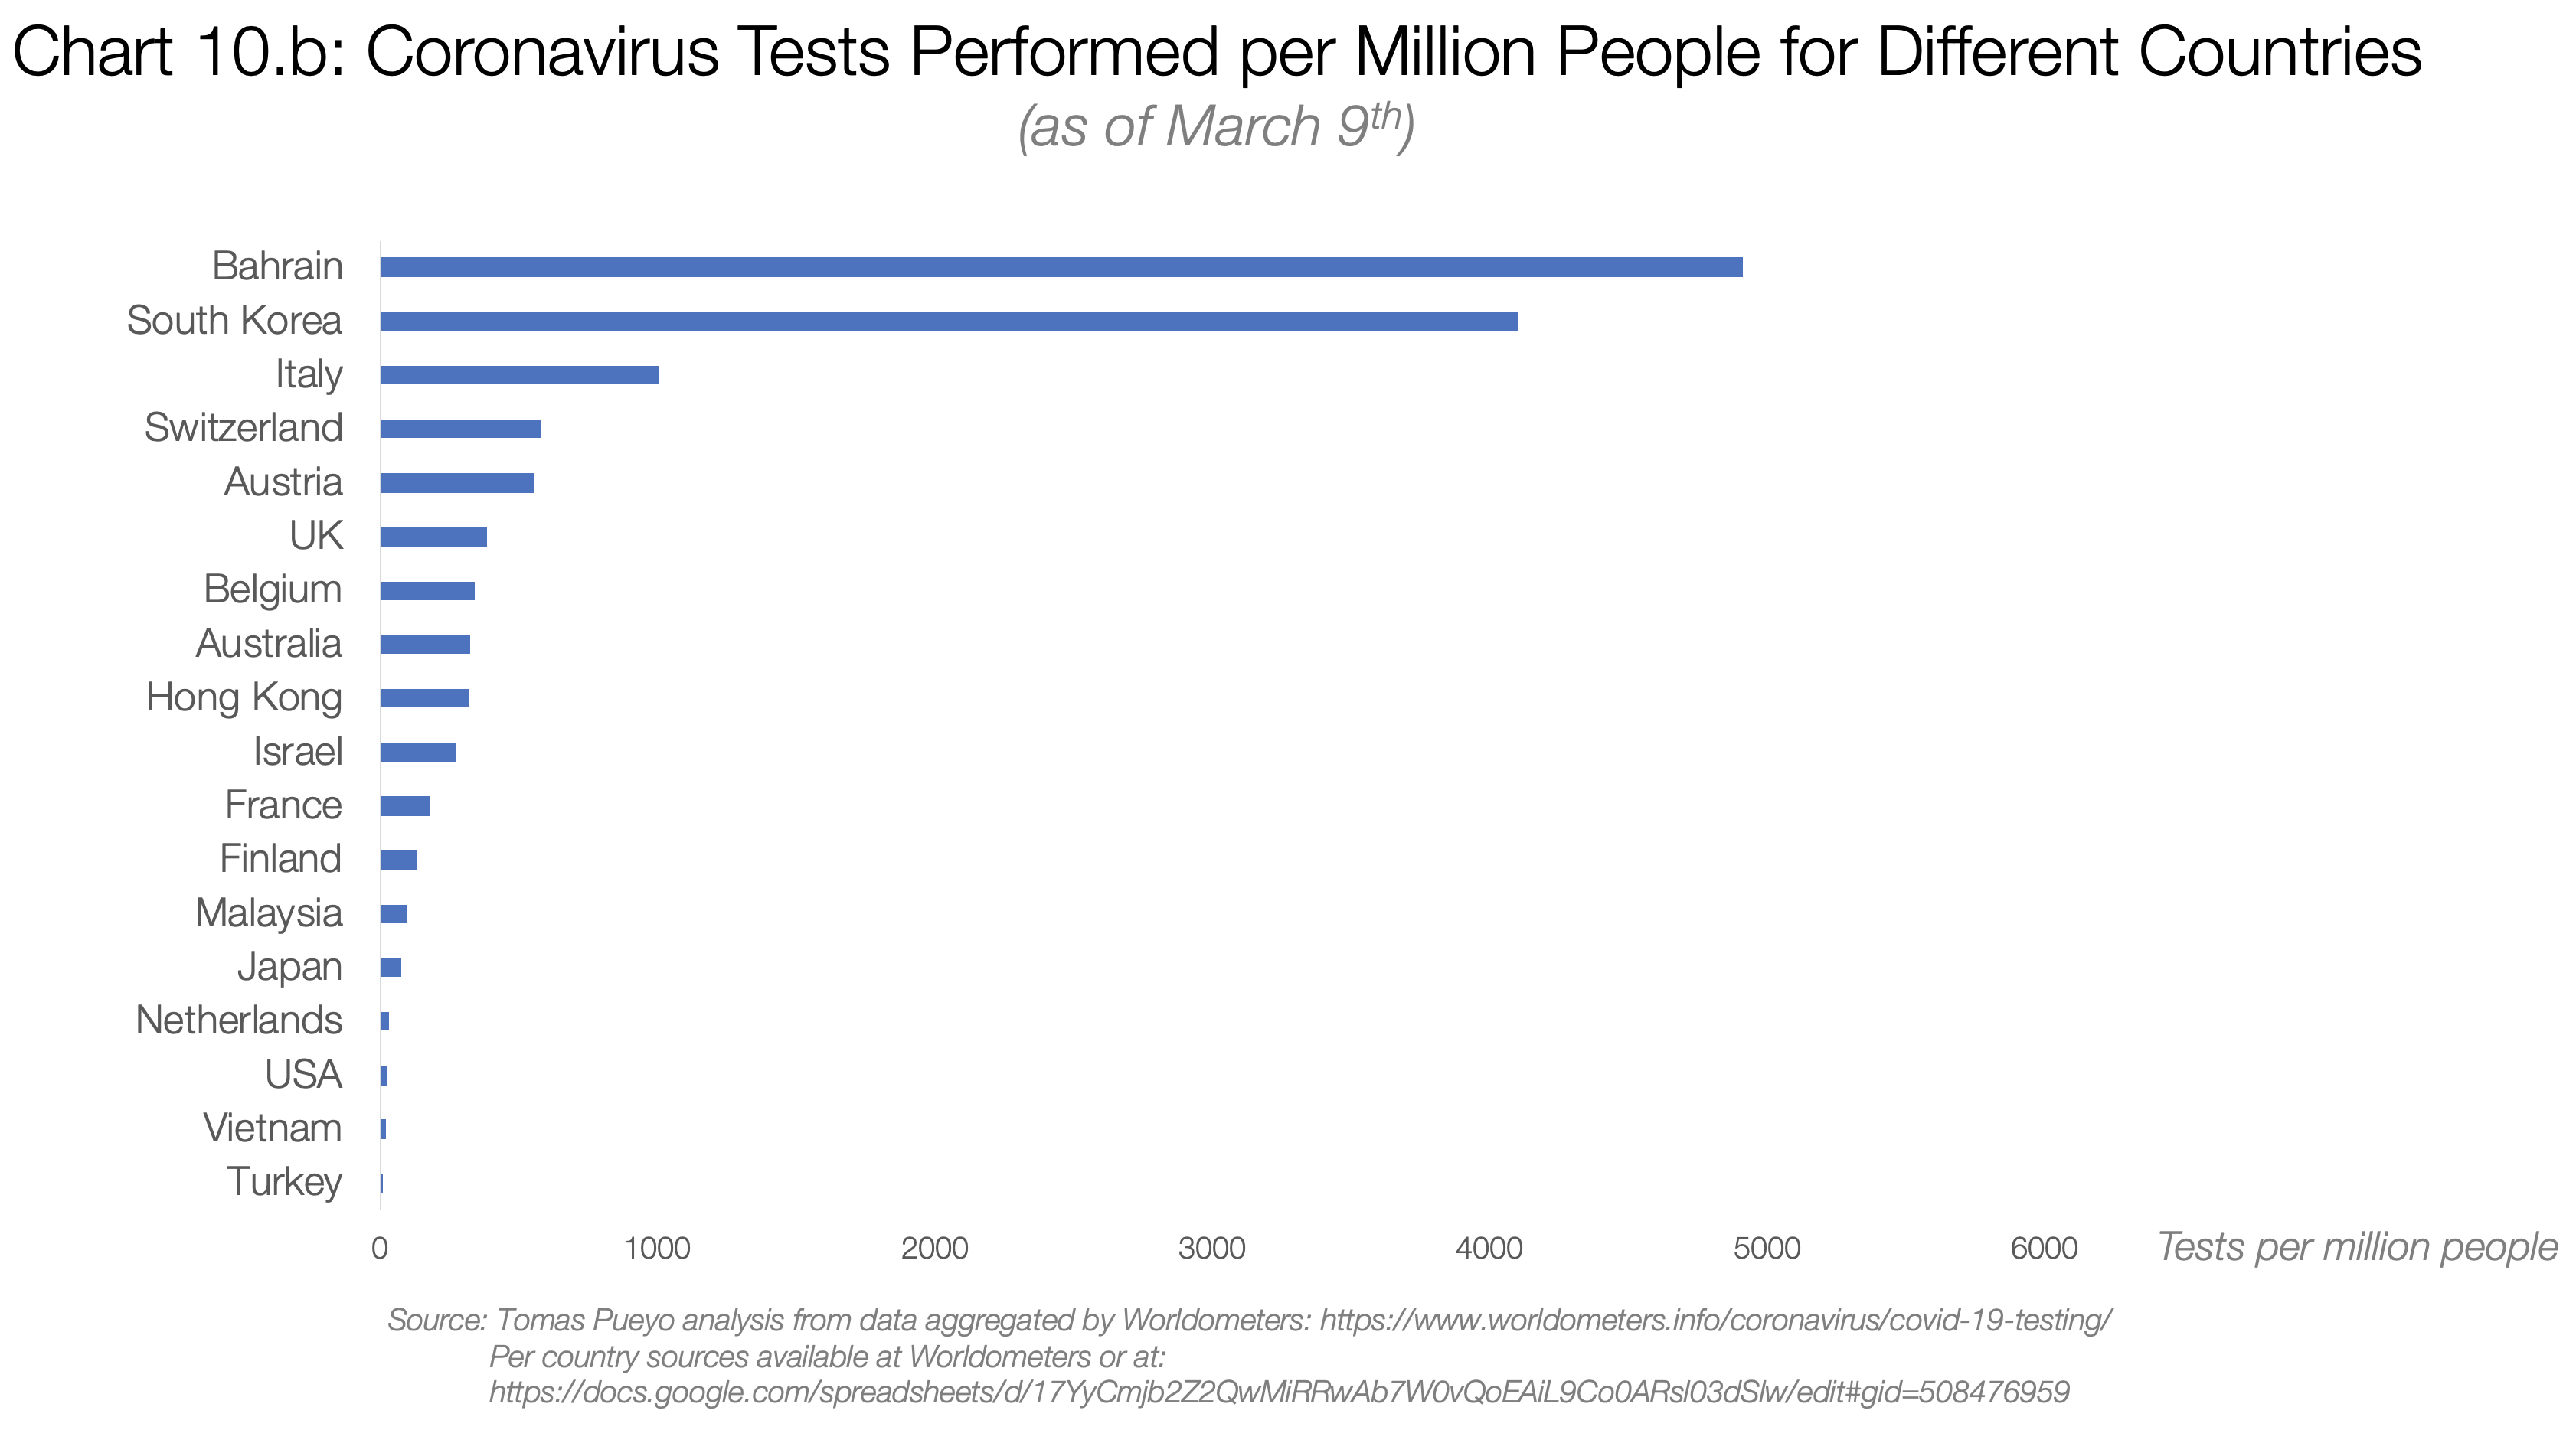
This was the number of tests conducted in different countries by March 3:
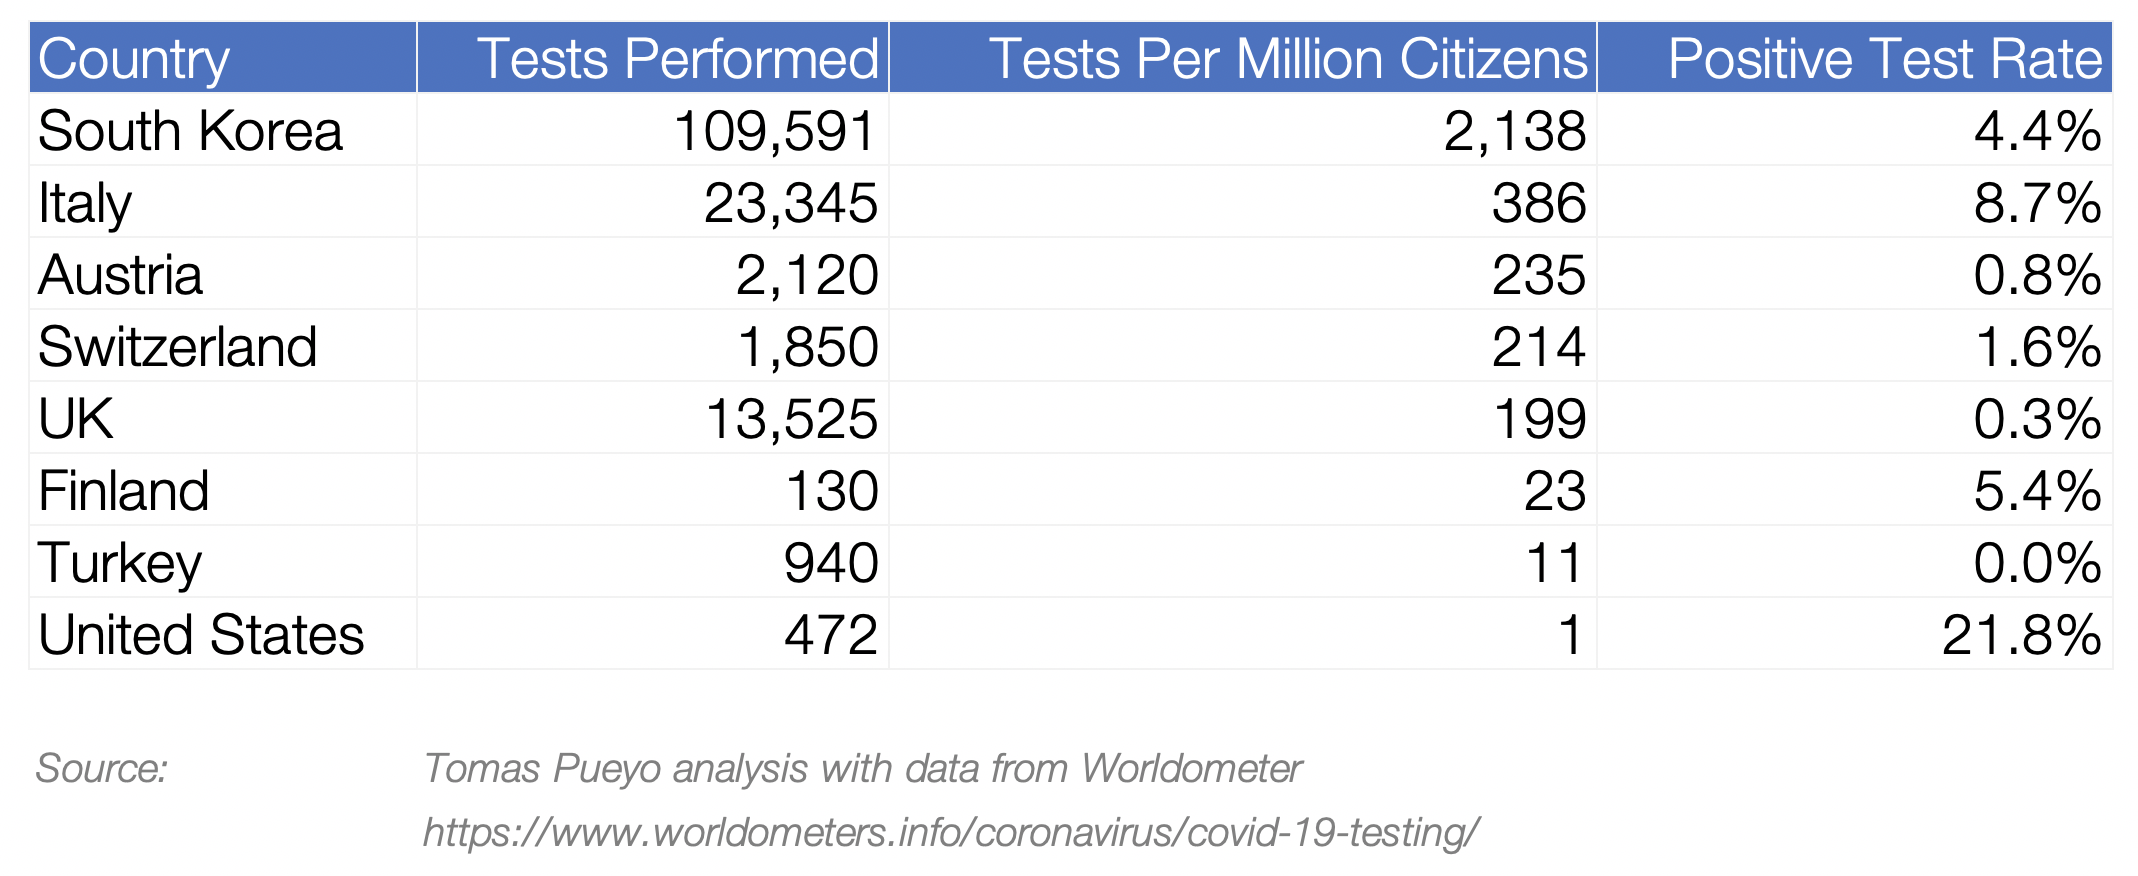
Sources of these data
In Turkey, where there was not a single case of coronavirus, testing per inhabitant was performed 10 times more often than in the United States. Today, the situation is not much better: in the USA, ≈8000 tests were carried out , but in total ≈4000 people were tested.
In this case, you can simply use the ratio of the number of official cases to the number of true ones. How to decide which one? In the San Francisco Bay area, everyone who traveled or contacted the traveler was tested, which means that most of the cases caused by travel came to the attention of the authorities, but not a single case of infection through society. By imagining how common coronavirus spreads are in the community compared to travel spreads, you can estimate how many true cases were.
I looked at this ratio for South Korea, which publishes excellent statistics. By the time there were 86 cases, 74 of them were caused by infection through society, that is, 86% (the number 86 is not special, this is a coincidence).
Using this number, you can calculate the number of true cases. If 86 cases have been identified in the San Francisco Bay area today, then most likely the true number will be ≈600.
France. Paris
Today, France claims 1,400 cases and 30 deaths. Using the two methods above, you can get the range of the true number of cases: from 24,000 to 140,000 .
The true number of coronavirus cases in France today is most likely between 24,000 and 140,000.
Let's stop for a second: the true number of cases in France is most likely one or two orders of magnitude more than officially recorded.
Can't believe it? Let's take another look at the Wuhan chart.
Source: visual analysis of the author and data from the Journal of the American Medical Association
If you add up the orange bars until January 22, you get 444 cases; if you add gray bars, you get ≈12000. It turns out that when in Wuhan they thought about 444 patients, they were 27 times more. If now in France it is believed that they have 1,400 cases, there could well be tens of thousands of them ...
The same math applies to Paris. With ≈30 official cases in the city, the true amount is likely to be in the hundreds, if not thousands. With 300 cases detected in the Ile-de-France region, the total number of carriers may already exceed tens of thousands.
Spain. Madrid
In Spain, the indicators are very close to French (1,200 cases were detected versus 1,400, and in both cases 30 deaths). So, similar rules apply: probably in Spain there are already 20 thousand infected.
In the province of Madrid with the capital of the same name, where according to official figures there are 600 infected and 17 deaths, you can estimate the true number of cases - from 10,000 to 60,000.
If you think that this data cannot be true, just think about Wuhan with so many cases have already been locked up.
With as many cases as in the USA, Spain, France, Iran, Germany, Japan or Switzerland, Wuhan was already isolated.
And if you continue to say that Hubei is just one region, let me remind you that almost 60 million people live in it. This is more than in Spain, and approximately comparable to France.
2. What happens when this outbreak of coronavirus occurs?
Well, the coronavirus is already here. It is hidden, but growing exponentially.
What will happen in our countries when it hits? This is easy to find out because there are already places where this happens. The best examples are Hubei and Italy.
Mortality
The World Health Organization (WHO) cites 3.4% as an indicator of mortality (the proportion of people who become infected with coronavirus and then die). This figure is out of context, so let me explain it.
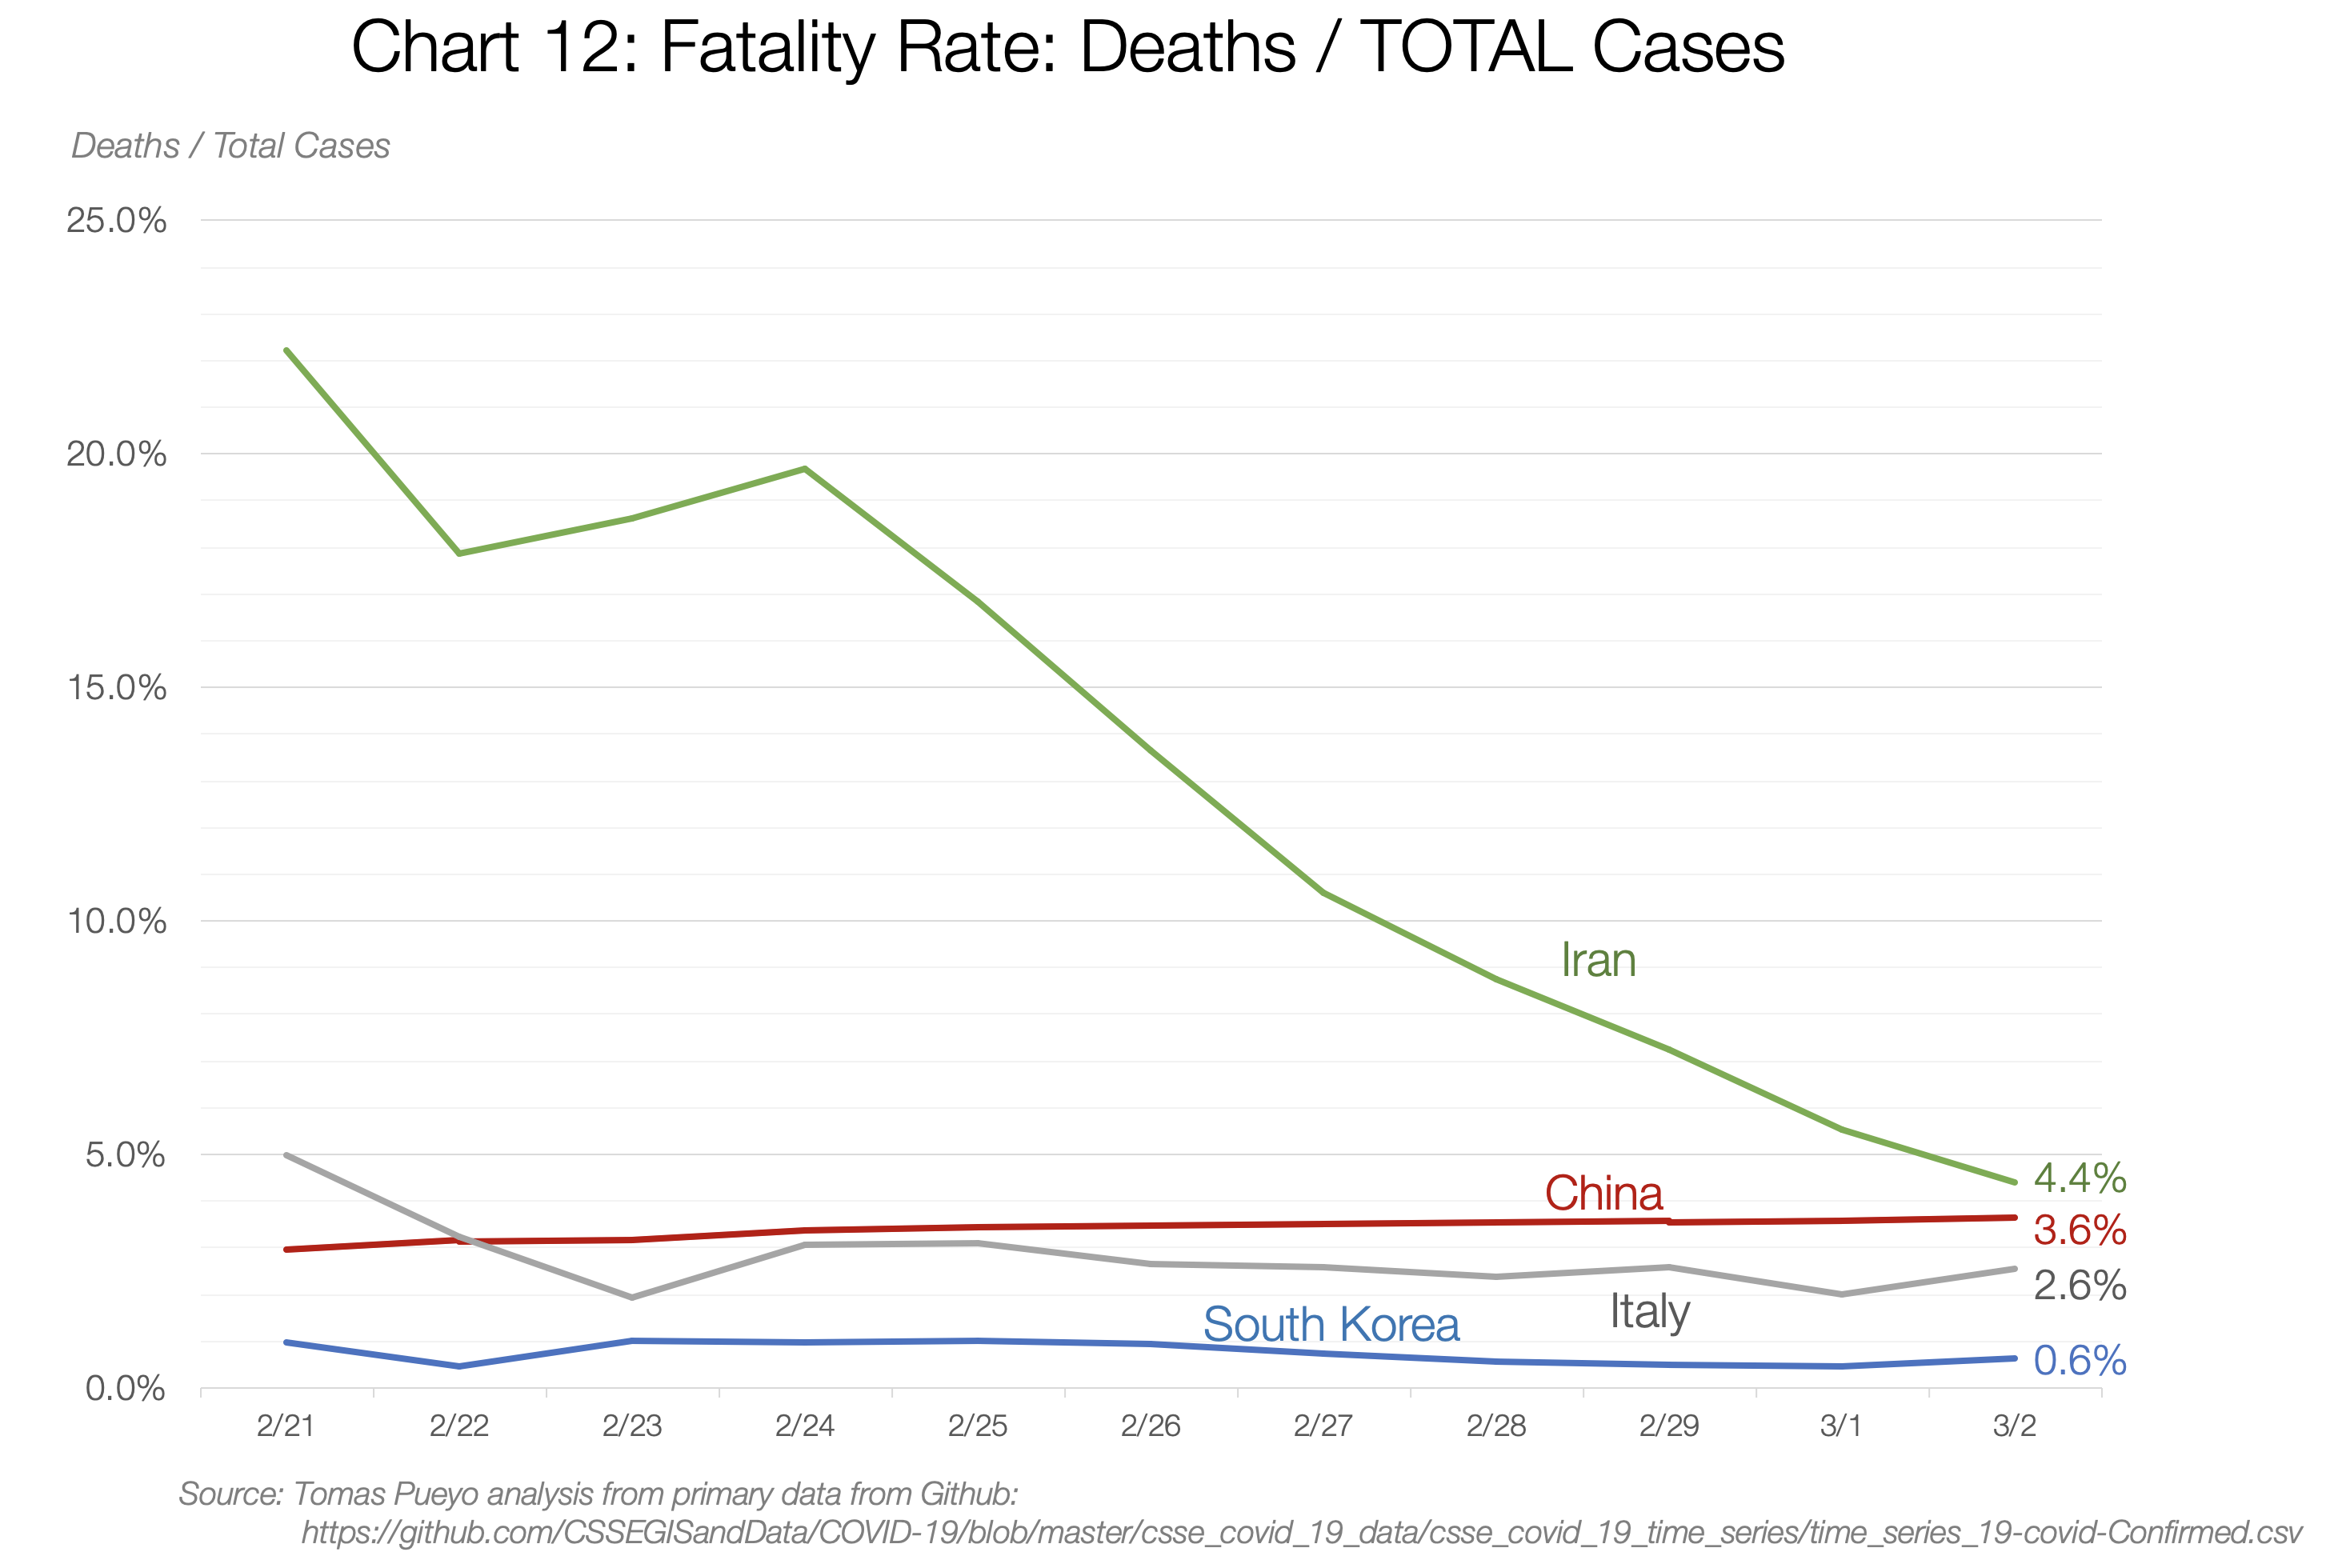
It all depends on the country and time: from 0.6% in South Korea to 4.4% in Iran. What value should you rely on? We can use the trick to figure it out.
Two indicators that can be relied on to assess mortality are those who die to the total number of cases and those who die to the number of people who have recovered. The first estimate is likely to be underestimated, because many of those who are ill can still die. The second method, on the contrary, overestimates the assessment, since there is a likelihood that death will occur faster than recovery.
The trick is to see how both indicators change over time. Their values will come closer until there are no sick people, that is, they will meet at the point “dead to the sick” - so if we extrapolate the observed trends, we can make an assumption about what the final mortality will be.
And this is what the data show. In China, mortality now ranges from 3.6% to 6.1%. If we project trends into the future, they seem to converge in the region of 3.8% –4%. This value is two times higher than the current estimate, and it is also 30 times worse than that of the flu.
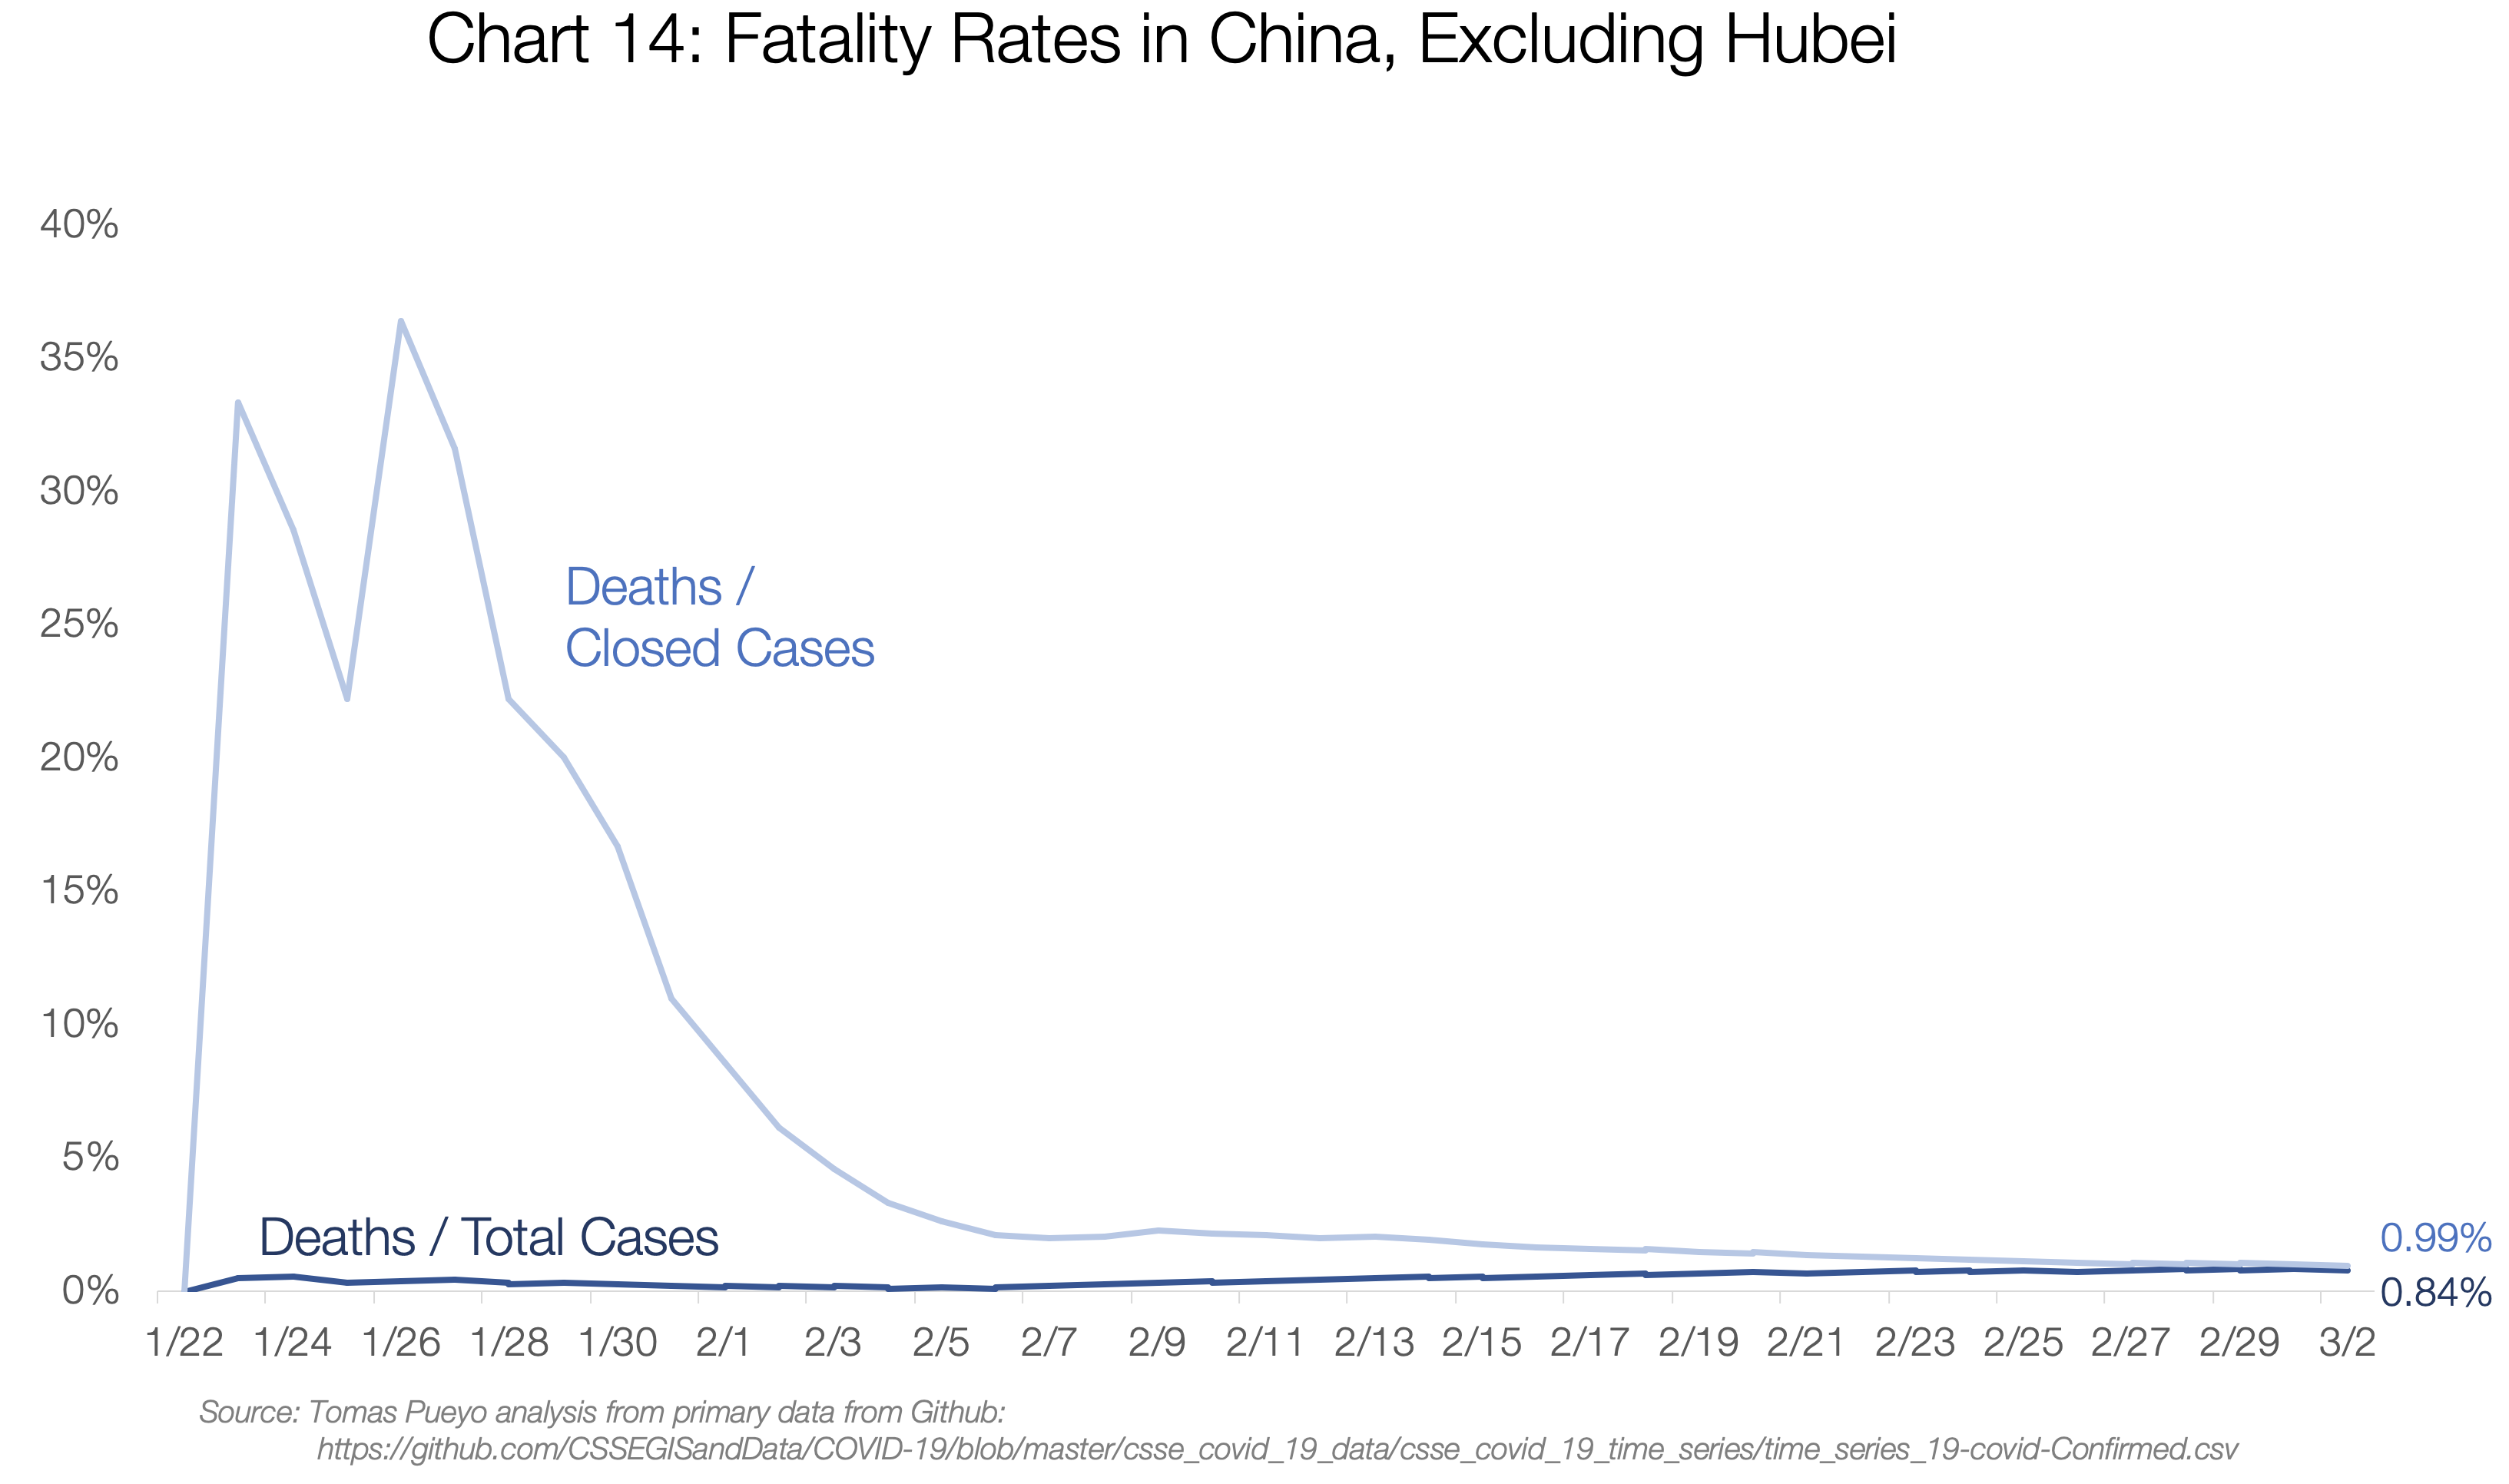
However, we carried out calculations on data compiled from two completely different realities: Hubei and the rest of China.
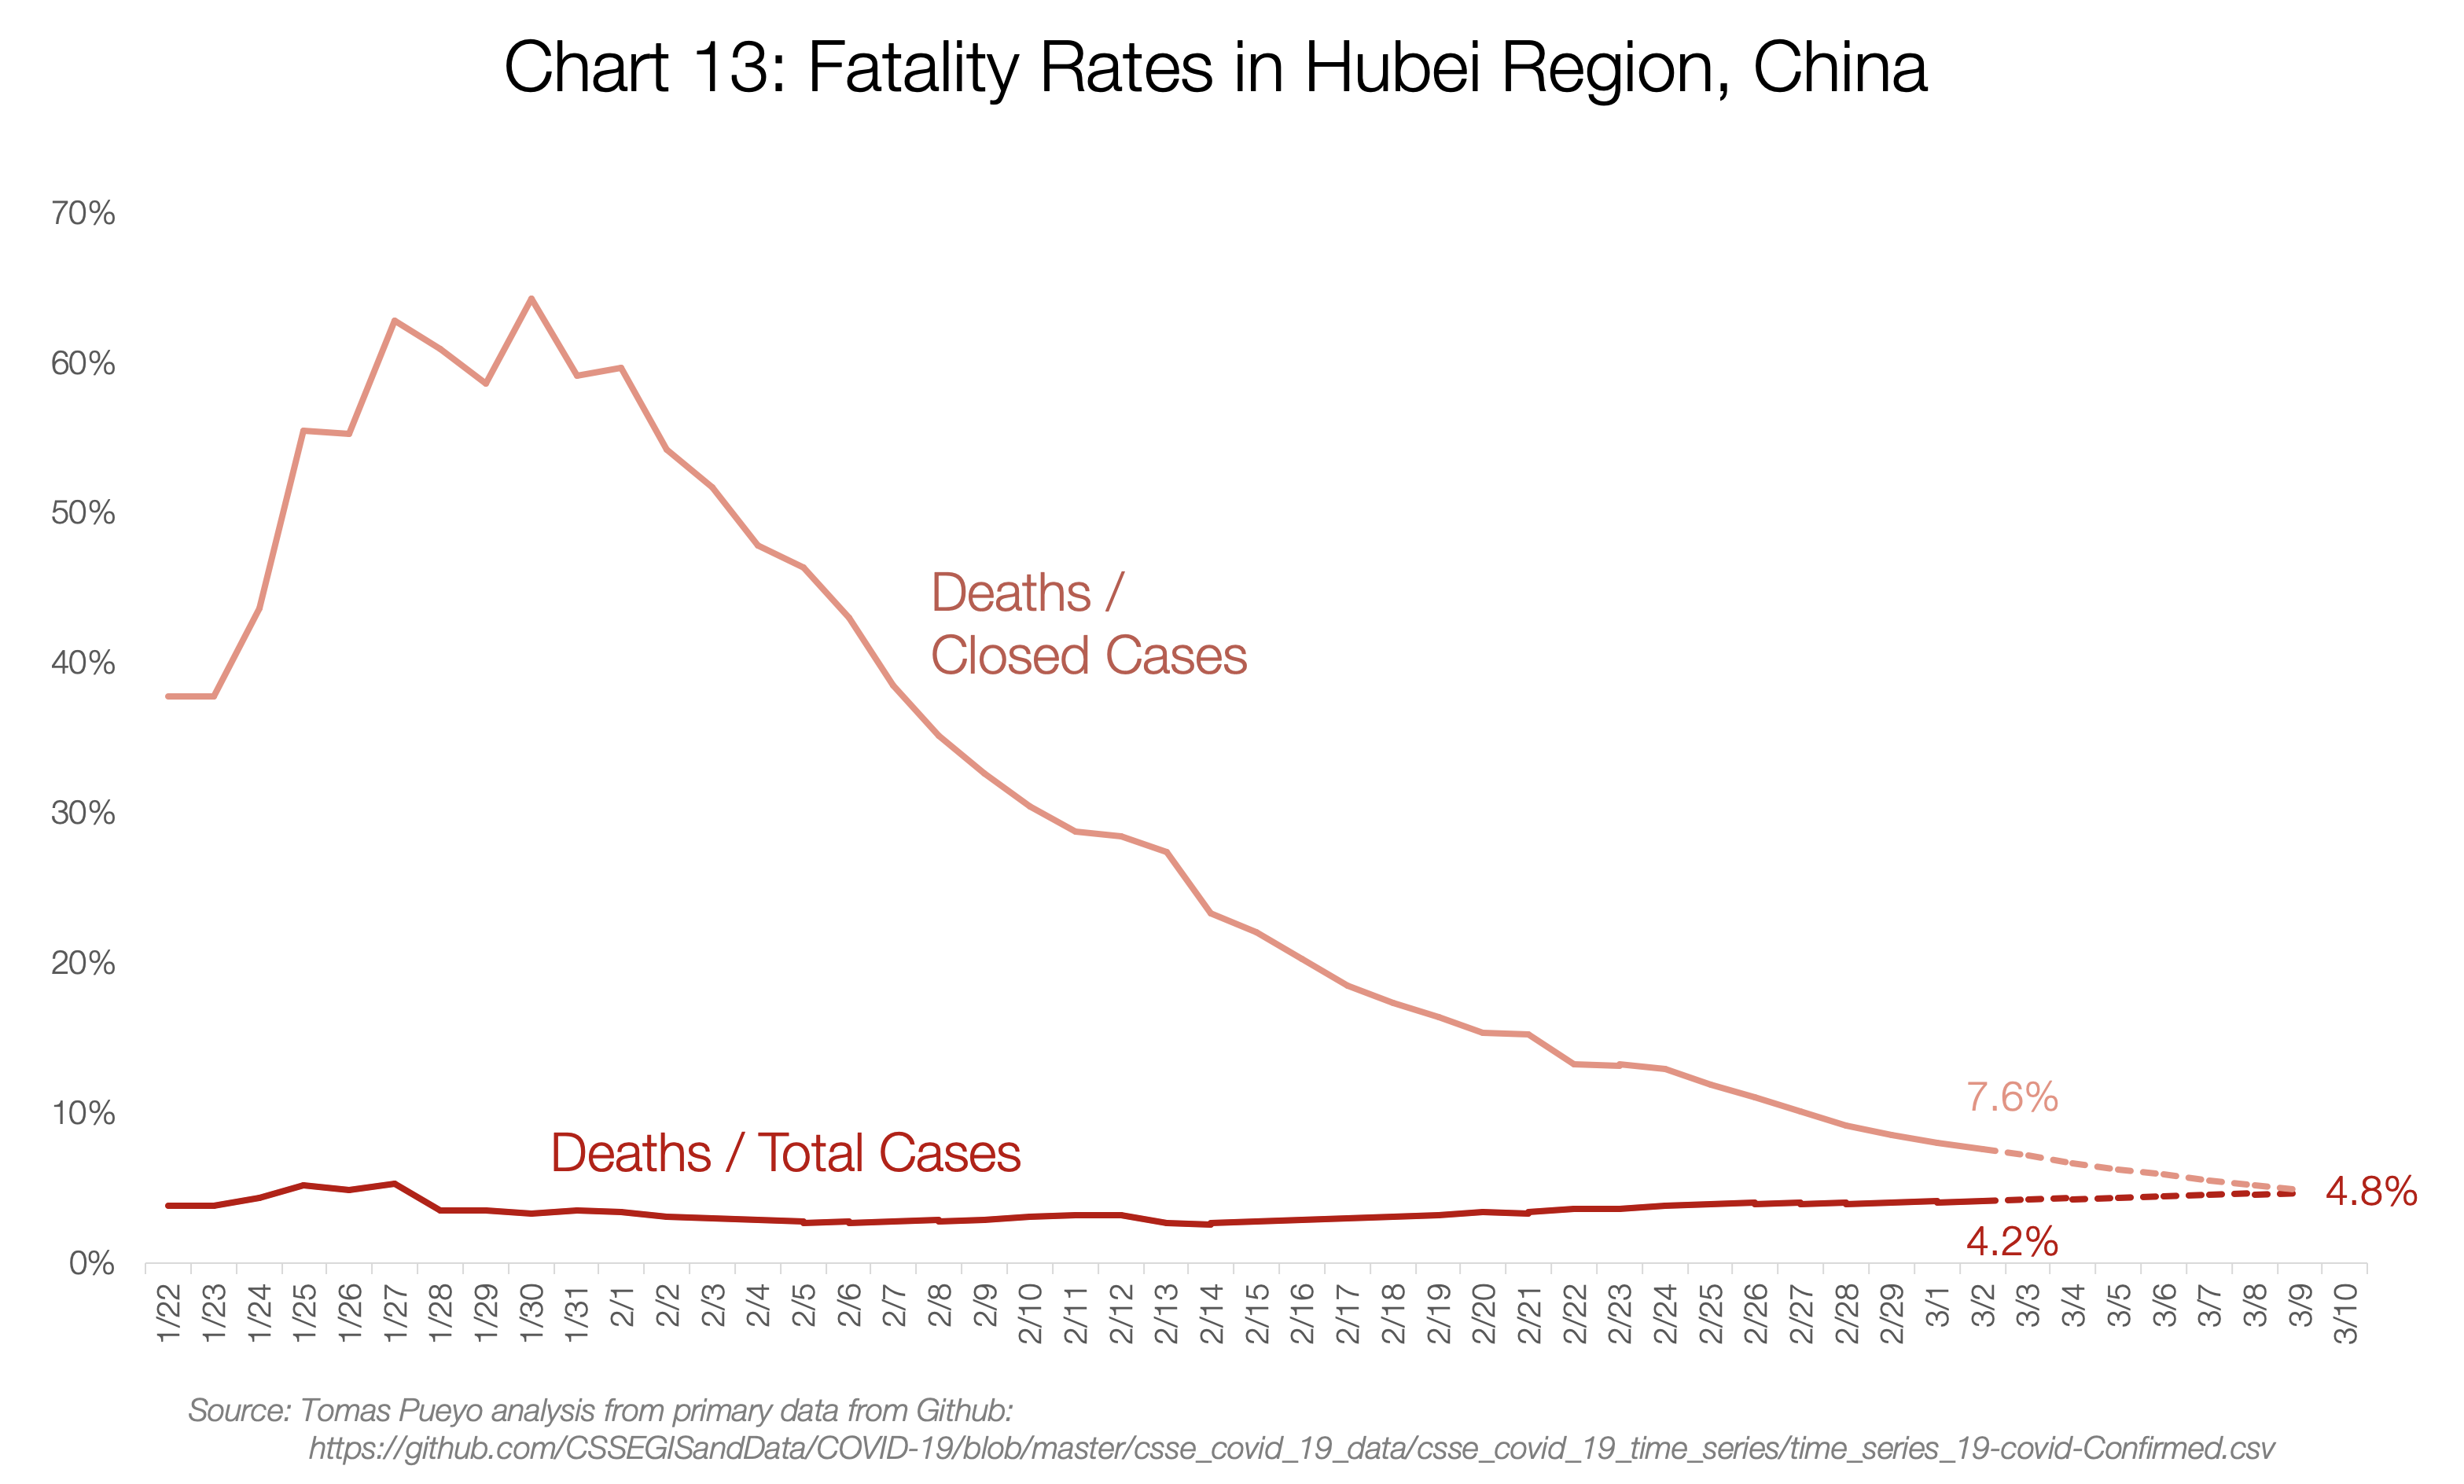
Most likely, mortality in Hubei will be 4.8%. Moreover, for the rest of China, it is likely to converge by ~ 0.9%.
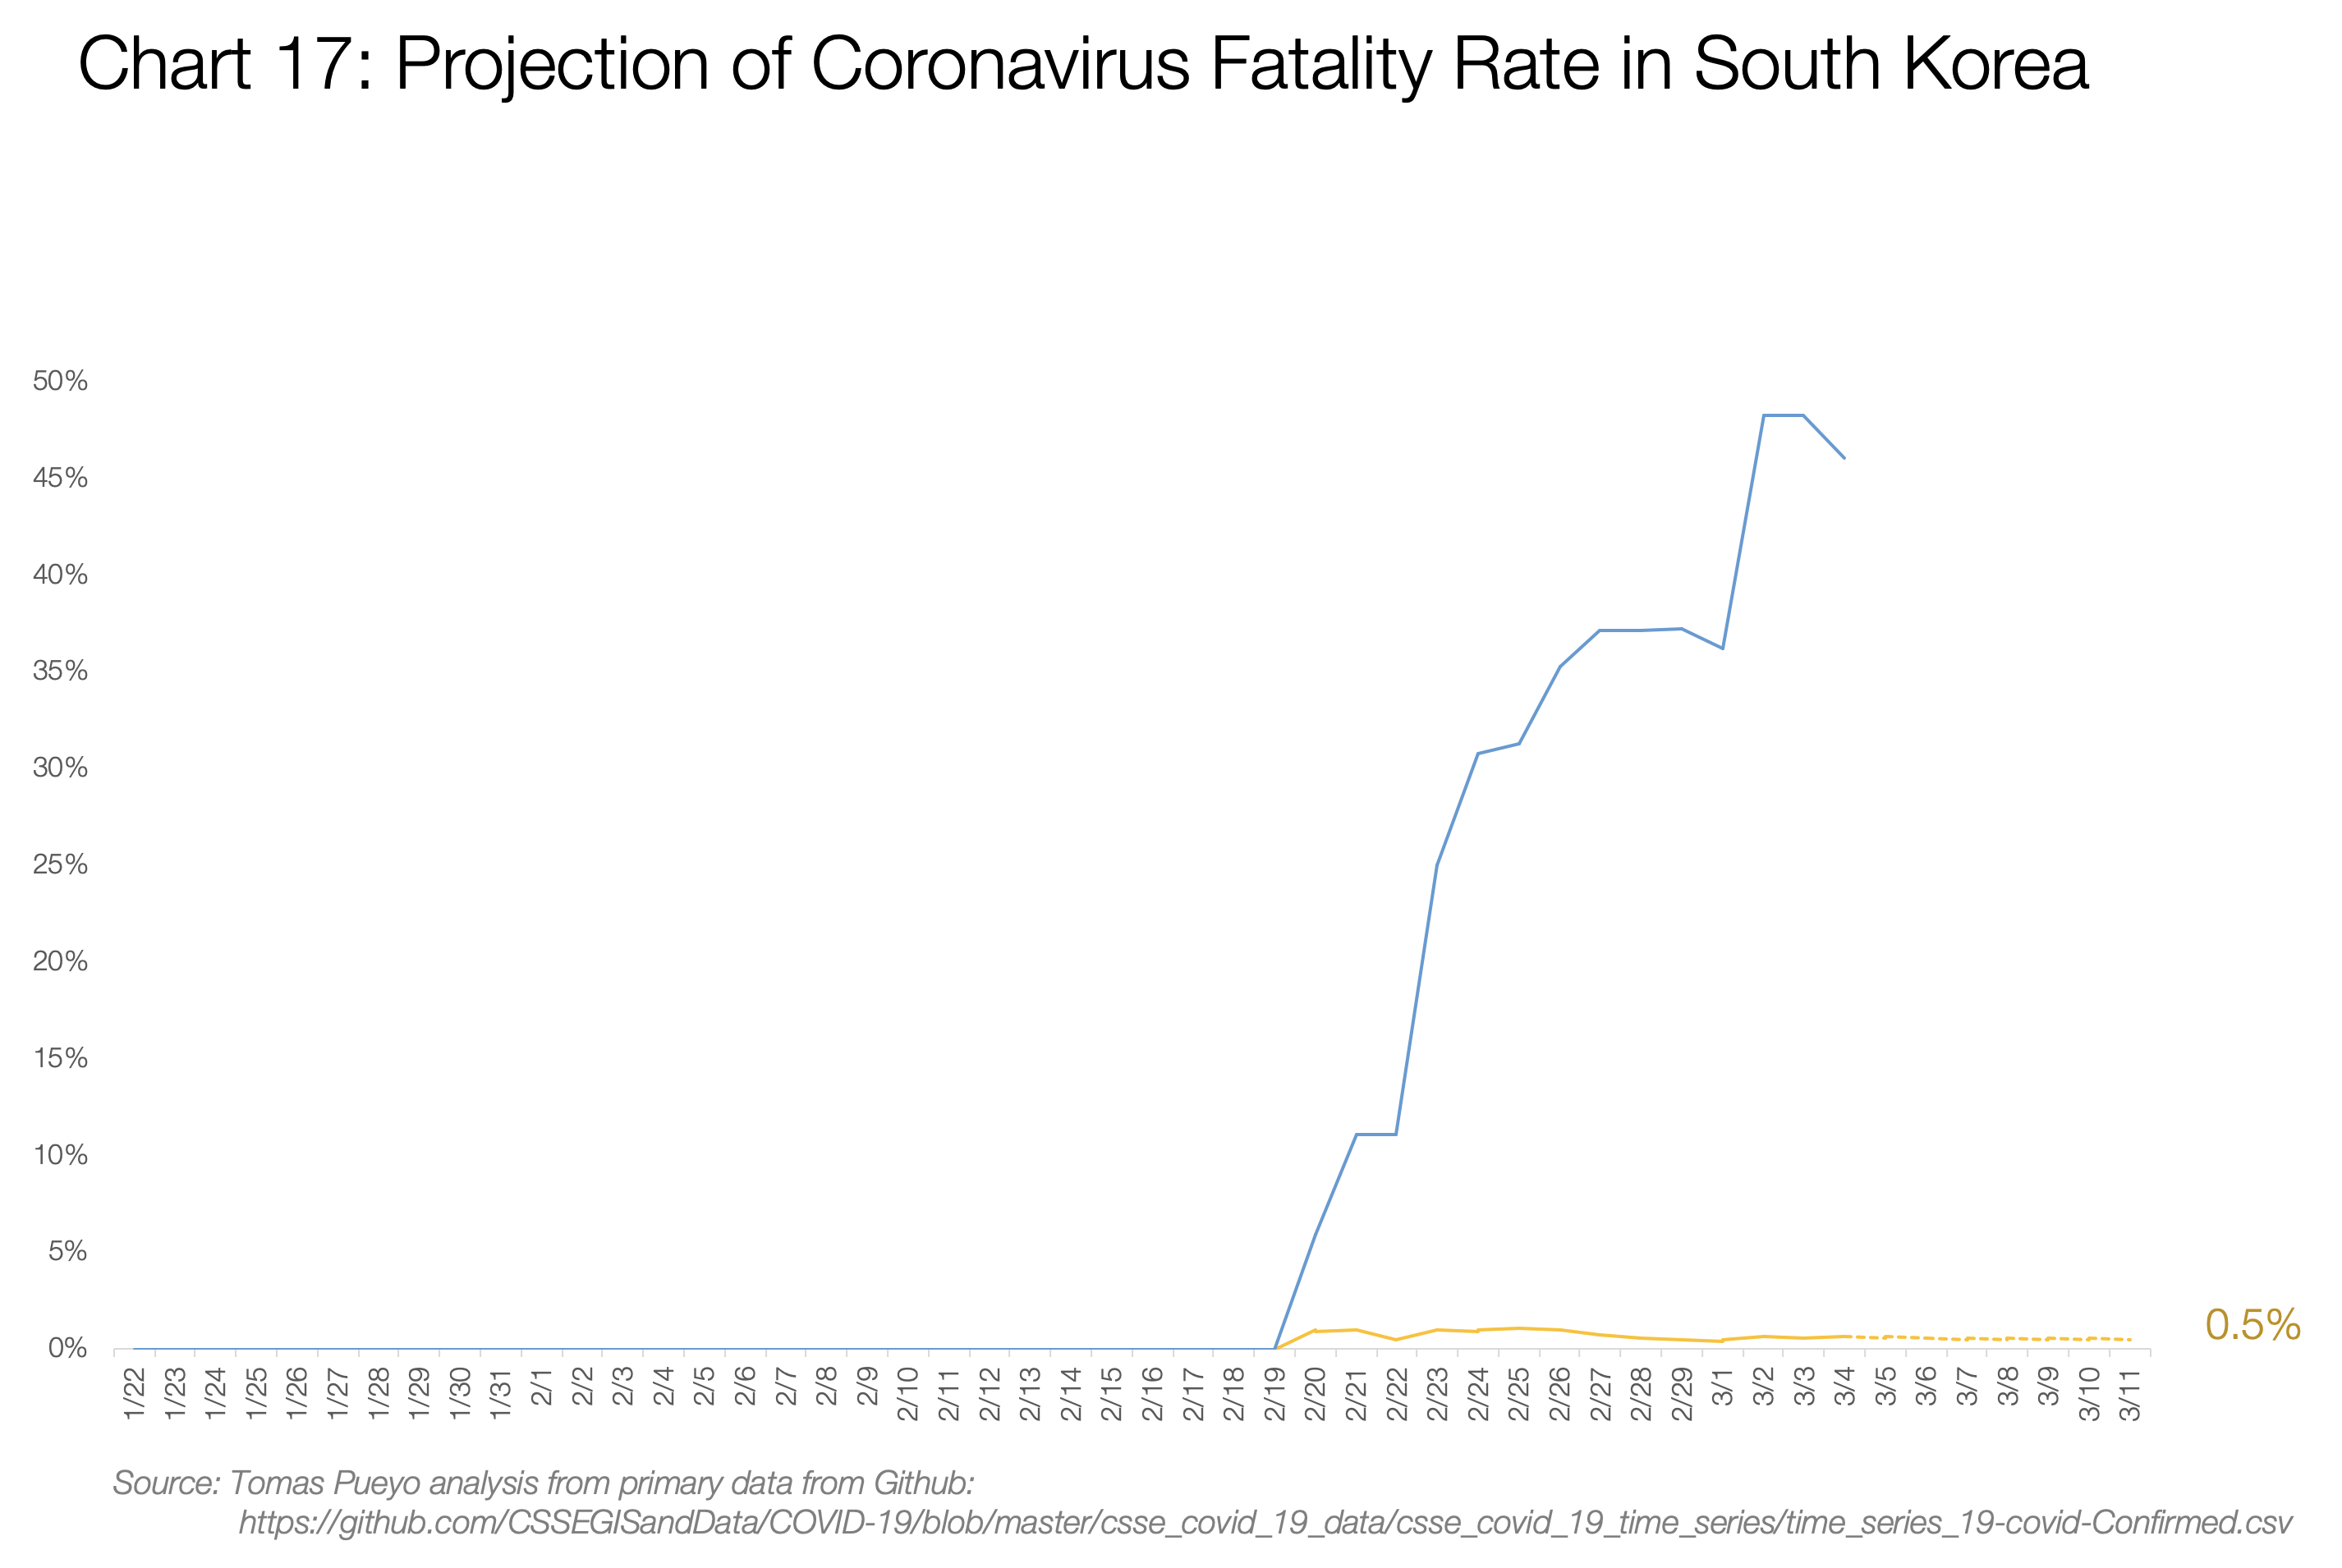
Out of curiosity, it is also worth looking at the graphs according to Iran, Italy and South Korea, those few countries in which the number of deaths can be considered more or less relevant.
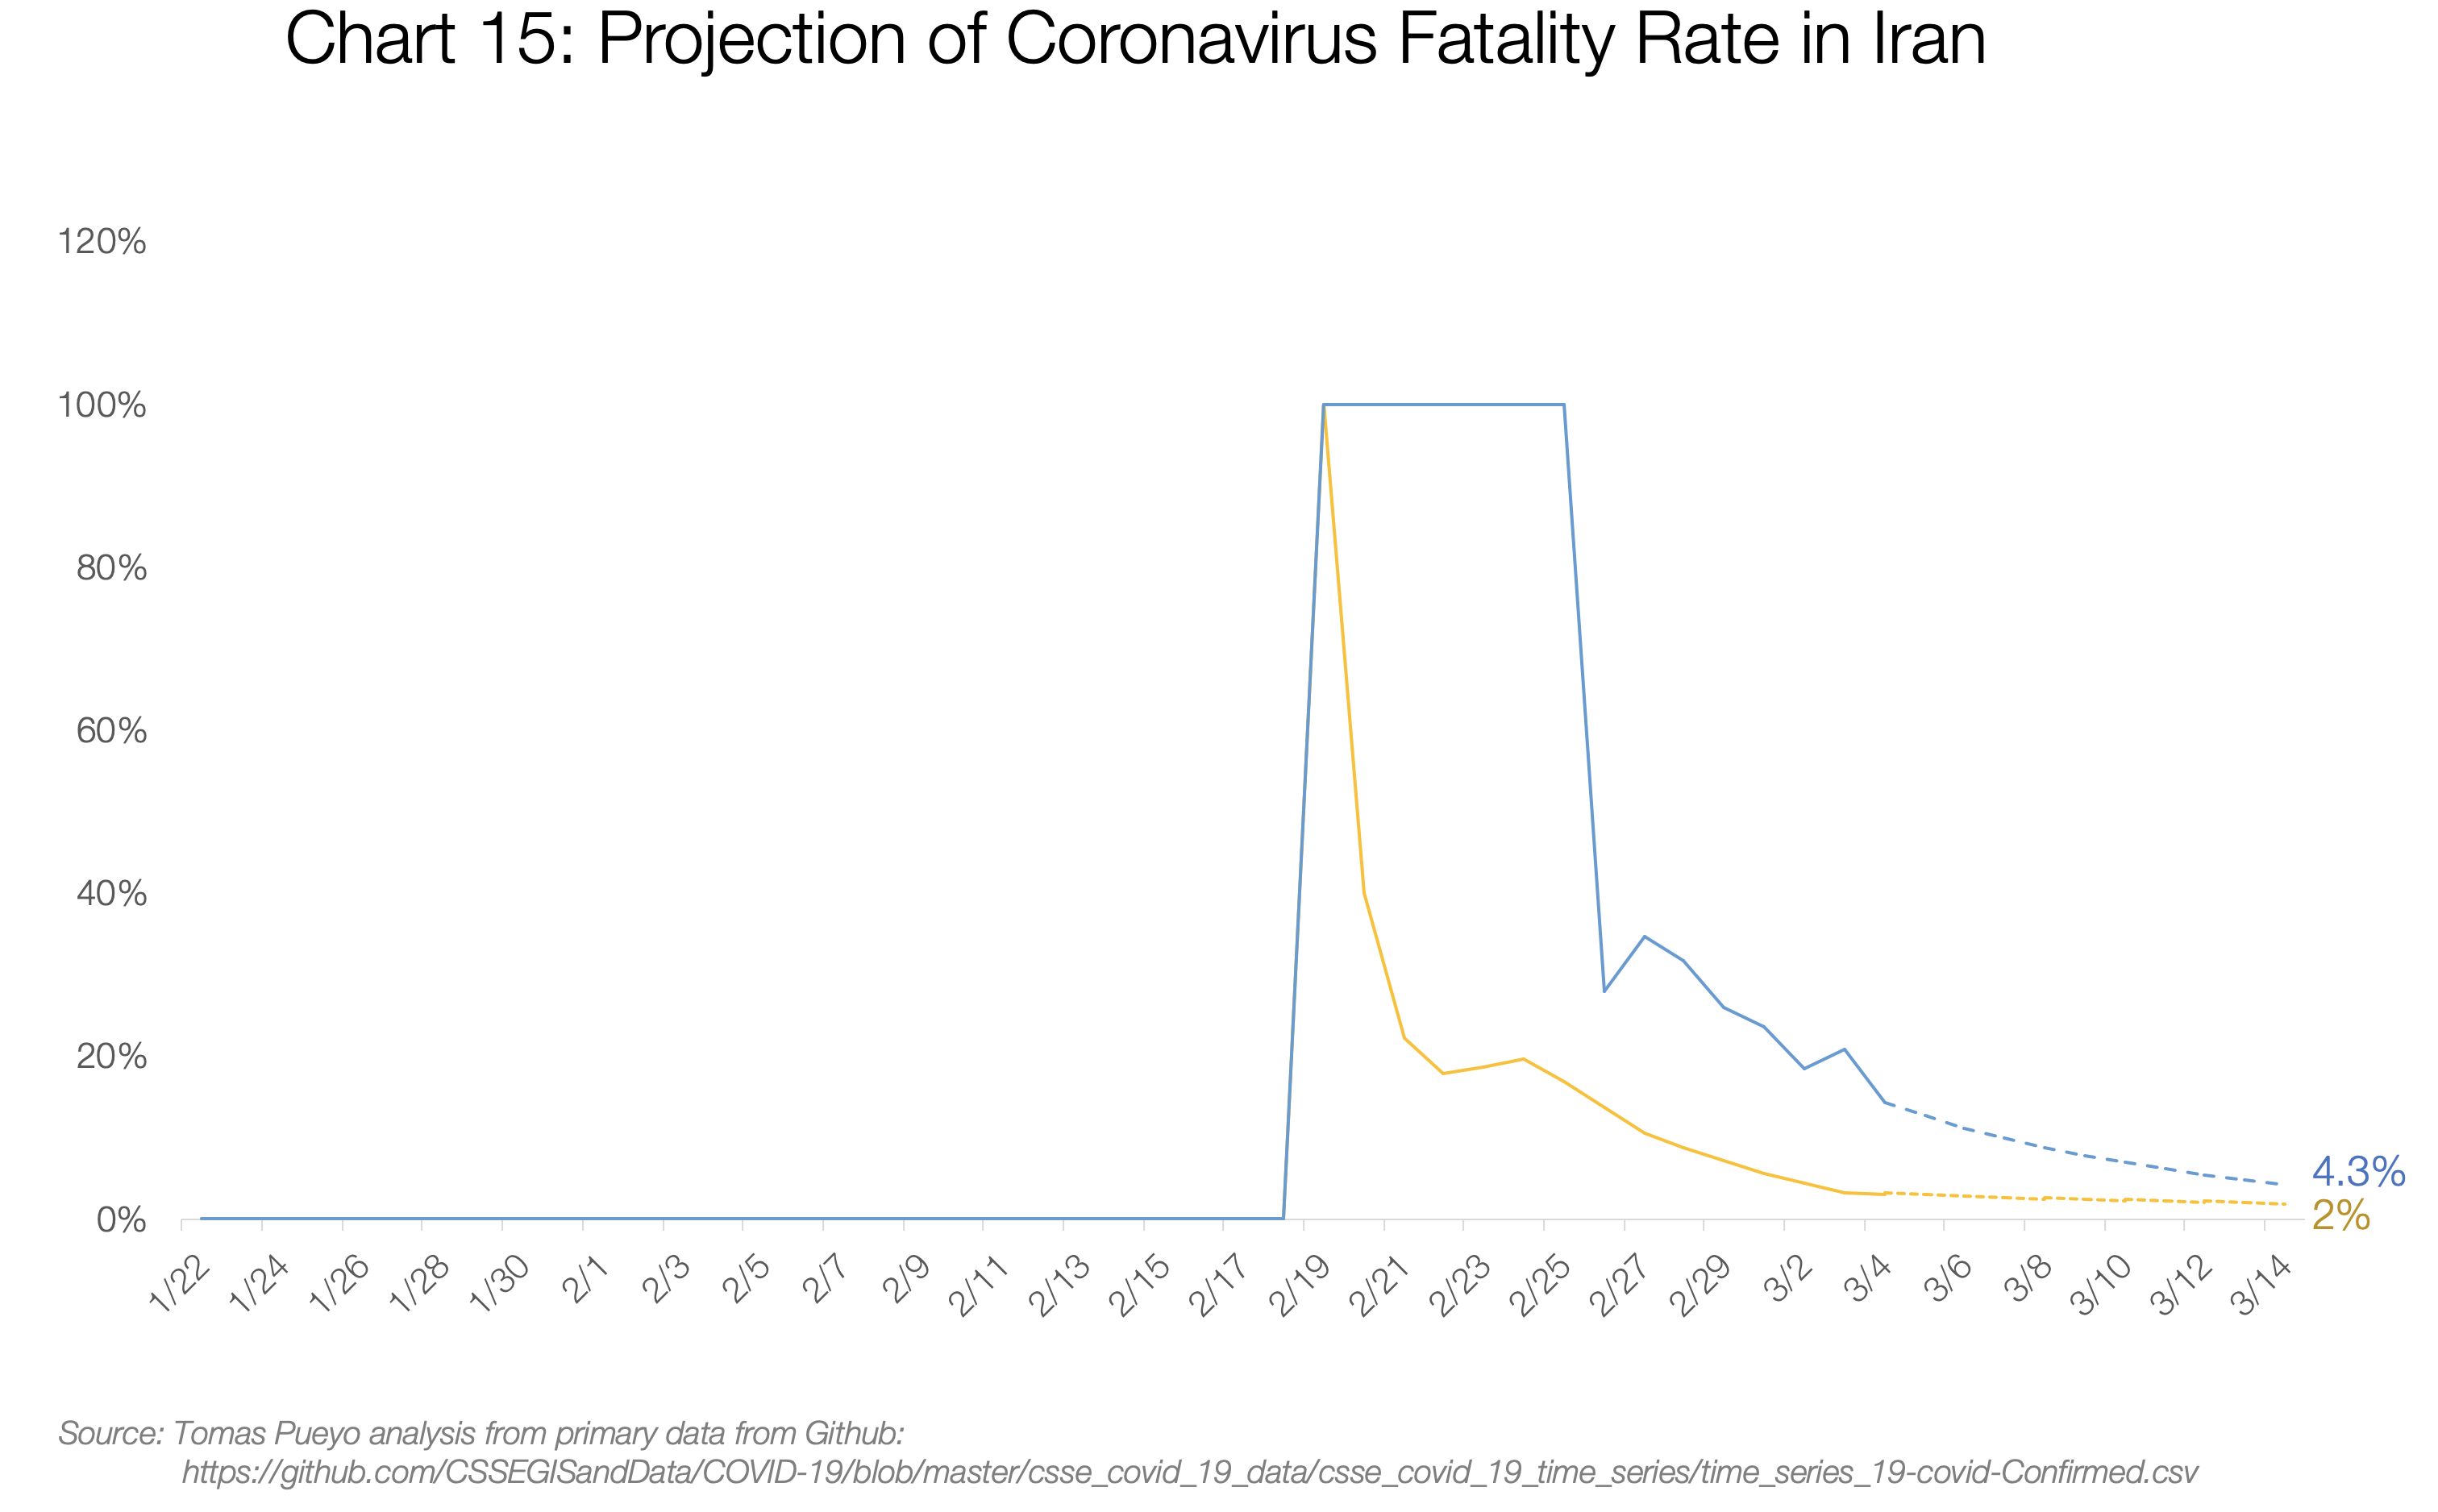
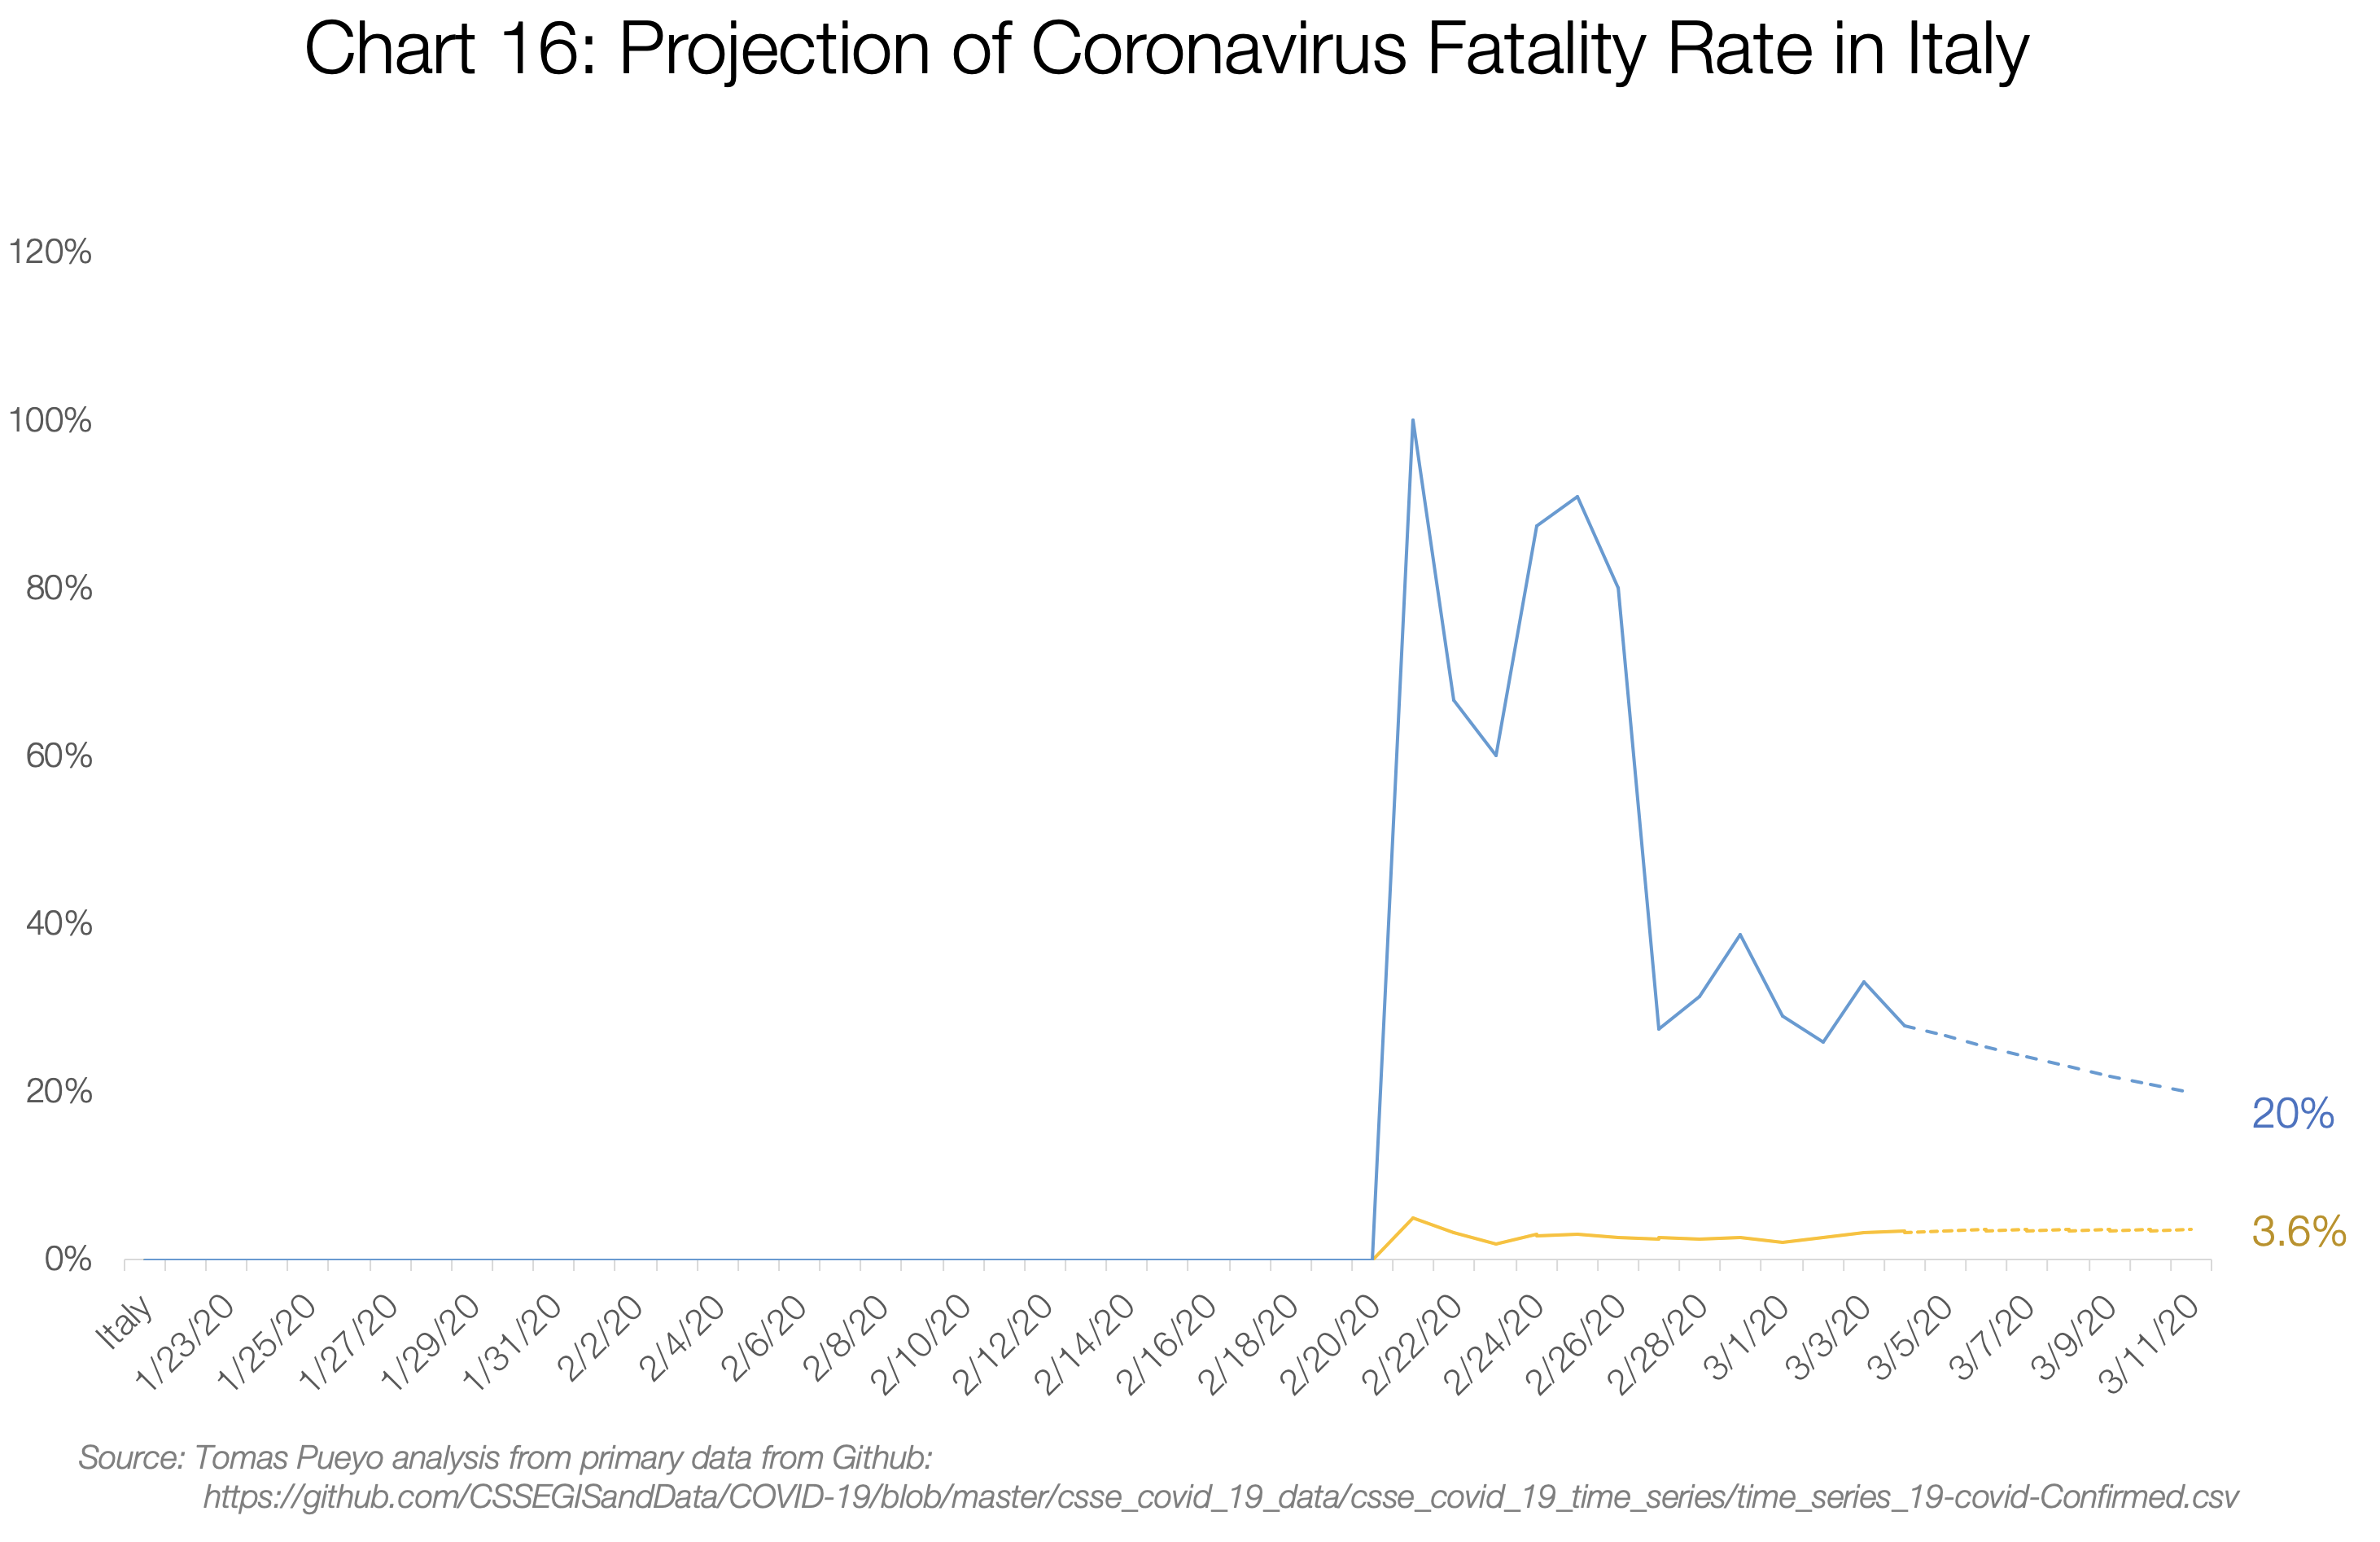
As can be seen, in Iran and Italy, mortality values converge in the range of 3% –4%. It can be assumed that the resulting data will be close to this value.
South Korea is the most interesting example, because our two indicators are completely unrelated there: those who die to the total number of infected people give only 0.6%, but those who die to the number of convalescent people - a whopping 48%. A possible explanation is that the country is just very careful. Koreans test everyone (with so many cases detected, mortality seems low), and after recovery they continue to observe patients for a longer period (therefore, the numbers grow faster when the victim dies). It is characteristic that the ratio of the deceased to the total number of infected people from the very beginning is about 0.5%, which suggests that it will not change much.
The latest relevant example is the Diamond Princess cruise ship: with 706 cases, 6 deaths and 100 recoveries, the total mortality will be in the range from 1% to 6.5%.
From this we can conclude:
- In countries prepared for the epidemic, mortality will range from ≈0.5% (South Korea) to 0.9% (the rest of China).
- In congested and unprepared countries, mortality will be ≈3% –5%.
In other words, countries that act quickly can reduce the number of deaths by ten times. And this is just a calculation of the number of deaths - a quick response also dramatically reduces the number of victims, which in itself simplifies the task.
Countries that act quickly reduce deaths by at least 10 times.
So what does a country need to prepare?
Health system stress level
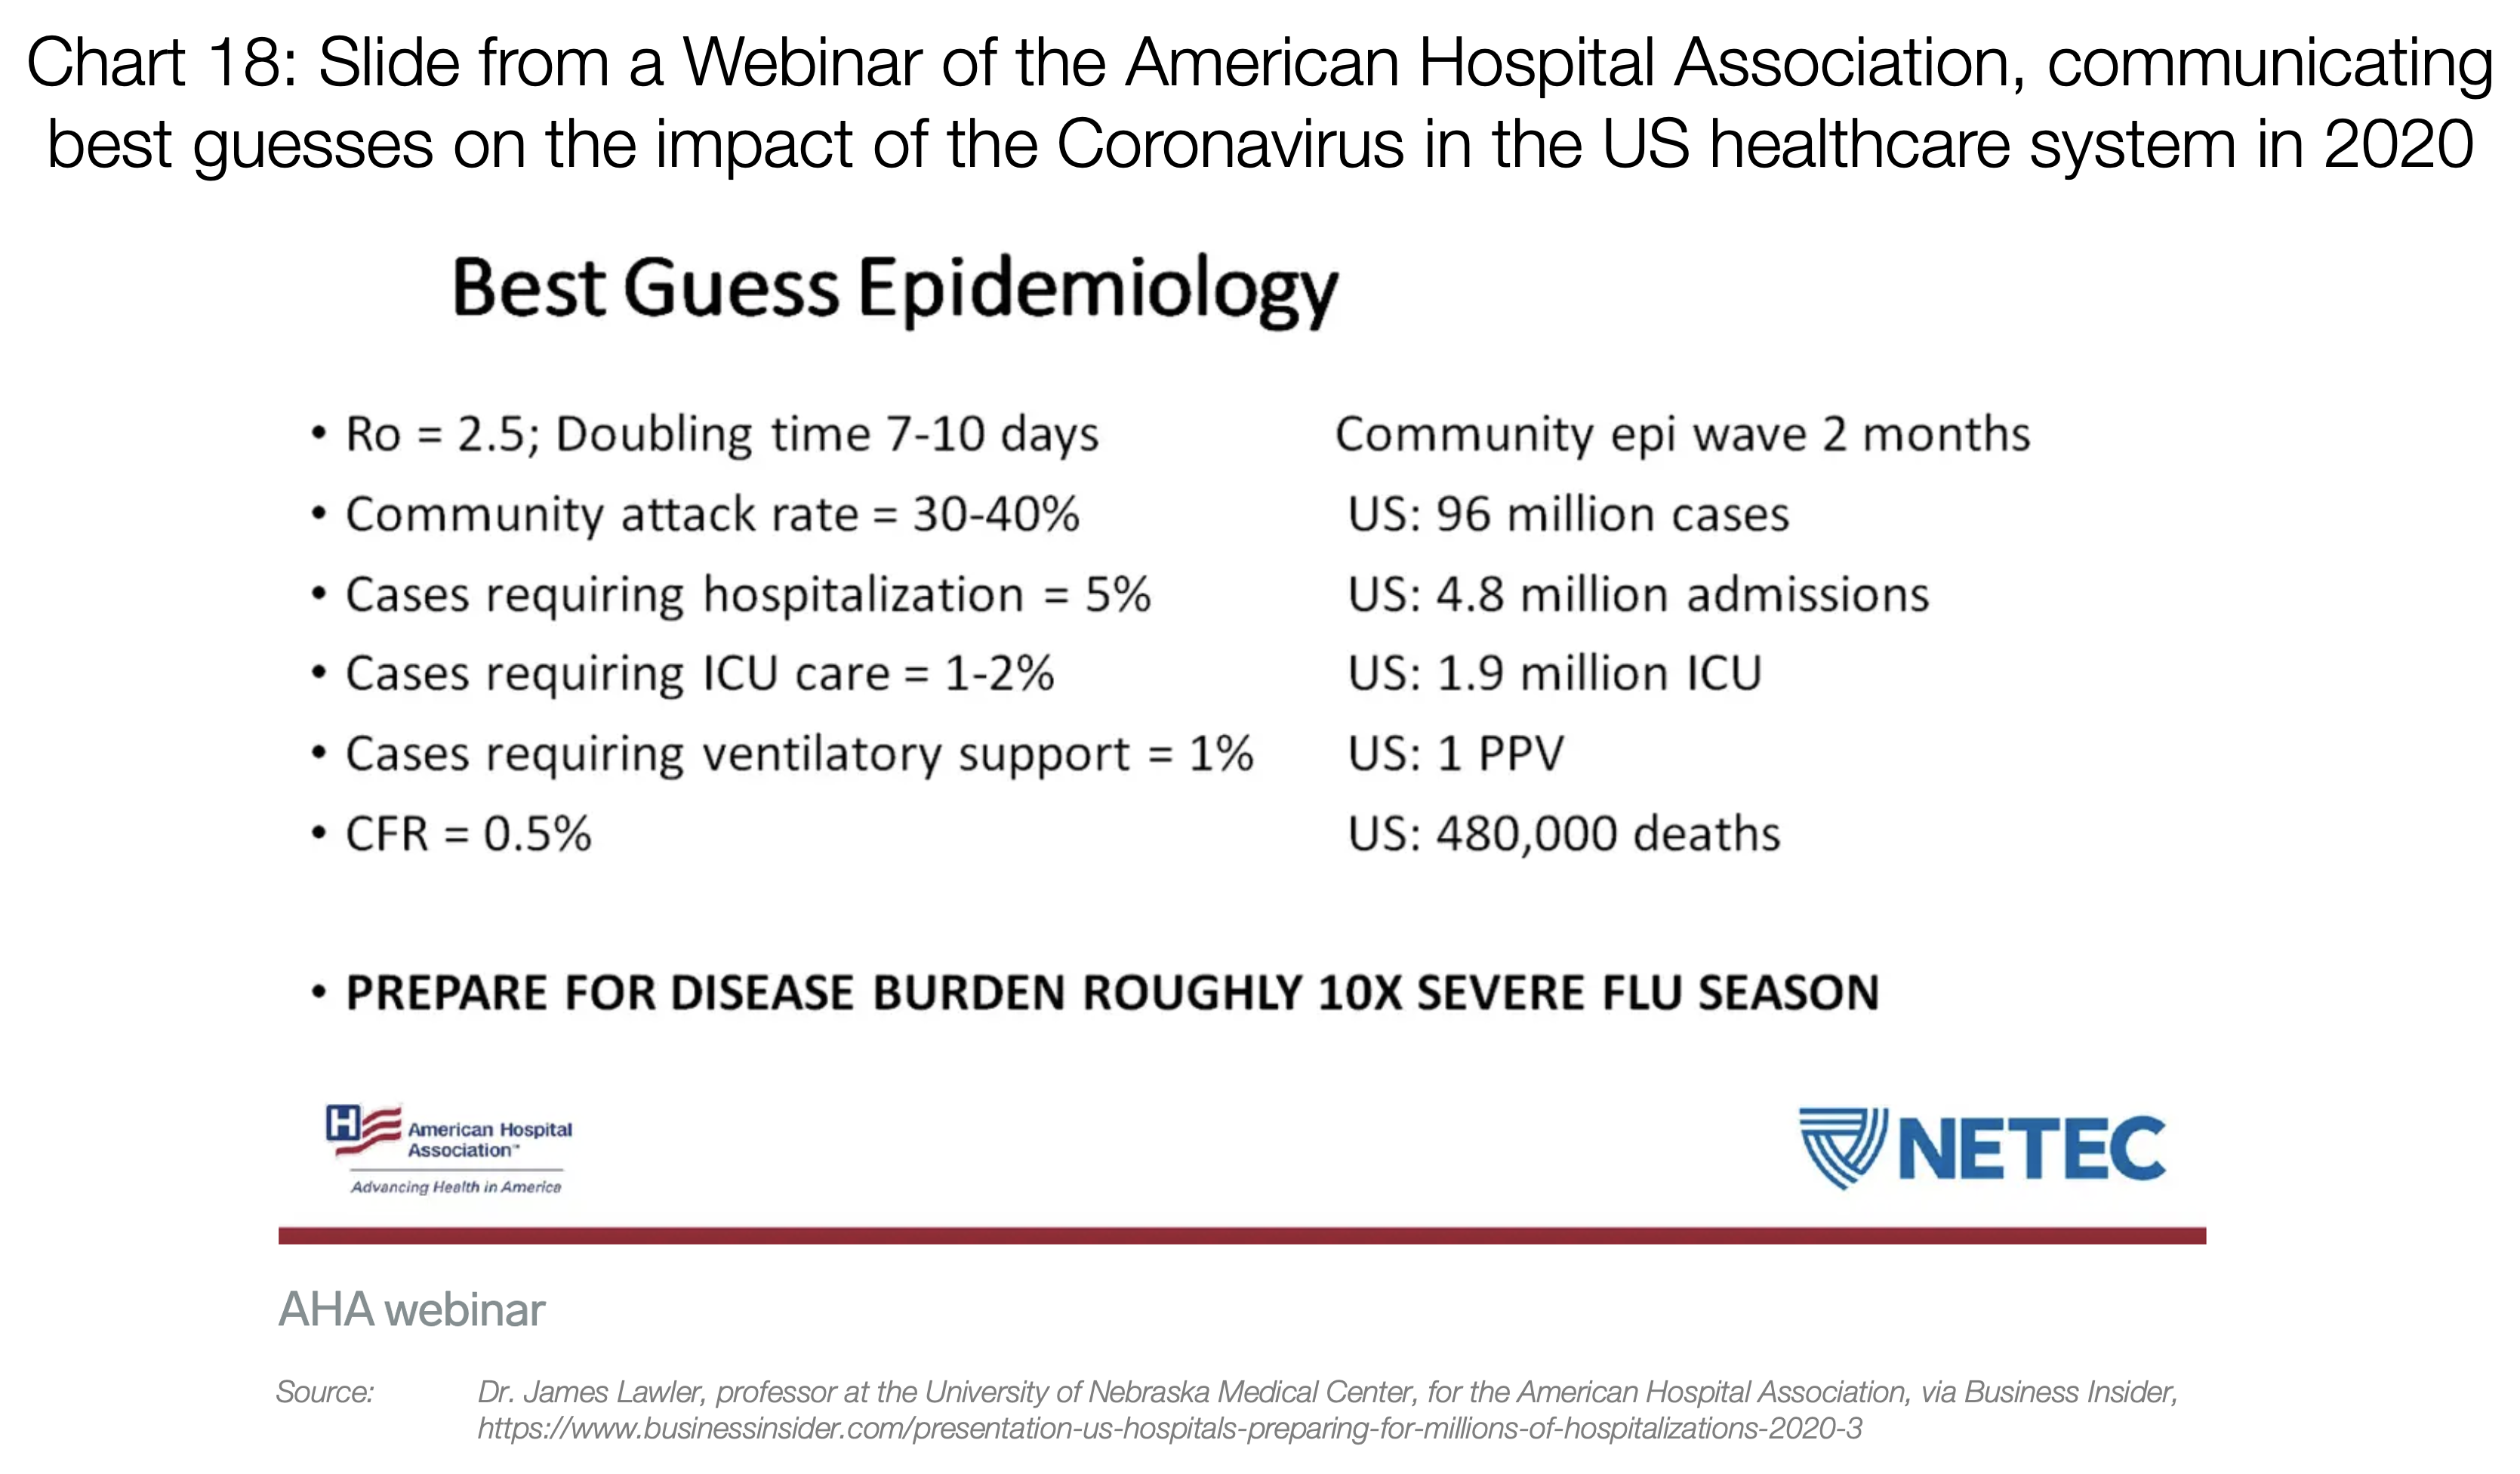
About 20% of coronavirus cases require hospitalization, 5% require placement in an intensive care unit (intensive care unit), and about 1% require extremely intensive care using such means as mechanical ventilation (mechanical ventilation) or ECMO (artificial heart and lungs).

The problem is that equipment such as ventilators and ECMO cannot be easily manufactured or purchased. A few years ago in the USA, for example, there were only 250 ECMO devices.
So if suddenly 100,000 people become infected, many of them will want to get tested. About 20,000 will require hospitalization, 5,000 will need an intensive care unit, and 1,000 will need devices that are currently in short supply. And these are just 100,000 cases.
This is not taking into account other problems, such as masks, for example. In a country like the United States, there is only 1% of the masks needed by medical professionals (12 million N95 and 30 million surgical versus the required 3.5 billion). If many cases of the disease appear at the same time, then the masks will last only two weeks.
Countries such as Japan, South Korea, Hong Kong or Singapore, as well as Chinese regions outside Hubei, were trained and were able to provide patients with the necessary care.
But the rest of the western countries are rather heading towards Hubei and Italy. So what is going on there?
How an Overloaded Healthcare System Works
The stories that occurred in Hubei and in Italy are beginning to eerily resemble each other. Although two hospitals could be built in Hubei in ten days, they were immediately completely overloaded.
Both there and there everyone complained that the patients had flooded the hospitals. They had to be taken care of everywhere: in the corridors, in the waiting rooms ...
This short thread on Twitter paints a pretty scary picture of today's Italy.
Medical workers don’t change their protective clothes for hours because they aren’t enough. As a result, they cannot leave the infected areas for several hours. When they do this, they roll over, dehydrated and exhausted. Change no longer exists. One has to call the retired to satisfy the need for specialists, and people who are not familiar with nursing are taught overnight to fulfill critical roles. There are no days off or rest hours, everyone works without a break.
That is, until they get sick. What happens often, because they are in constant contact with the virus without adequate protective equipment. When this happens, they must be quarantined for 14 days, during which they cannot help anyone. At best, they lose two weeks; in the worst case, they are dead.
The worst thing happens in intensive care, when patients have to share a ventilator or ECMO. They simply cannot be shared, so healthcare providers must determine which patient will use them. Which, in fact, means deciding which of them will survive and who will die.
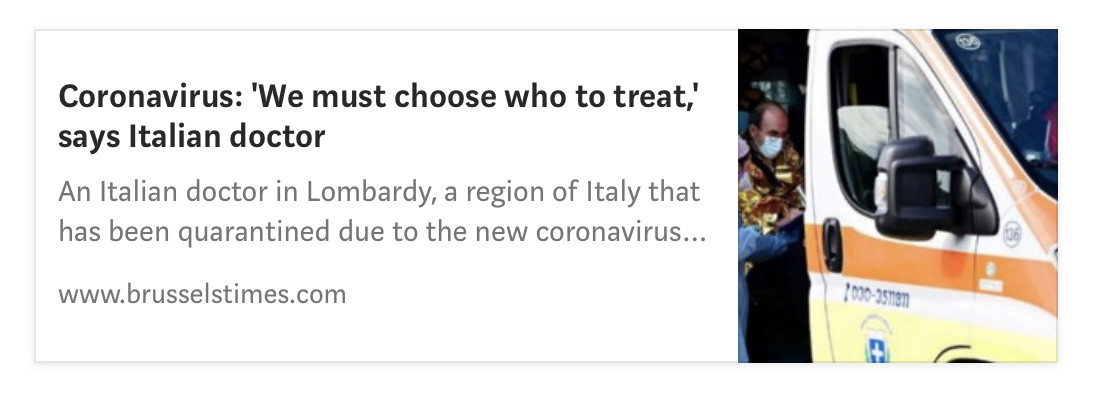
“In a few days you have to choose. <...> Not everyone can be intubated. We make decisions based on age and health. ”- Christian Salaroli, Italian doctor
All this leads to the fact that mortality in an overloaded health system is ≈4% instead of ≈0.5%. If you want your city or your country to be part of these 4%, just do nothing today.
3. What needs to be done?
Smooth curve
Now it is a pandemic, and it cannot be simply eliminated. But what can be done is to reduce its impact.
Some countries may be role models. The best of them is Taiwan, which is very closely associated with China and still has less than 50 cases of the disease. This recent work explains all the measures they took at an early stage that were aimed at containing.
They were able to restrain the spread of the virus, but most countries could not. Now Taiwan is already busy with another matter - mitigation. They try to make the disease as harmless as possible.
If we reduce infections as much as possible, our healthcare system will be able to deal with cases much better, which will lead to a reduction in mortality. And if we adhere to this approach long enough, we will reach a point where the rest of society can be vaccinated, which will completely eliminate the risk. So our goal is not to eliminate the coronavirus infection, but to postpone it.
The longer we delay infection, the better the health system functions, the lower the mortality rate and the higher the proportion of the population that will be vaccinated before it gets infected.
How do we align the curve?
Social exclusion
There is one very simple thing that we can do and that works for sure: social isolation.
Returning to the schedule about Wuhan, we can recall that as soon as the city entered quarantine, the epidemic began to decline. The reason is that people did not interact with each other, and the coronavirus did not spread.
The current scientific consensus states that this virus is transmitted within a radius of 2 meters if someone coughs. Otherwise, the drops will fall to the ground and will not infect anyone.
The next route of infection is through direct contact: the virus survives for hours or days on different surfaces. If it behaves like the flu, then on metal, ceramics and plastic, it can survive for weeks. This means that things like door handles, tables or elevator buttons can be terrible vectors of infection.
The only effective way of counteracting is social exclusion. It is necessary to keep people at home as long as possible until a recession occurs. This has already been proven in the past, namely during the 1918 flu pandemic.
Lessons from the 1918 Flu Pandemic

You can see how Philadelphia (solid line) did not act quickly and had a huge peak in mortality. Compare with St. Louis (dashed line), who did everything right.
Then look at Denver (below), who took the necessary measures, but then weakened them. They had a double peak, the second even higher than the first.
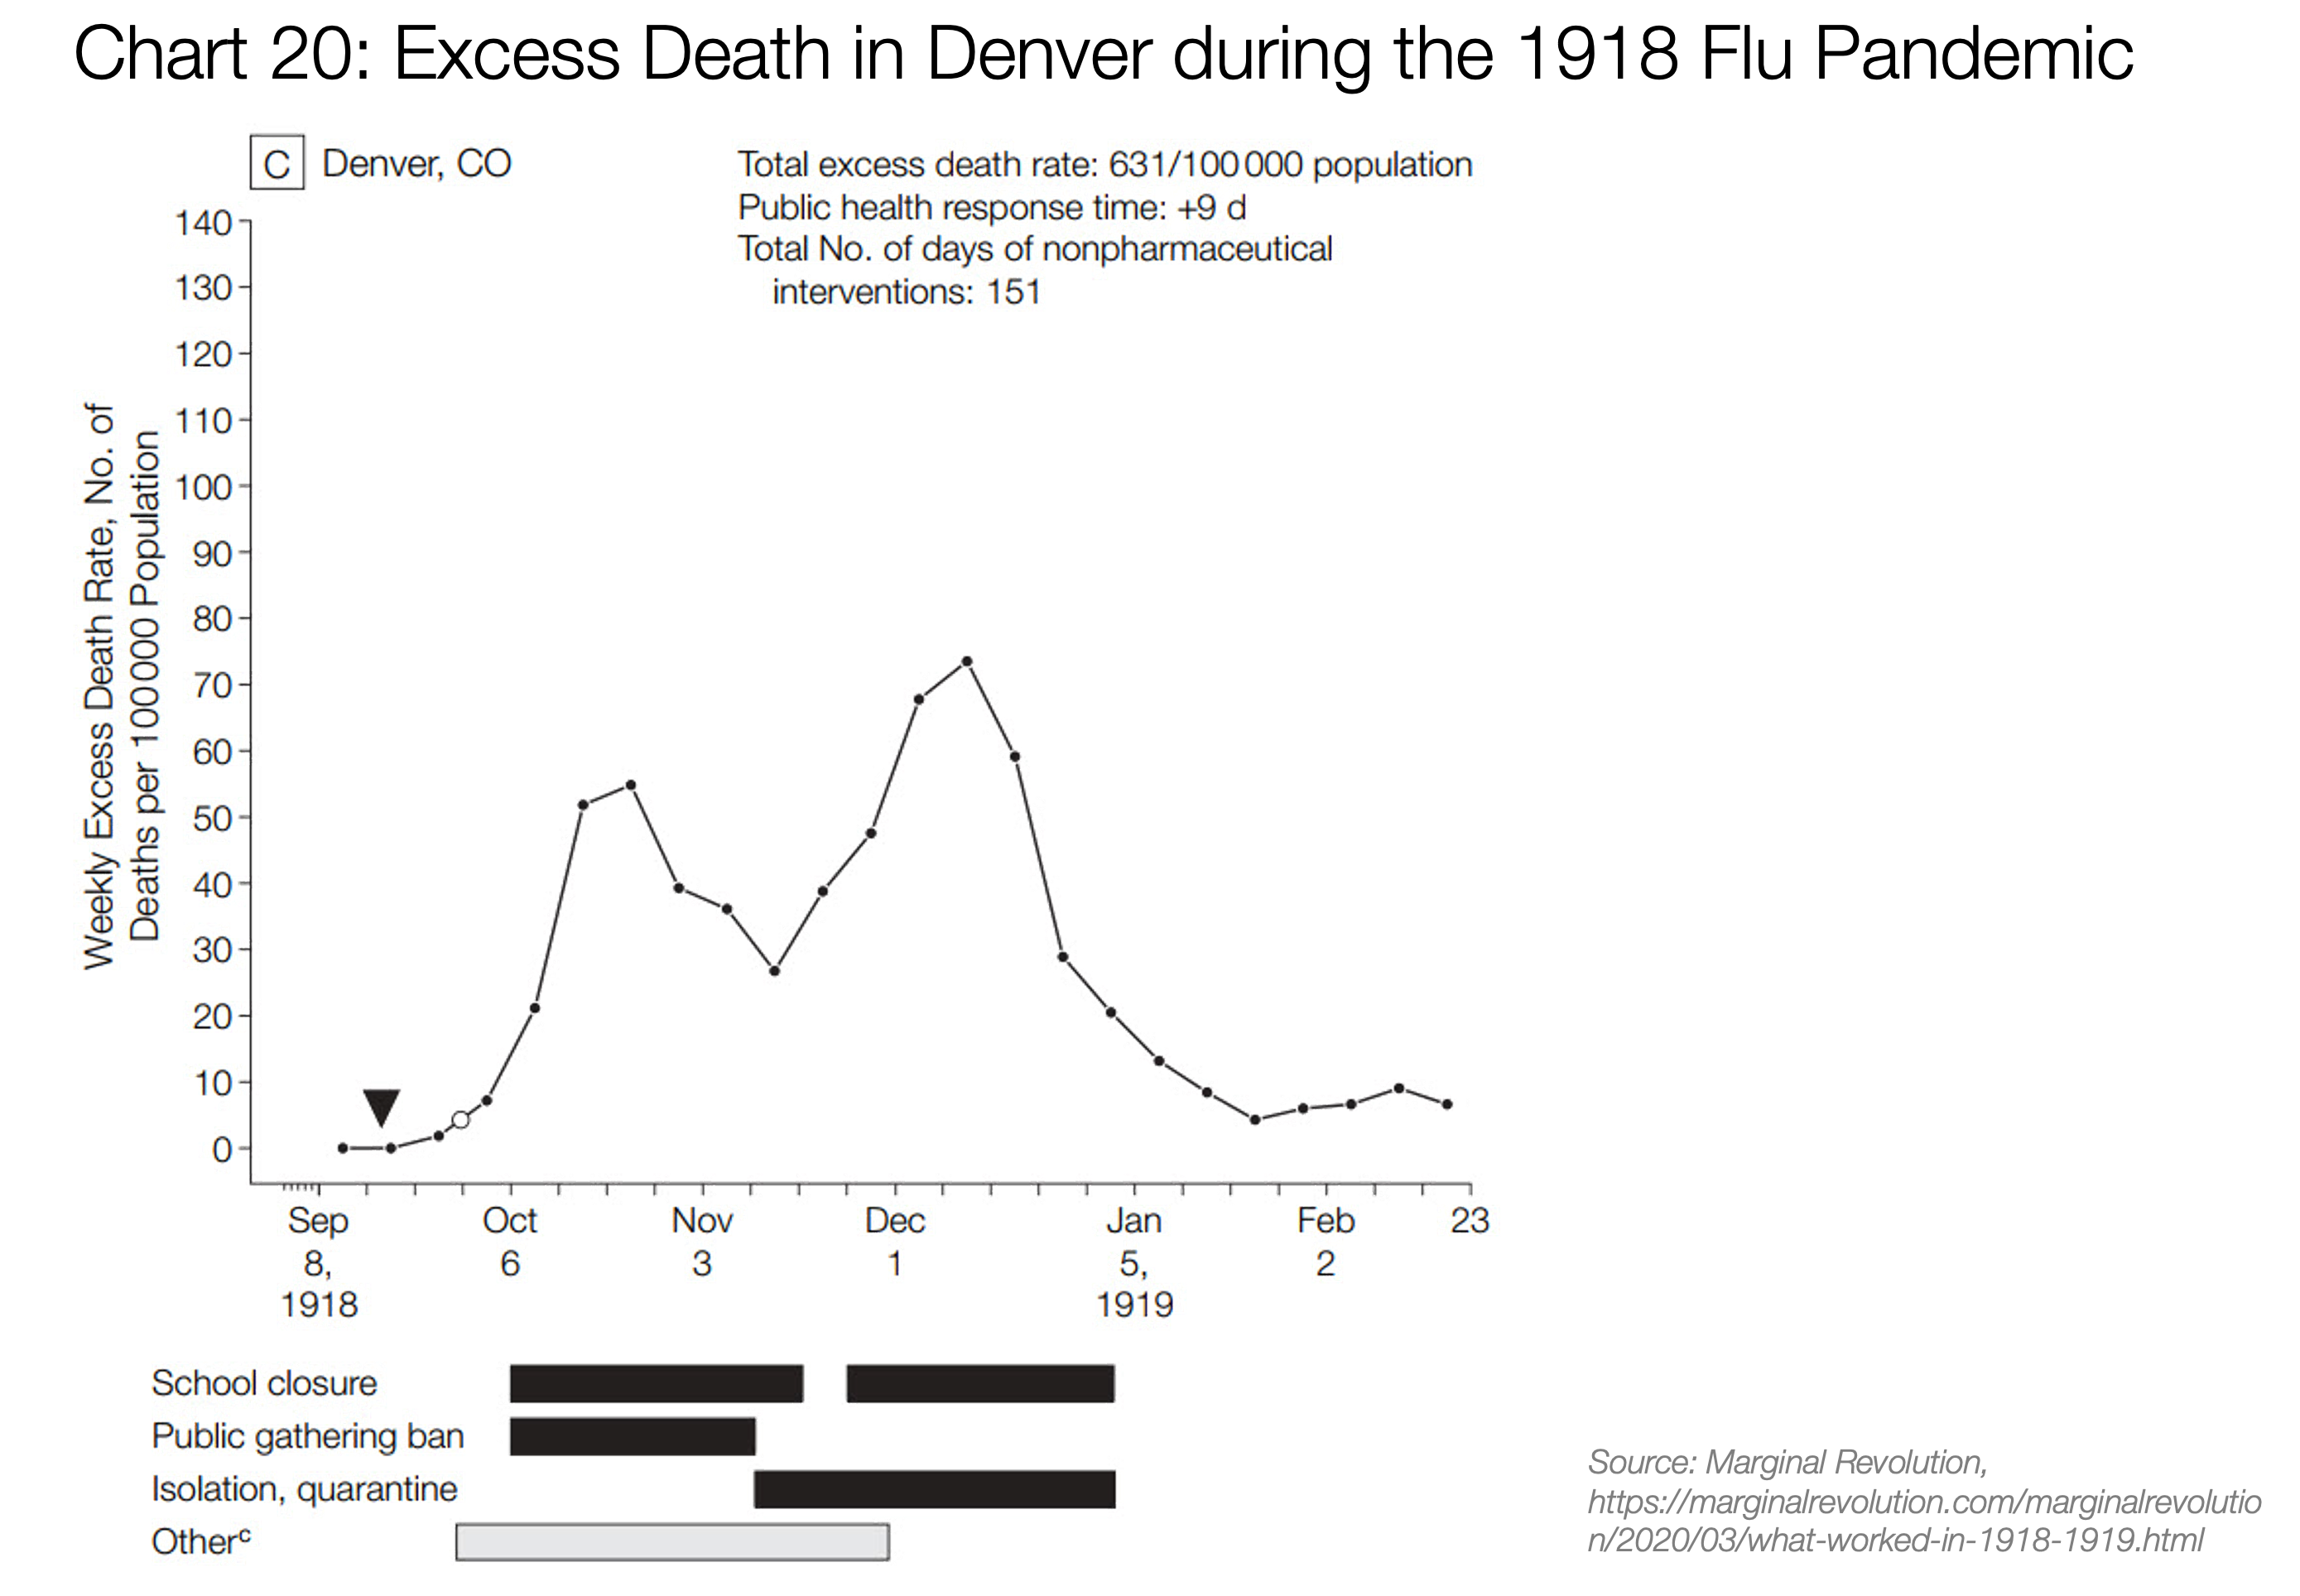
To summarize, here’s what happens:
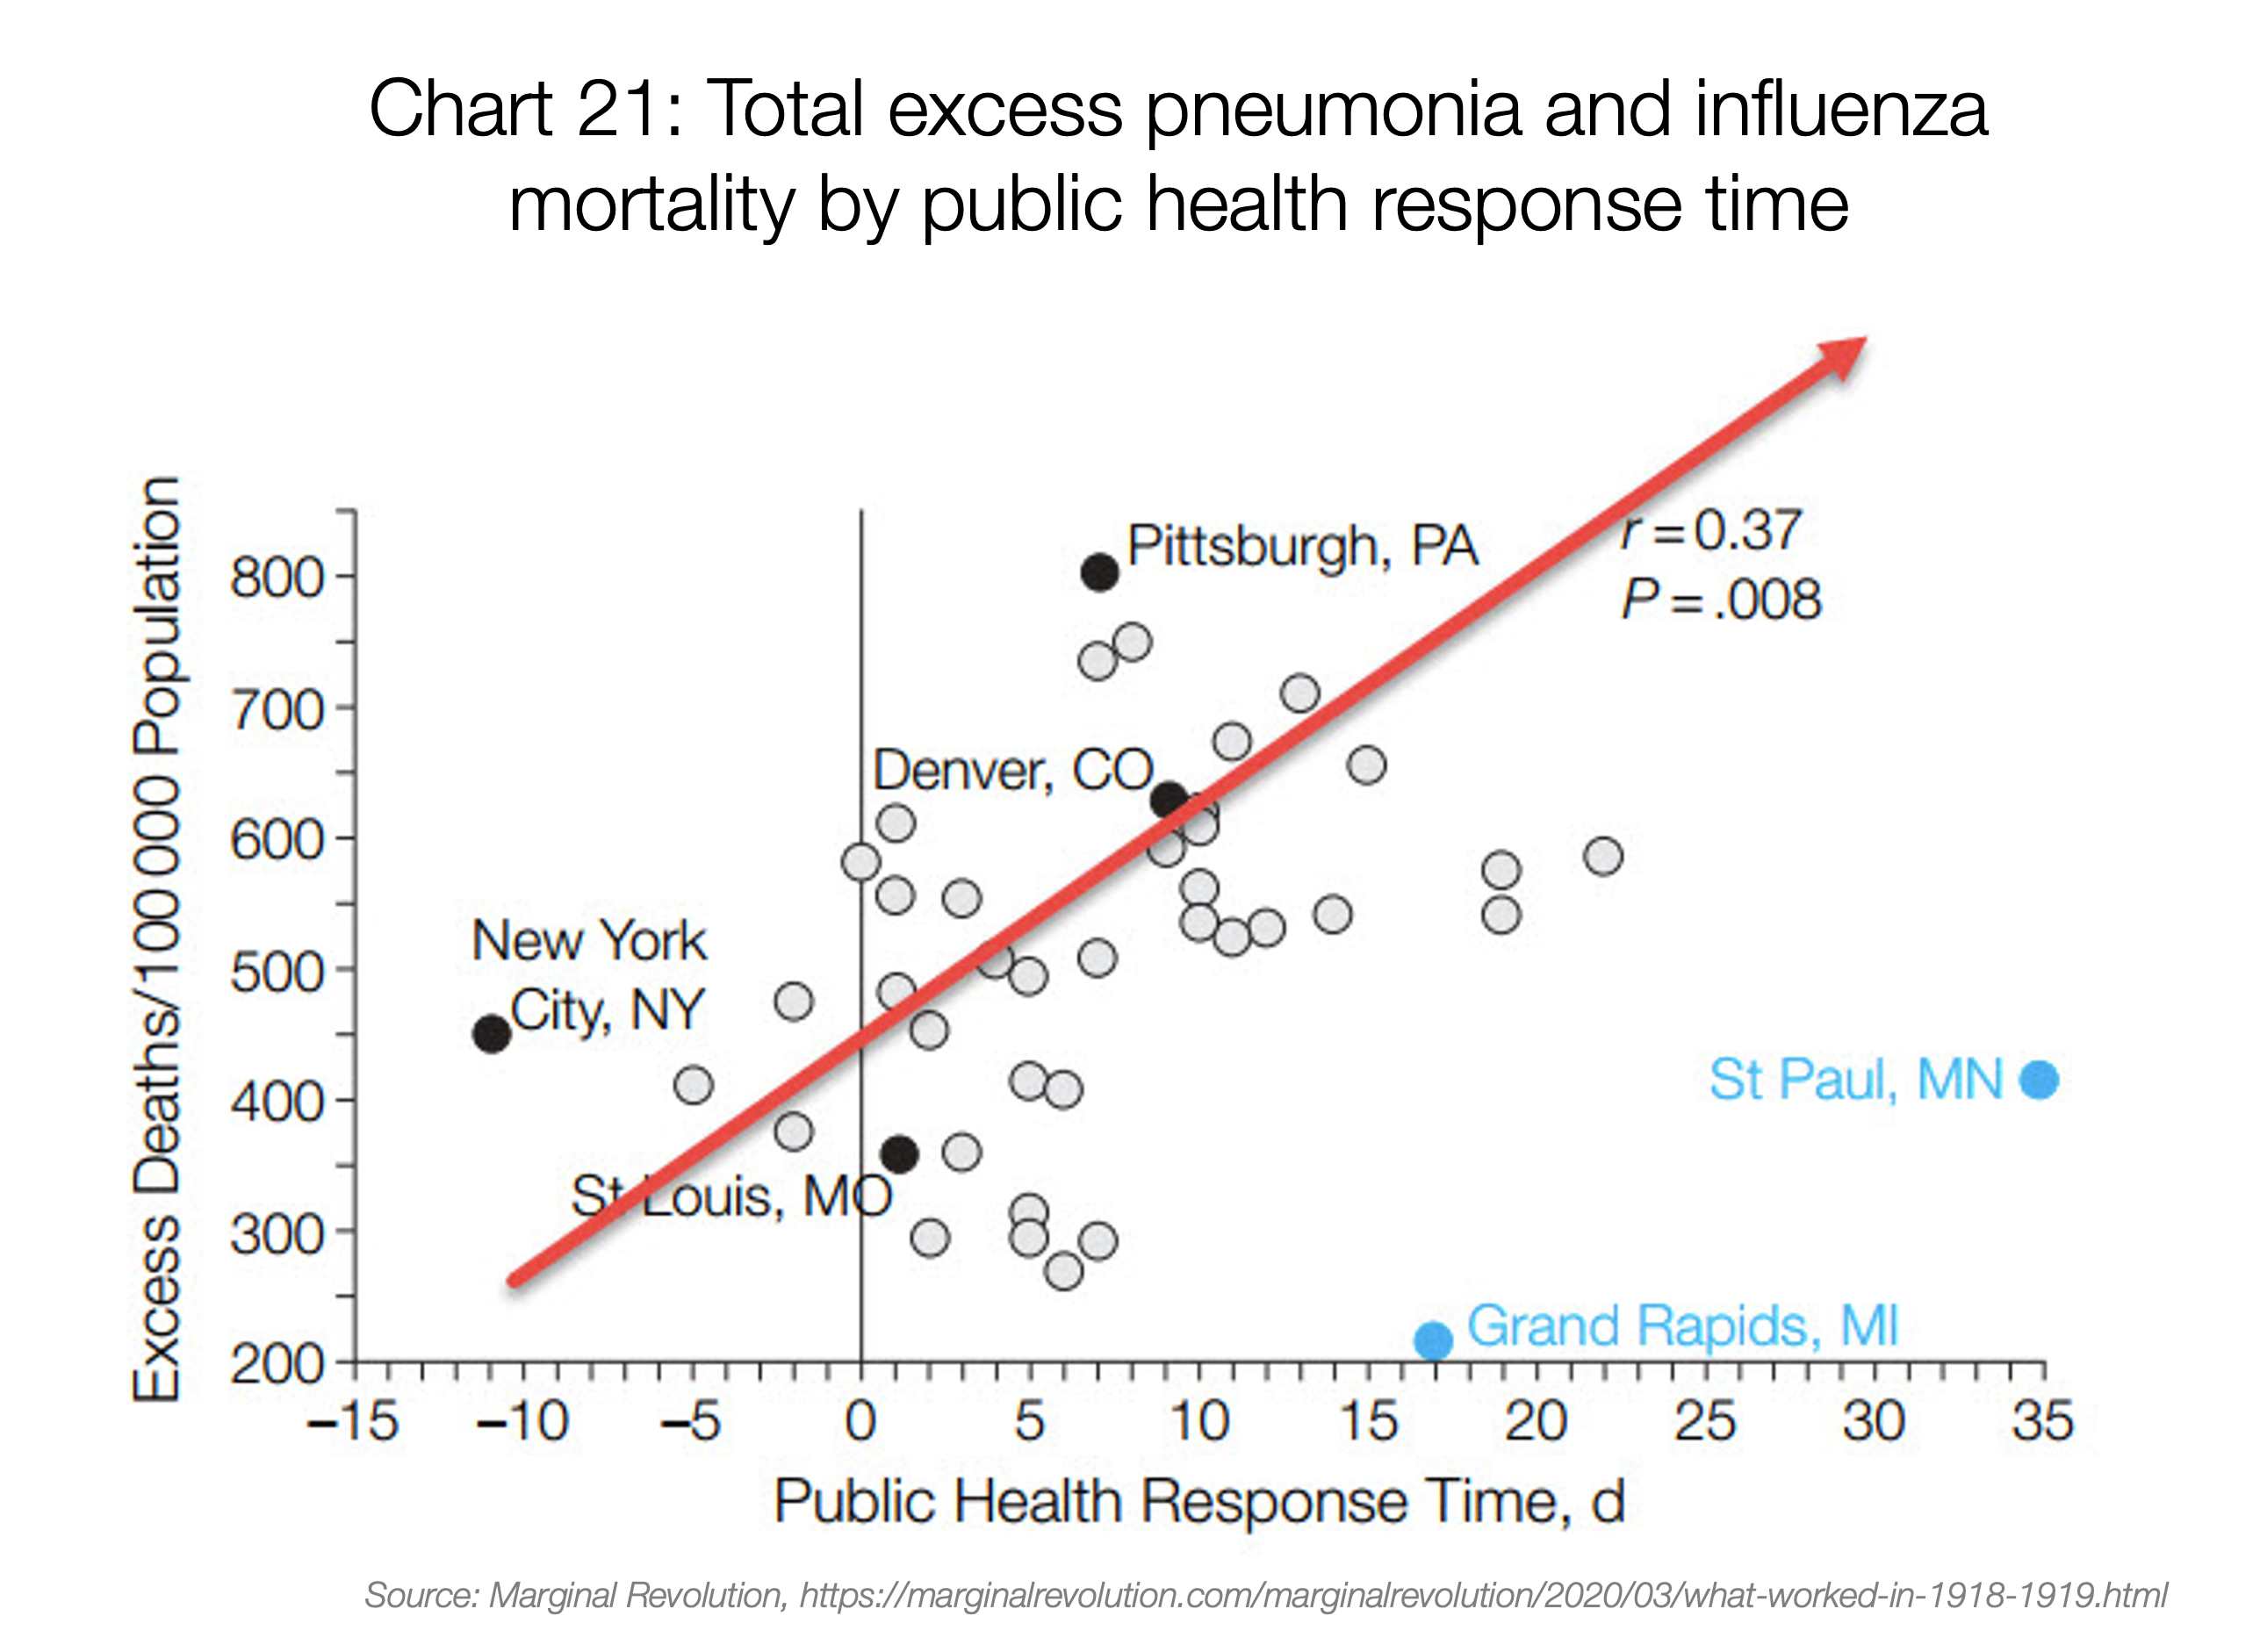
The chart shows mortality in the United States in 1918, depending on how quickly the measures were taken. On average, taking measures 20 days earlier reduced mortality by half.
Italy finally figured it out. At first they isolated Lombardy on Sunday, and a day later, on Monday, they realized their mistake and decided that they needed to lock the whole country.
I hope that in the coming days we will see results, but in general it will take from one to two weeks. Remember the Wuhan chart: there was a 12-day delay between the moment the block was announced and the moment when official cases (orange bars) began to decline.
How can politicians contribute to social exclusion?
If you are a politician in a region affected by a coronavirus, you should immediately follow the example of Italy and order to isolate the country.
Here is what the Italians did:
- No one may enter or leave quarantine zones unless the reasons related to family or work are proven.
- Traffic within zones should be avoided unless it is justified by urgent personal or working reasons and cannot be delayed.
- People with symptoms (respiratory infection and fever) are “strongly advised” to stay at home.
- Standard day off for healthcare providers pauses
- Closing of all educational institutions (schools, universities ...), gyms, museums, ski stations, cultural and social centers, swimming pools, theaters.
- Bars and restaurants have a limited opening time from 6 AM to 6 PM, with a distance of at least one meter (~ 3 ft) between people.
- All pubs and clubs should be closed.
- All commercial activities must be conducted with a distance of at least one meter between visitors. If this company cannot provide this, it should be closed. Temples can remain open as long as they guarantee this distance.
- The visits of relatives and friends to the hospital are limited.
- Work meetings should be deferred. Work at home should be encouraged.
- All sporting events and competitions, public or private, are canceled. Important events can be held behind closed doors.
These are the smallest measures that should be taken. If the goal is to ensure security, we must act on the model of Wuhan. People may complain now, but they will be grateful afterwards.
How can leaders contribute to social exclusion?
If you are a team leader and want to know what you should do, Staying Home Club will be your best resource .
This is a list of US technology companies that have put in place a policy of social exclusion - so far there are 85 of them. The policy ranges from allowing work at home and restricting office visits to canceling travel or corporate events.
There are several other things that each company must decide, for example, what to do with hourly employees, whether to leave the office open, how to conduct interviews, what to do with cafeterias ... If you are interested in how my company dealt with some of these issues, you can find with policy and sample ad .
4. When?
It is possible that so far you have agreed with everything that was said above, and from the very beginning you wondered when to make each decision - or, in other words, what should become a trigger for each measure.
Risk-based decision model
To solve this problem, I created a model .
It allows you to assess the likely number of cases in your area, the likelihood that your employees are already infected, and how the situation will evolve over time. All this should tell you if it's time to enter quarantine in the office.
The model tells us about such things:
- If your company has 100 employees in the state of Washington, where 11 coronavirus deaths occurred, then there is a 25% chance that at least one of your employees is infected and you should close immediately.
- If your company has 250 employees mainly in the South Gulf (San Mateo and Santa Clara counties, which together have 22 official cases, and the actual number is probably not less than 54), then by March 9 you will have a ≈2% chance that at least one employee will be infected.
- If your company is located in Paris and has 250 employees, today the probability that one of your employees will become infected with coronavirus is 0.85%, and by tomorrow it will be 1.2%, so if you are comfortable only with 1% chance, then by tomorrow you should close your office.
This model uses labels like "company" and "employee", but it can be used for everything else: schools, public transport ... So if you have only 50 employees in Paris, but they all ride the metro, colliding with thousands of other people, then in the obvious way the likelihood that at least one of them gets infected is much higher, and you should close your office immediately.
Are you part of a leadership group?
The proposed model is very selfish. She considers the risk of each company individually, taking on as much risk as we want, until the inevitable hammer of the coronavirus closes our offices.
But if you are part of a group of entrepreneurs, you are a member of the board of directors of a holding or a political fraction, then your calculations are not intended for one company, but for the whole. Calculations are changing: what is the likelihood of infection of any of our companies? If you manage a group of 50 companies with an average of 250 employees, then in the San Francisco Bay area, the probability that at least one of the companies becomes infected is 35%, and the probability that this will happen next week will be 97%. I specifically added a tab to the model to play with this scenario.
Conclusion: Cost of Waiting
Making a decision today can be scary, but you should think about this problem in a different way.
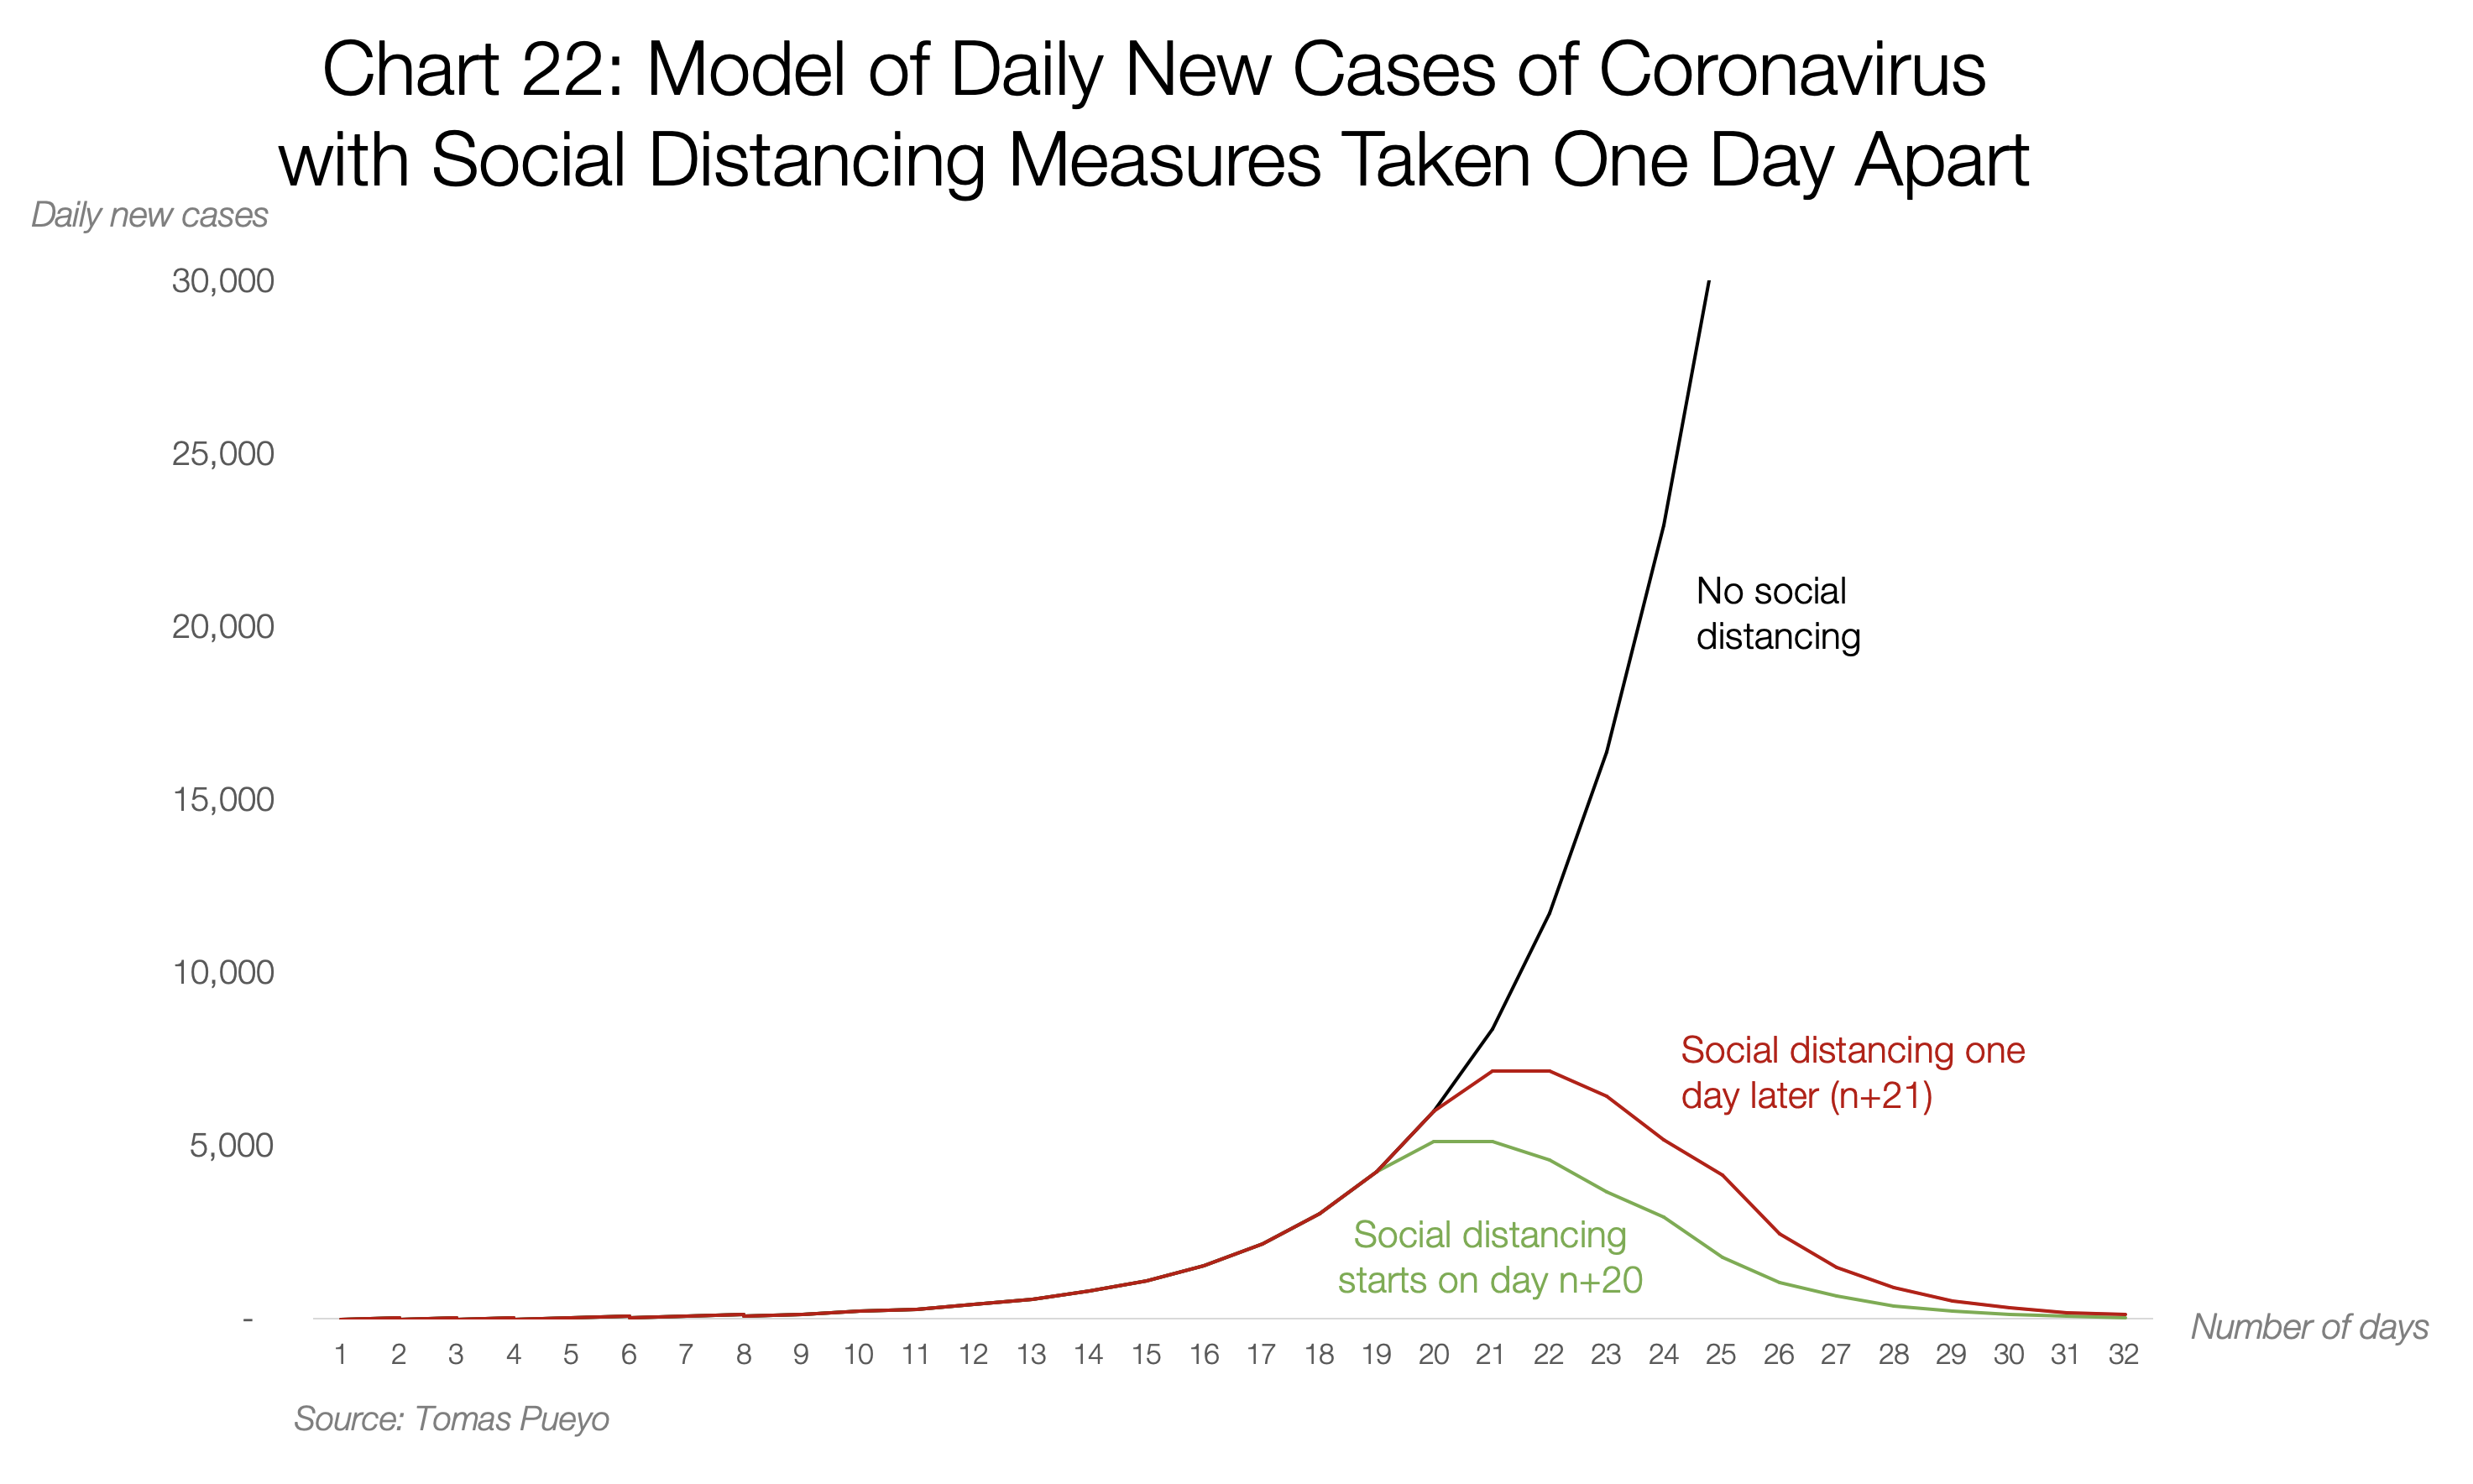
This theoretical model shows different communities: one does not take measures for social isolation, the other takes them on day N of the outbreak of the virus, and the third on day N + 1. All the numbers here are completely fictitious (they are chosen so as to approximately resemble the situation in Hubei, with ≈6000 new diseases daily in the worst case). This is just an illustration of how important it can be just one day when something grows exponentially. You can see that the one-day delay reaches a peak later and higher, but then daily events converge to zero.
But what about the total number of diseases?
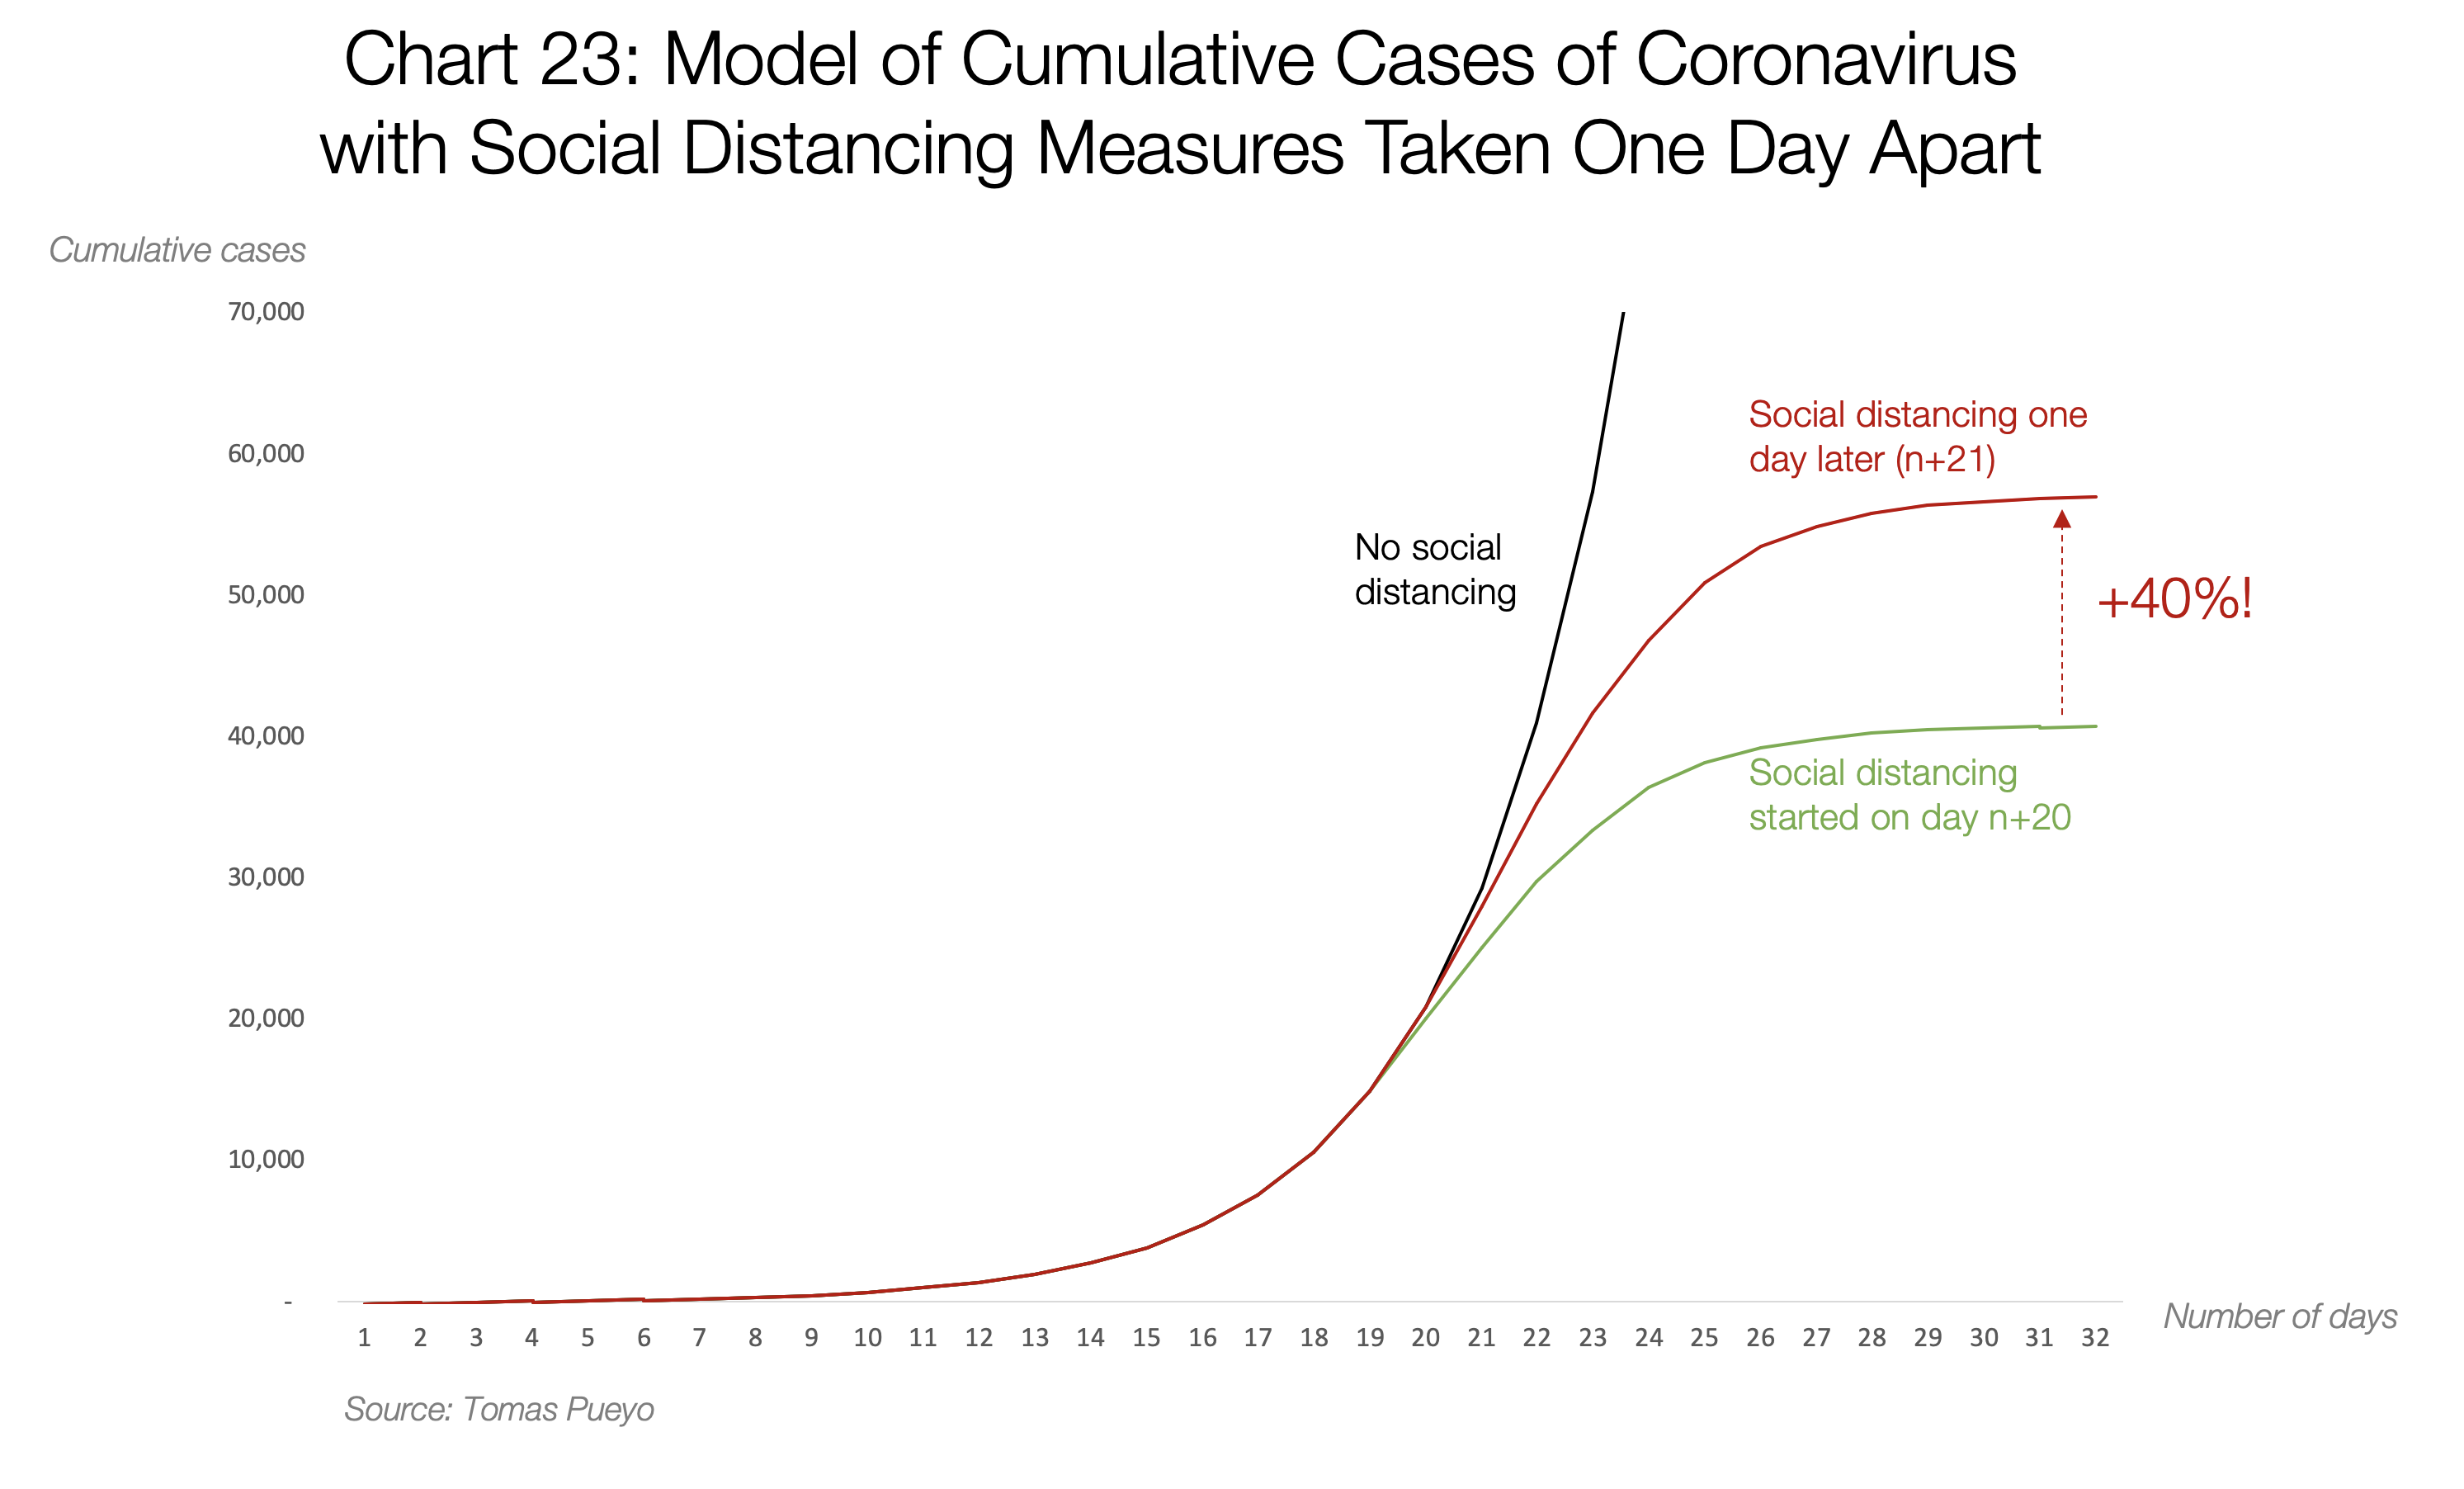
In this theoretical model, vaguely reminiscent of Hubei, waiting just one day creates 40% more cases! Perhaps if the Hubei authorities declared quarantine on January 22 instead of January 23, they could reduce the number of diseases by a staggering 20,000.
And remember, this is just the number of people infected. Due to the expectation, mortality would be much higher, and this is not only a direct effect - the number of deaths would increase by more than 40%. Inevitably, the collapse of the healthcare system would be more critical, which would lead to an increase in mortality by 10 times, as we saw earlier. Thus, just a one-day delay in introducing social exclusion can end with an explosive increase in the number of deaths in your community, multiplying the number of cases and bullying mortality.
This is an exponential threat. Every day counts. When you postpone the decision for one day, you do not contribute to several cases of infection. Your community may already have hundreds or thousands of people who are sick. Every day, when there is no social isolation, these cases continue to grow exponentially.
Share information
This is probably the only time in the last decade that text distribution can save lives. Everyone must understand what is being discussed so that we can prevent a catastrophe. We must act now.
See also: