City without traffic jams
Ⅰ. Art wisely apply traffic lights
Ⅱ. The art of designing road networks
Chapter one.
Art wisely apply traffic lights
Little Preface
Every day, when we are near the intersection, we see the same picture, as cars rush forward in the green light, and in the red - they accumulate in front of the traffic light in long lines of useless waiting. But how familiar is it necessary at the same time and can it be done so that in their journey through the city, motorists almost did not have to “stand” in the red light? I think many of us have heard of the mythical "green waves." Once in such a wave and maintaining a certain speed, the motorist will miraculously drive up to each intersection just at a time when the traffic light is lit in its direction with a green light. It is quite simple to organize the propagation of such “waves” along one isolated road, but it is not at all obvious whether this can be done on the roads of the entire city at once.
In the first chapter of this article, I will build a small theory for cities with a "Manheton" layout and answer the question of how best to regulate traffic on their streets with the help of traffic lights. The second chapter will be devoted to the possibilities of using multi-level interchanges and highways.
The material of the first chapter does not formally require the reader any knowledge that goes beyond the school curriculum, although it does imply a certain culture of reasoning, the presence of a pencil and free evening, perhaps not the only one. I hope that the work done will be useful to people designing cities and planning urban traffic.
Formal Description of the Problem
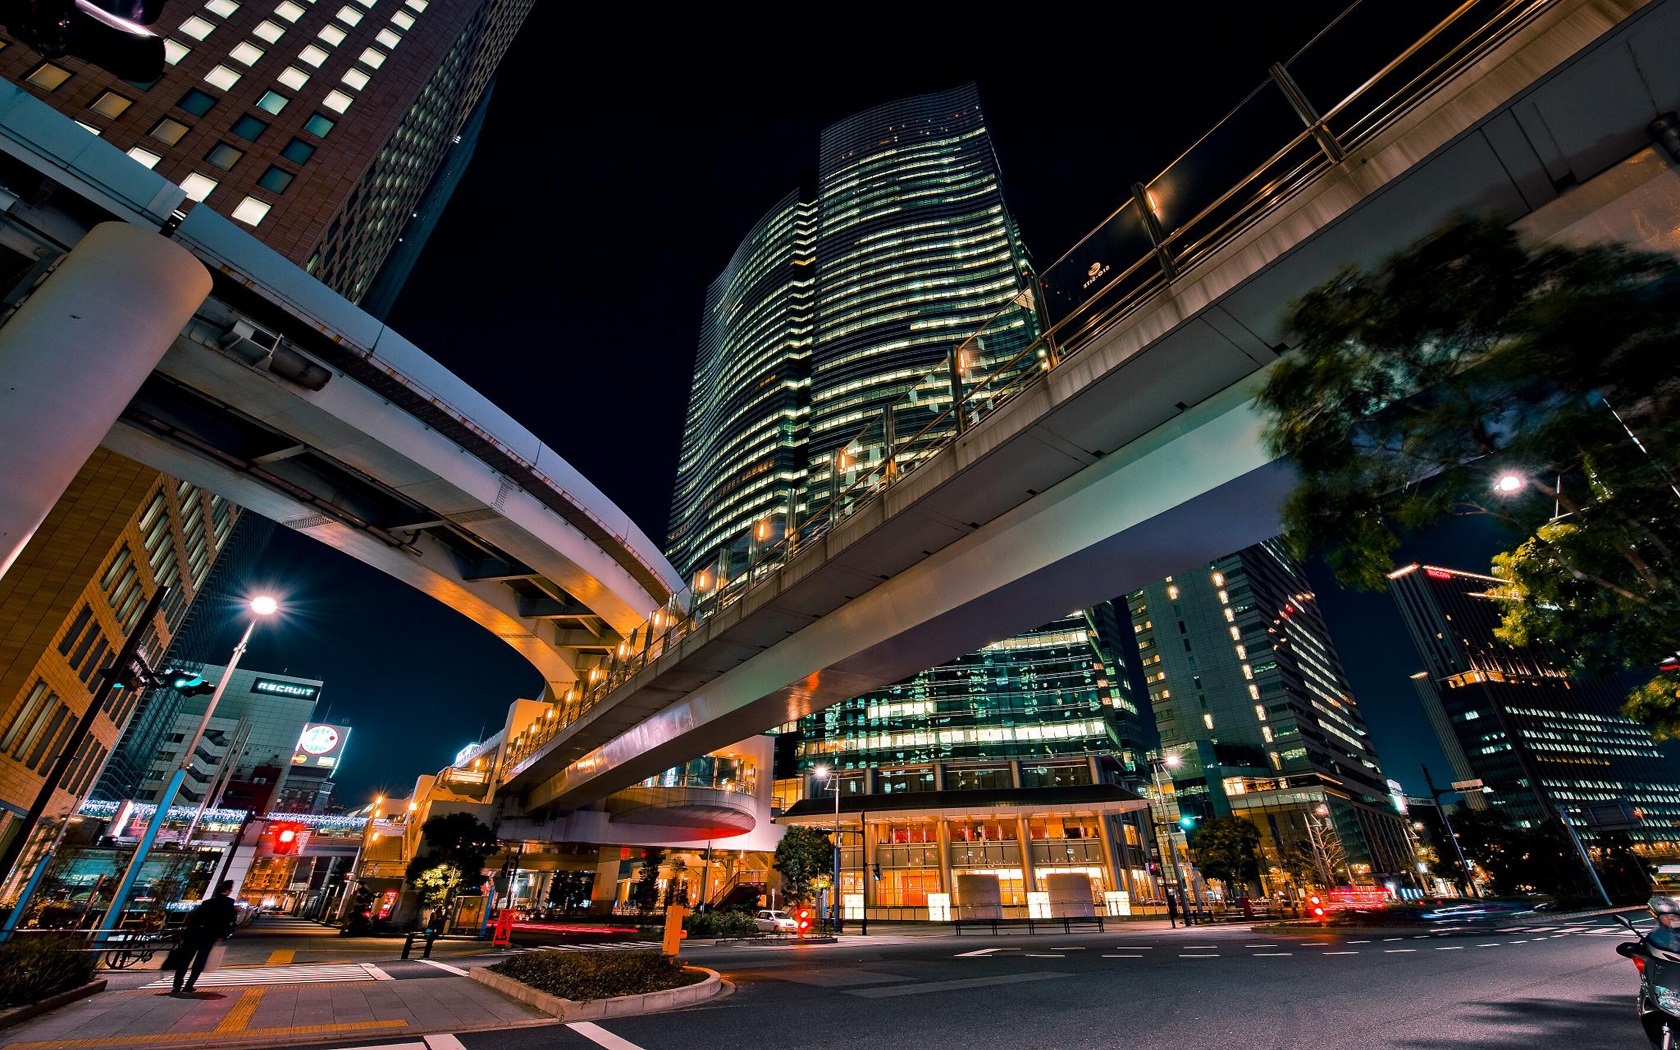
Imagine a city model built on a large table with rectangular blocks and through roads (Figure 1). It is convenient to simulate traffic flows on such a layout with long narrow strips of paper stacked along the streets, continuously sliding, each in its own direction.
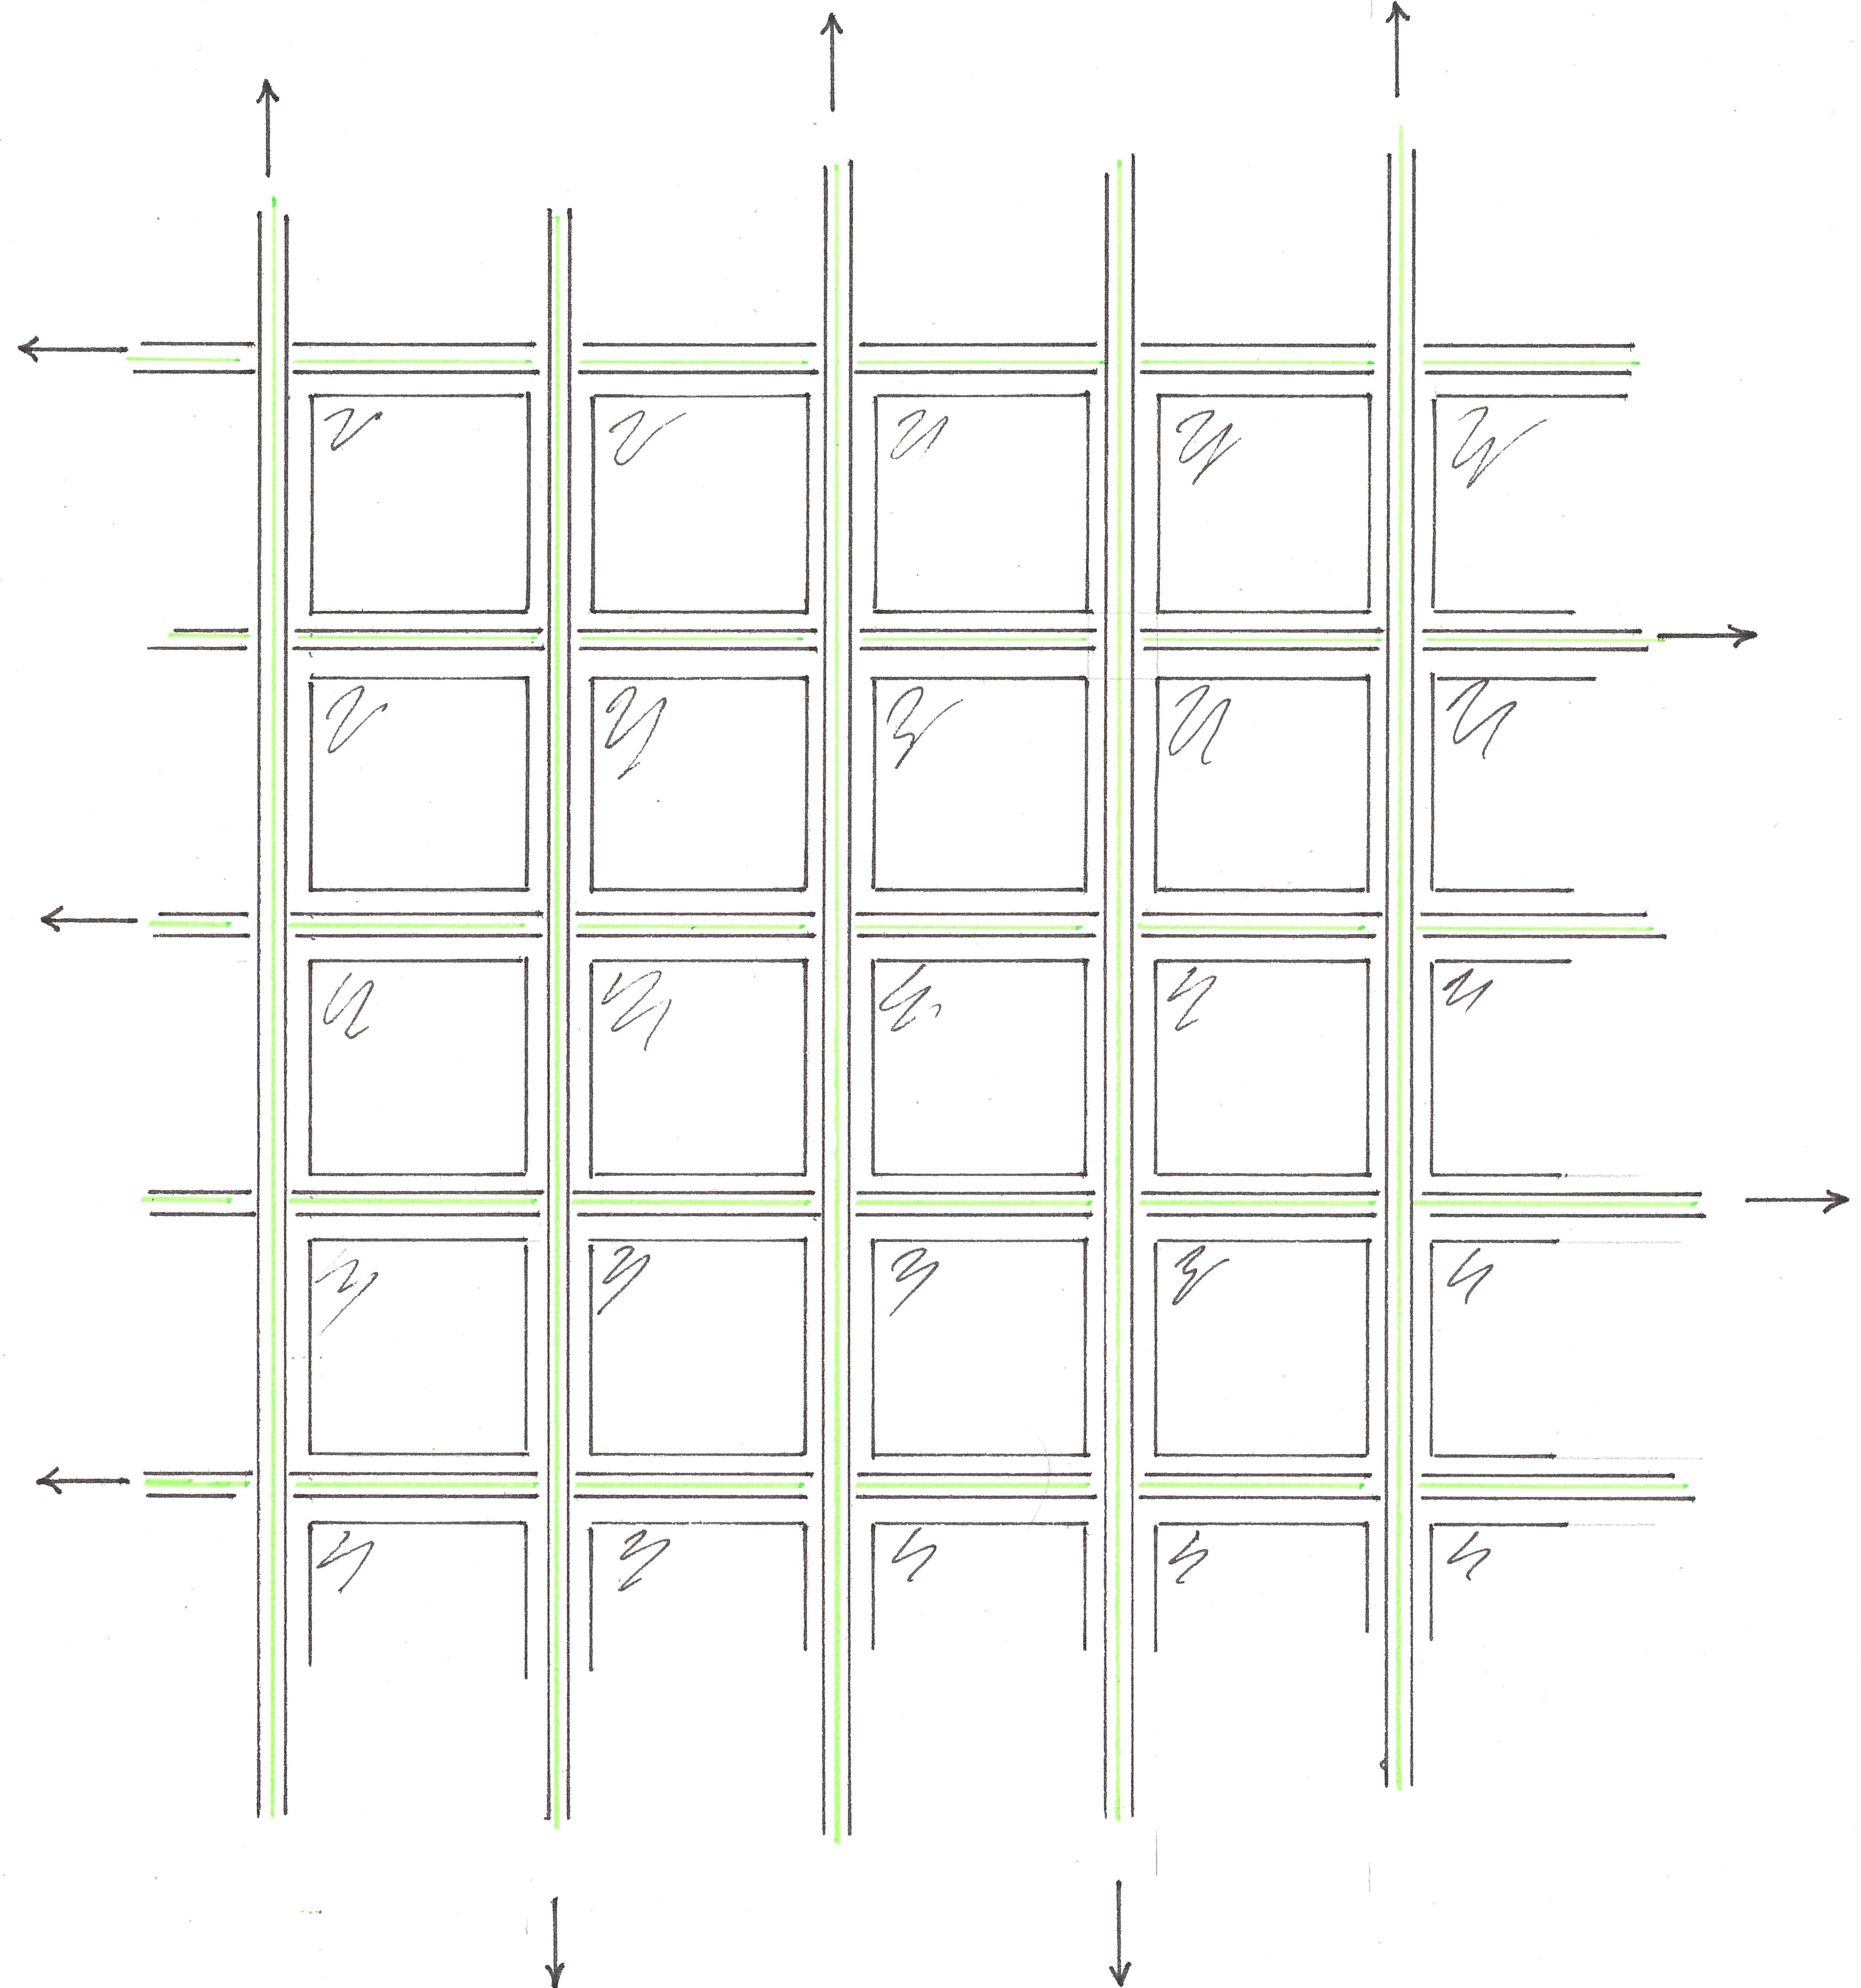
Fig. 1
Throughout the chapter, it will be assumed that the movement of flows occurs at a constant and the same speed for all. Under these conditions, modeling of green waves reduces to dividing each stream (paper strip) into white and black zones and it is believed that cars can move with the stream only inside its black zones (Figure 2).
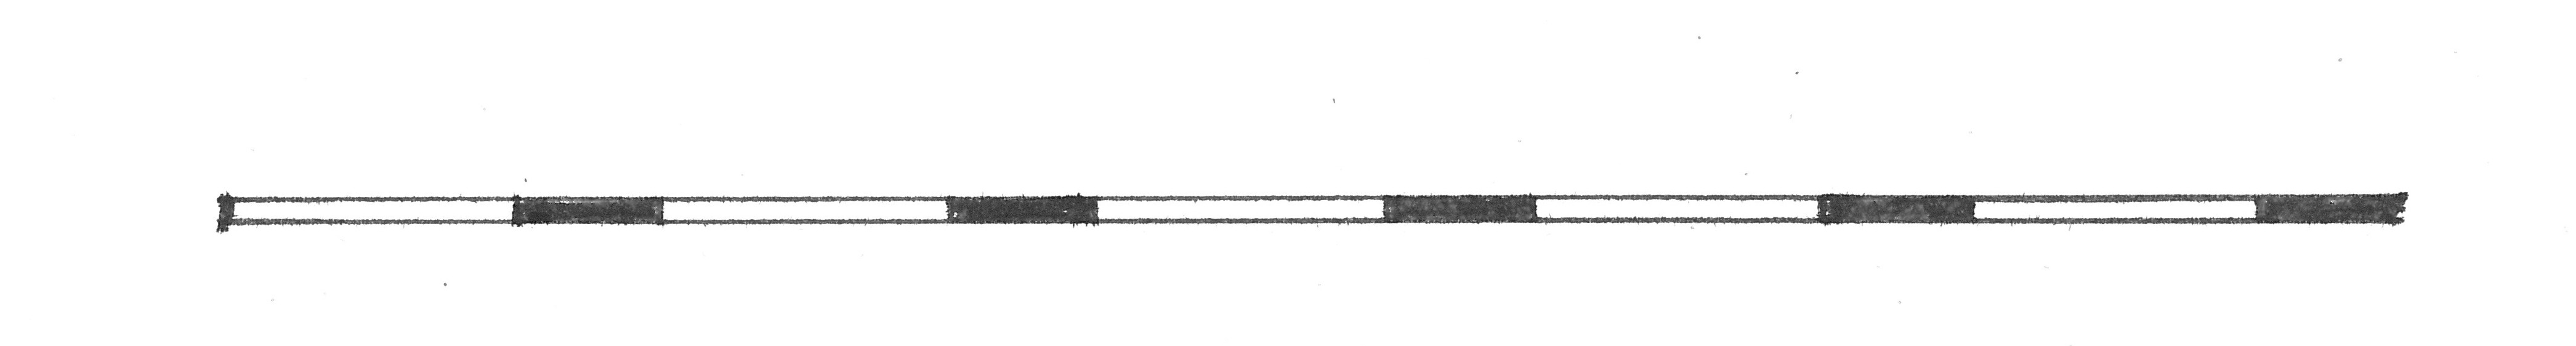
Fig. 2
Conflicts in the movement of cars will certainly be avoided if the code situation does not arise, the same intersection is blocked by black zones of two intersecting flows at once.
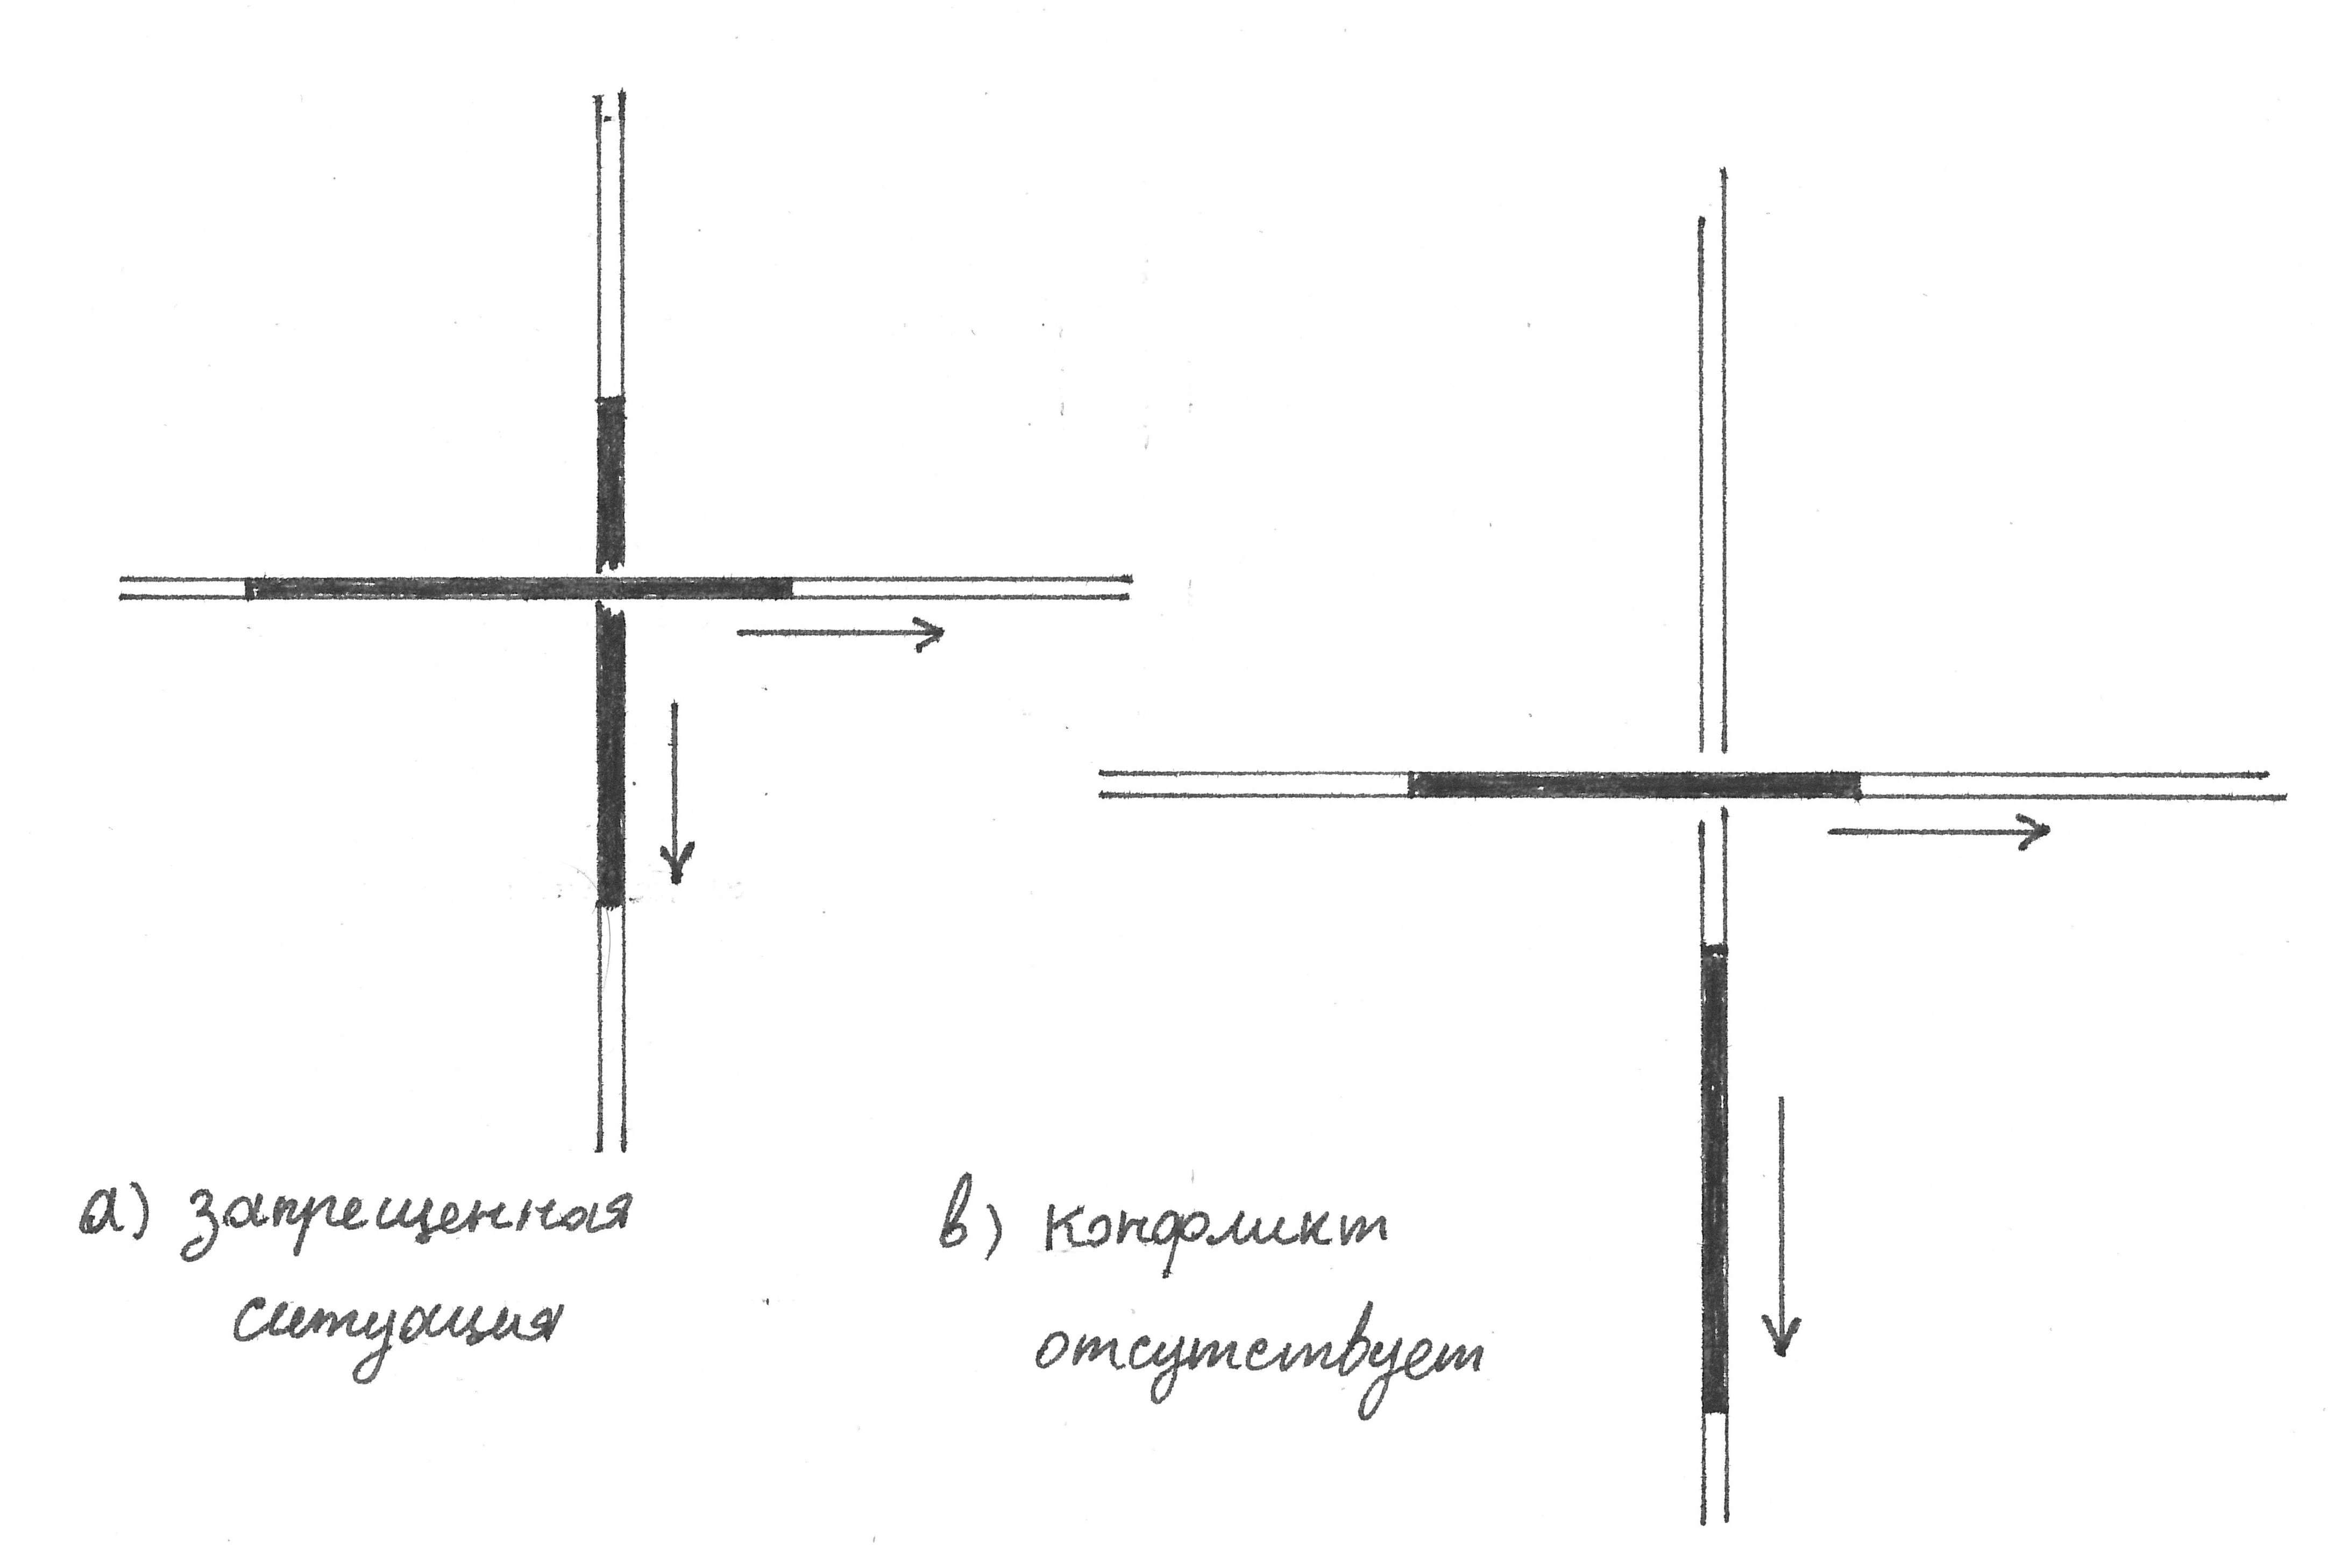
Fig. 3
In relation to the partition into zones, we require that they be periodic, with the same spatial period T for all flows , and that for each such period there should be only one black zone. In practice, this requirement means that the cycles of all traffic lights have the same duration and for one cycle the green light in any direction lights up at the traffic light no more than once.
First solution
Now it has all the necessary means to try to find the (non-conflict) placement of “green waves” on a square block layout. The good news: at least one such arrangement exists, and to find it, you do not even need to build any theories - it’s enough to sit in an armchair for half an hour, biting a pencil. Figure 4a shows the position of the black zones of all street flows of the first conflict-free accommodation in this article at one time. The arrows indicate the direction of movement.

Fig. 4a
Since the splitting of flows into zones is periodic in space, and the flow velocities are the same and constant, the picture depicting the position of blacks on a city map should be repeated periodically in time. In the continuation of the half period (temporary) following the moment of Figure 4a, nothing prevents the conflict-free movement of the “arrows” and they will cover a distance of one quarter, each. Having done this (Figure 4b), the arrows will find themselves in a mutual arrangement repeating in detail the arrangement in Figure 4a (accurate to mirror reflection), thus the proof of the conflictlessness of their further movement can be carried out by simple induction.
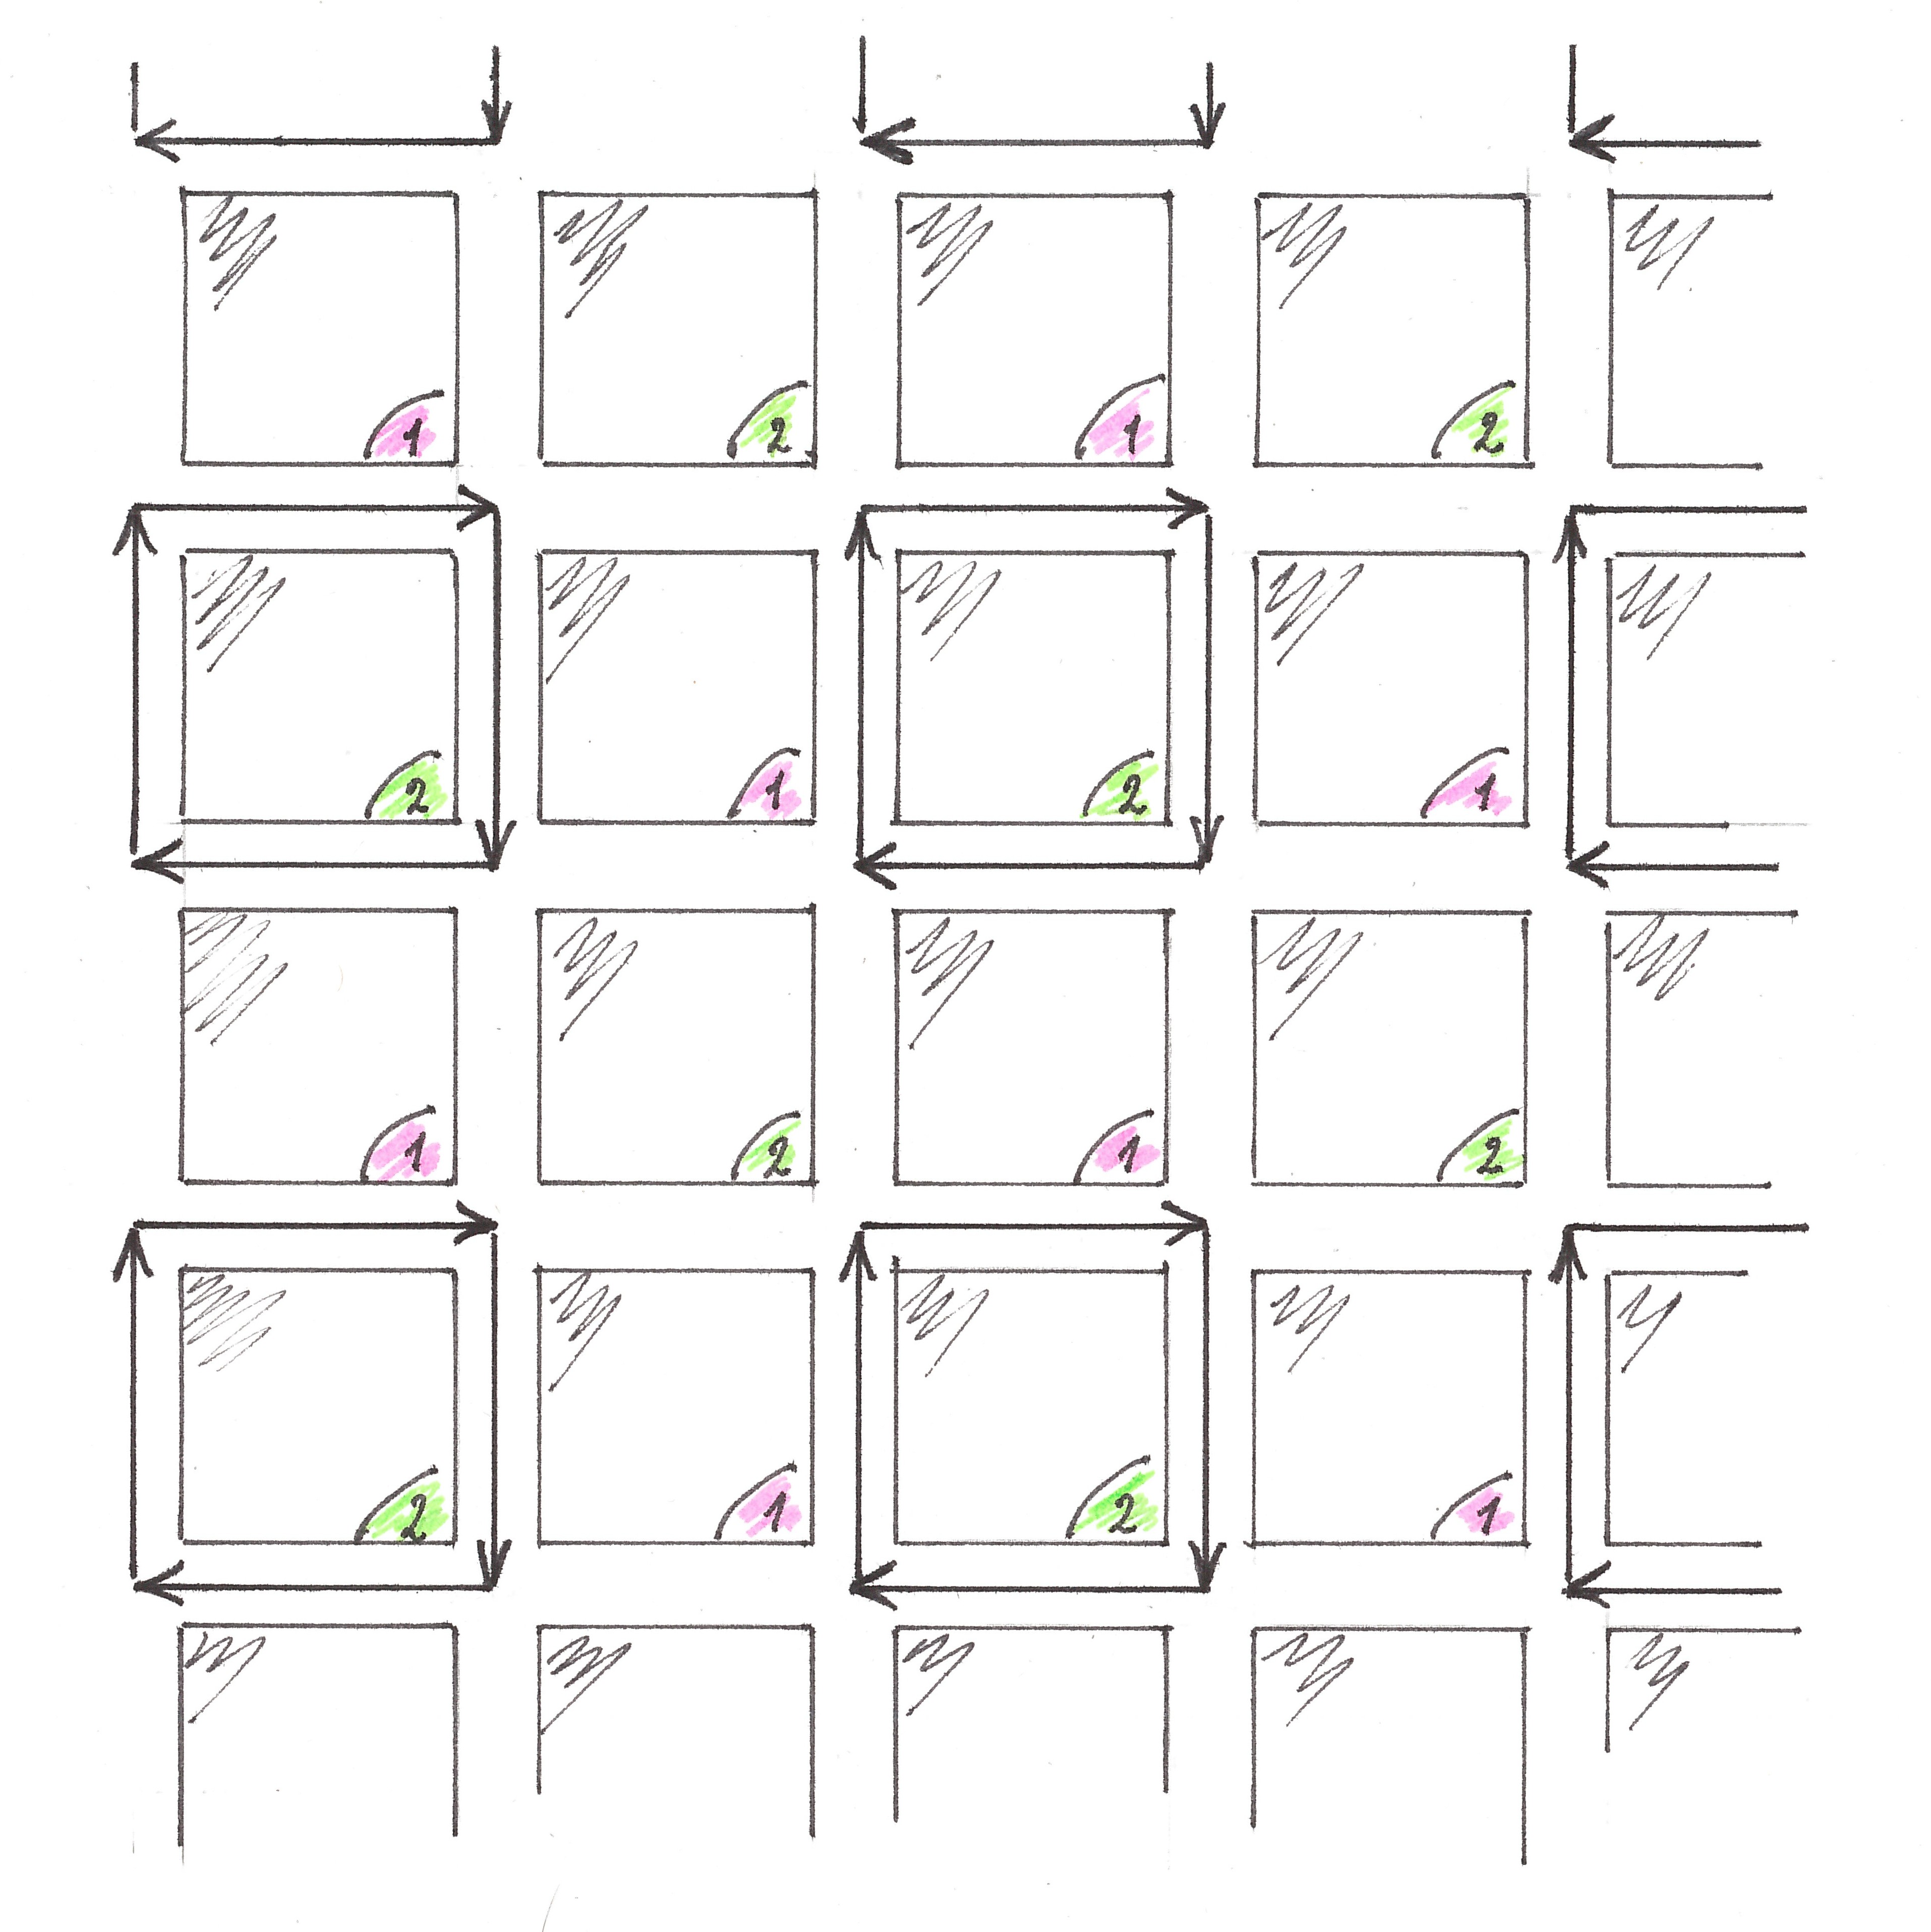
Fig. 4b
The role of traffic lights, a plan for placing green waves in a city with two-way traffic
What should “green waves” form in practice, or, in other words, correctly divide the flows into black and white zones?
As you probably already guessed, this role can be assigned to traffic lights. In fact, there is a close dual relationship between dividing flows into zones and choosing a schedule for the work of traffic lights. We will call the work of a traffic light conflict-free if it never lights green simultaneously in two cross directions. Let the conflict-free dividing of traffic flows into black and white zones be given first.
Every time when the intersection reaches the front edge of the next black zone of a stream, we will make the traffic light at the intersection light up in the direction of this stream with green light and switch back to red at the moment when its back edge leaves the intersection behind - this will create a conflict-free schedule the work of all traffic lights. Conversely: by highlighting in black those intervals within the flows, the points of which pass all the traffic lights they encountered in green light, you will get a splitting of the flows into black and white zones.
If the schedule prescribed traffic lights to work without conflict, then the partition induced by this schedule will also be conflict free. Of course, in order for the splits of the streams to turn out to be periodic, with periods identical for all streams and for each such period there is only one black zone, some additional requirements will have to be imposed on the traffic light schedules.
The simple consequence of the described dualism will be especially important for us: The
schedule obtained by the conflict-free partitioning of flows into zones induces exactly the same partition.
It is noteworthy (try to give an appropriate example) that the symmetric statement is no longer true.
And so, since splitting flows into zones and setting traffic light schedules are interchangeable ways of describing urban traffic, we are free to use any of them for the task of finding the locations of green waves. Usually the first is more visual and convenient, but sometimes, as in the following example, it is useful to combine both points of view.
Our first solution was to place green waves in one-way streets. Now let's try to get its "two-sided" option. First, note that the traffic lights of the First Solution can be divided into two categories. Within each category, all traffic lights operate synchronously, while the work of traffic lights from different categories is in antiphase. For example, in the next half of the period following the moment shown in Figure 4a, all traffic lights of the first category will light green for streets running along the horizontal (relative to the position in the figure) and red - along the vertical, and traffic lights of the second, on the contrary, are the same half of the period for horizontal streets will be red, and for vertical streets green. It is noteworthy that in the described situation, turning any traffic light 180 degrees does not change the schedule of its work.
At this point in the storytelling, it will be convenient to imagine the layout of the city, together with its traffic lights and traffic streams, as an animated picture on a transparent screen.
Let two such screens synchronously broadcast the movement of flows of the First Solution be precisely superimposed on each other. If now one of the screens is rotated 180 degrees around the center of some intersection, then the layout of the streets of the upper screen will again overlap exactly with the layout of the lower screen, but at the same time, the directions of the traffic flows superimposed on each other will become opposite on all the combined streets. The most remarkable thing here is the fact that the movement of flows from different screens will still not create zone conflicts at combined intersections.
Indeed, the splitting of flows into zones on the first and on the second screen is completely determined by the work of traffic lights, but when turning, as can be seen from Figure 4a, all traffic lights that are combined with each other always fall into the same categories, and, as a consequence of the category invariance mentioned above, cornering 180 degrees, should work absolutely synchronously. After the comments made, the conflict-free movement of the flows becomes a consequence of the conflict-free schedule of each of the traffic lights. For those readers to whom my proof seemed too confusing, I will say the good old Greek “look” (Figure 5)
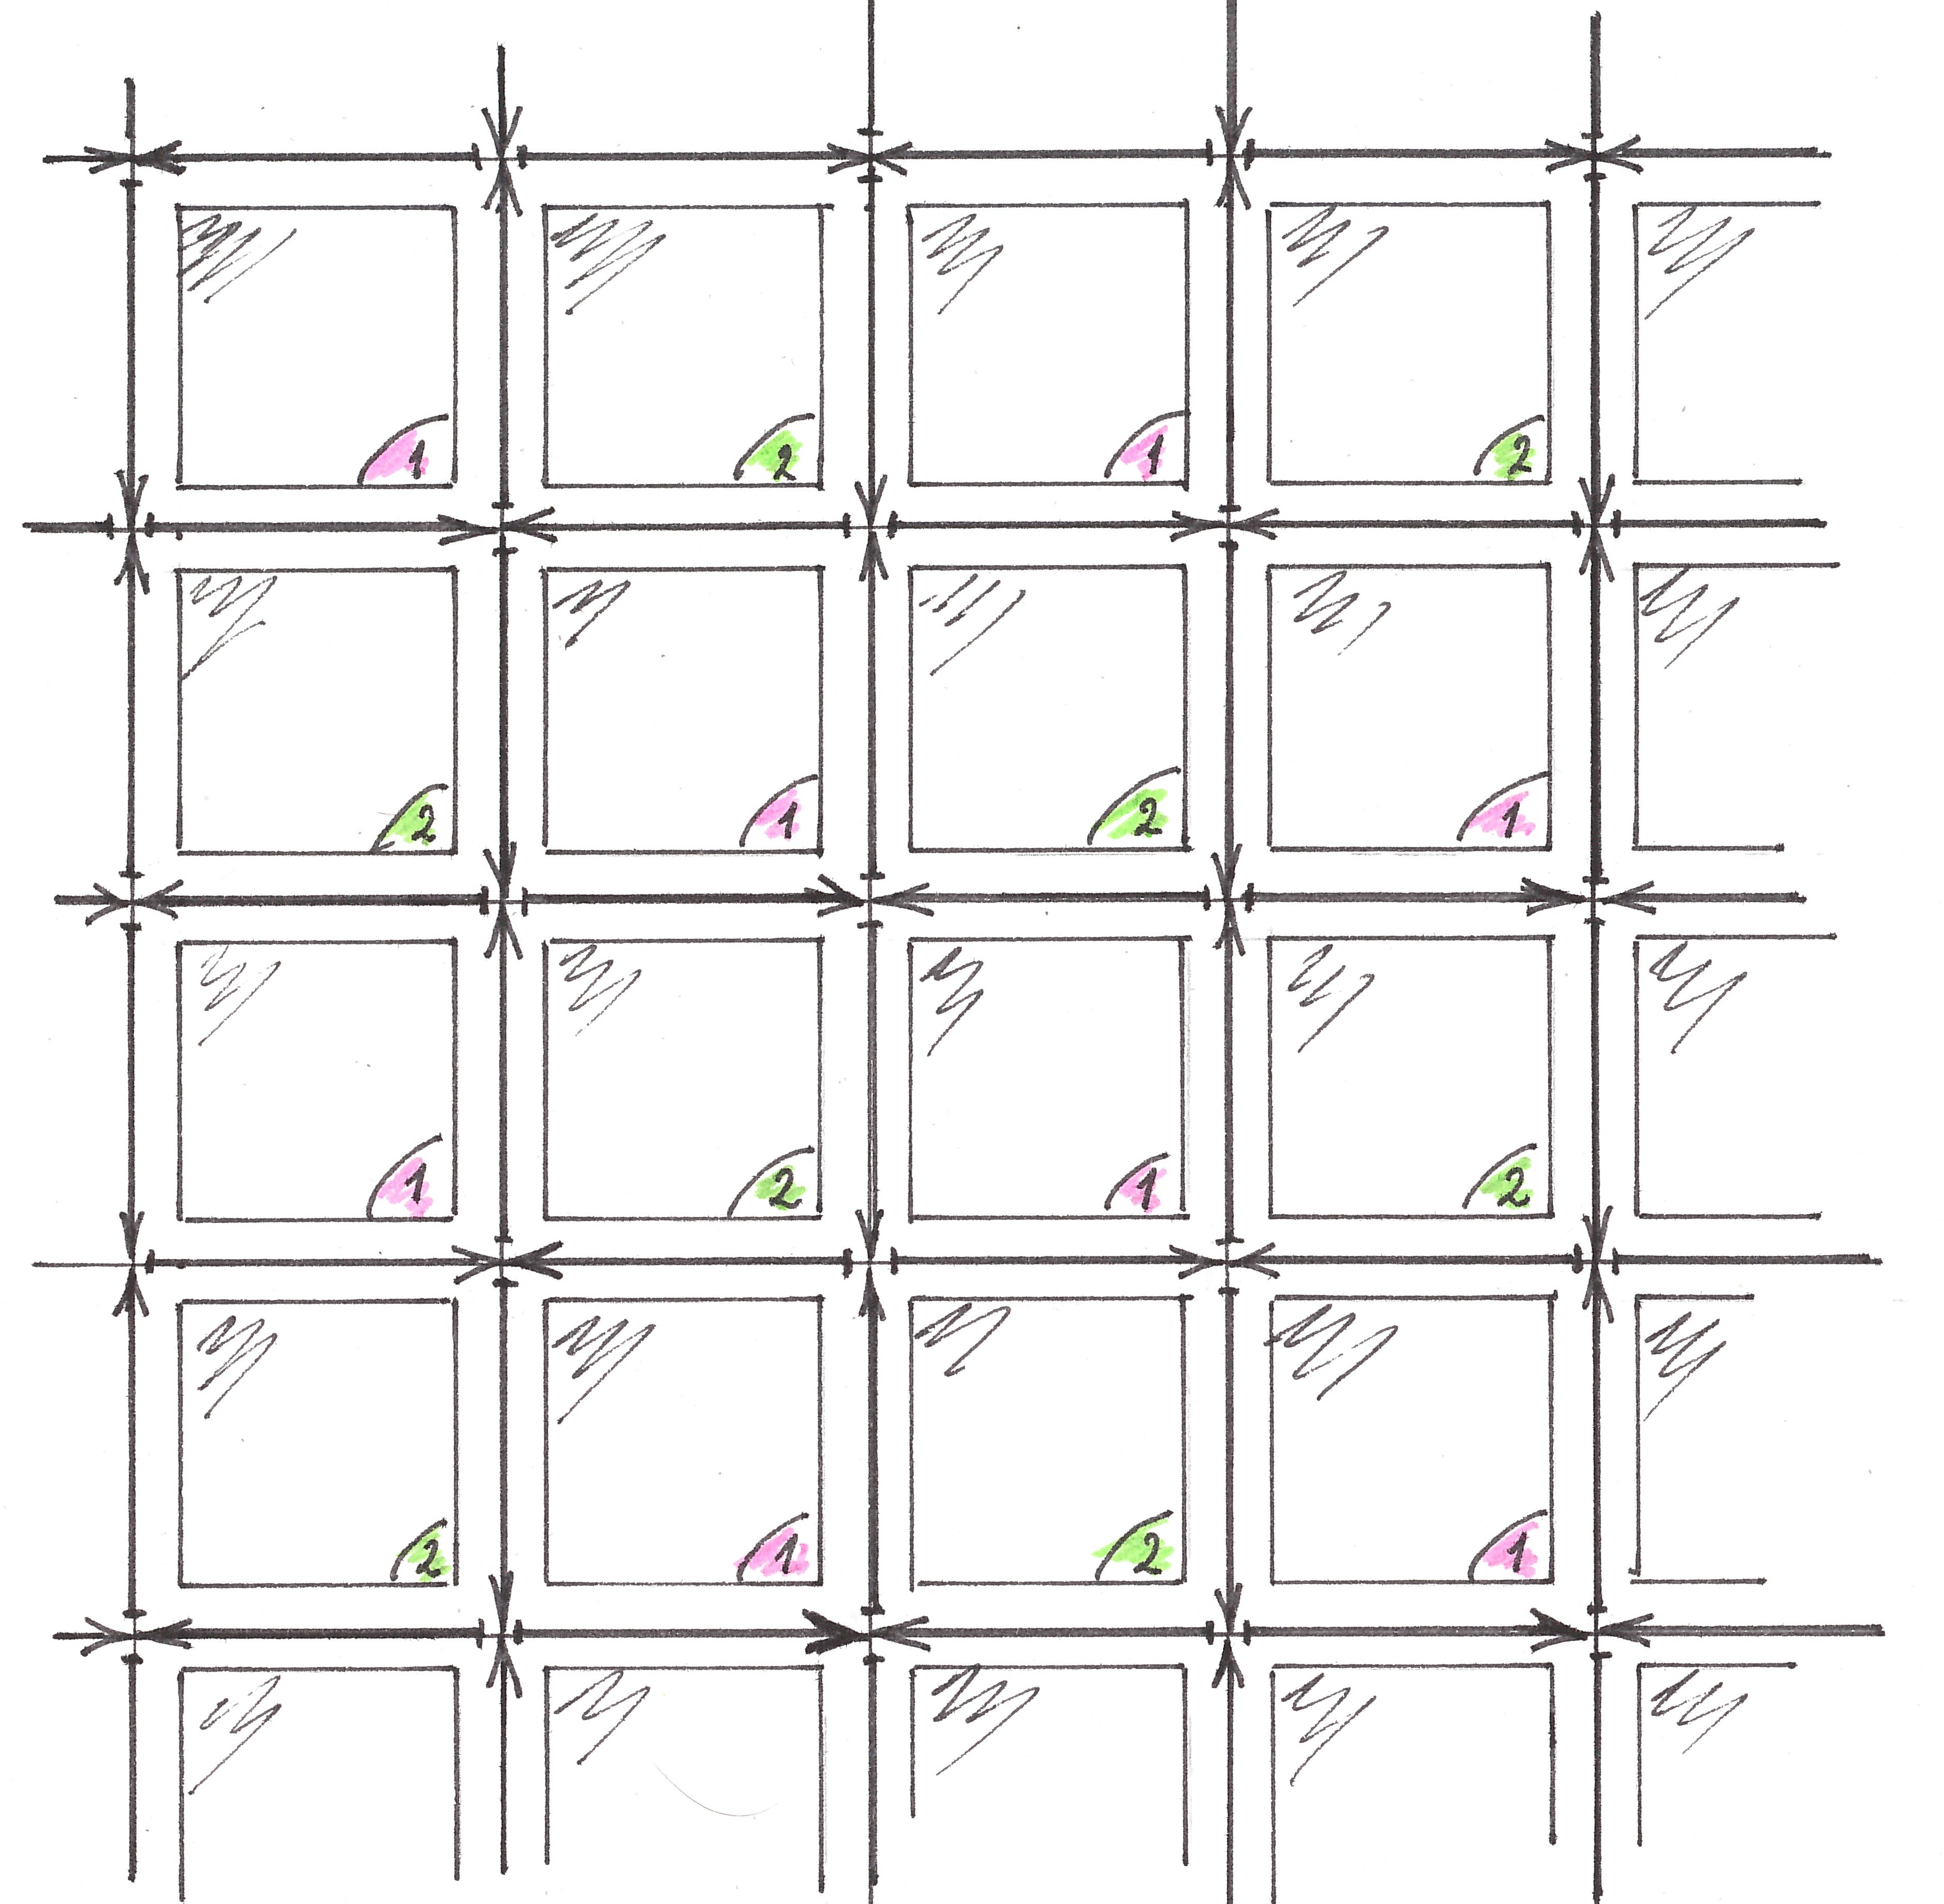
Fig. 5
Obvious advantages of the Manhattan layout, hidden restrictions of the green wave regime
And so, why are rectangular blocks and roads that stretch from one end of the city to the other good?
1) The objectivity of the perception of distances within the city.
I think one of those funny situations happened when many people travel for forty minutes from one place to another for a whole year, and then it turns out that they are one from another in a fifteen minute walk along a picturesque square. In a frankly “square” city, on the contrary, it is difficult to make a mistake in the distance between the numbered streets. This implies
2) The ease of personal navigation and public transport schemes.
No navigators or mobile applications are needed: between any quarters there is always a route from no more than one section of vertical movement and no more than one section of horizontal movement. If a tram or trolleybus runs on each of the streets, then using public transport you will not have to make more than one change in one trip.
3) The economical use of urban space, the overall fault tolerance of the road network.
Oddly enough, a large area of roads built in organically formed cities is used with extremely low efficiency. For example, in the midst of many small streets, often blind alleys, one way or another you have to lay two strips of asphalt, even if the car passes through them only once in a quarter of an hour. In cities with a Manhattan layout, this problem is absent: each street makes a small contribution to the total transit of transport and, as a result, there is no need for large arterial highways, any accident on which can easily lead to loss of communication between entire areas.
4) The absence of any significant loss of time in anticipation of traffic lights.
To do this, it is enough to organize a regime of green waves along each road. If this is done, then during one trip, the loss of time at traffic lights is possible only at the beginning of the journey and when turning from one street to another.
After such, I hope, good advertising of the Manhattan city planning, let's discuss the difficulties that the organization of traffic in the mode of green waves brings with it.
Perhaps the biggest of them is the restriction imposed on the efficient use of roads, or, formally, the share in the traffic flow occupied by black zones in it. Since no more than one of the two streets passes through any intersection at a time, it is impossible to use all the streets at once with an efficiency of more than 50 percent. It is noteworthy that in this sense, the First Solution and its modification for a city with two-way traffic used roads with the greatest possible efficiency.
Let us now try to estimate the length of green waves (the value of the spatial period of dividing into zones) in general and the size of the quarters in the two solutions already found in particular. In my narrow-minded experience, a convenient traffic light cycle cannot have a duration of less than one minute, and a comfortable ride speed cannot be lower than 60 kilometers per hour (1 km / min). Multiplying the duration of the cycle by speed, we find that the green wavelengths of any solution should be at least 1 km. In both locations we found, the length of the quarters was half the wavelength, that is, the smallest could be 500 meters.
Quarters with a length of 500 meters are not uncommon in our cities, although such a length cannot be called comfortable for life. In areas with super high-rise buildings, due to the high density of residents, it is preferable that each building be an independent quarter.
Is there a way to maintain the regime of green waves in a transport network with a large density of road location?
Let us, in the placements shown in Figures 4 and 5, cross out each second “arrow” in each flow in order (it would be possible to cross out every two out of three, or n - 1 out of n). Updated streams will still not conflict, and the length of their spatial period will double. Now squeeze the entire layout in half, both vertically and horizontally. As a result of compression, the spatial periods of greens will return to their original size, and the length of each quarter will be reduced by half.
Although the use of the described trick allows you to unlimitedly increase the density of the location of roads, it, unfortunately, carries unacceptable costs: the coefficient of efficiency of road use decreases in proportion to their density. For example, in comparison with 50% efficiency on a road network with a quarter block size of 500 meters, for reducing the size of blocks to 250 meters, you will have to pay a decrease in efficiency to 25%, and 150-meter blocks with this approach will be delimited by the roads used only 15%.
Of course, two questions come to mind. The first of them is purely practical:
1) How, while maintaining the regime of green waves, can you increase the density of roads to a comfortable value and not lose much in the efficiency of their use?
The second is more likely the fruit of mathematicians' love for ideal objects and extreme cases:
2) Is it possible to increase the density of roads unlimitedly so that the efficiency of using none of them falls below a certain (one for all) limit value?
A slight digression
I was forced to tackle the problem of optimal traffic control on the occasion of my other article on urban transport, and for the sole purpose of repaying a historical debt to this, as it seemed to me, outdated way of organizing traffic. When I first asked myself about the value of the limiting efficiency coefficient (question number two), I was ready to argue with anyone that its value simply must be equal to zero, and any increase in the density of roads in the network will certainly lead to a decrease in the efficiency of applying the green mode on them waves, but, as this often happens in research work, failure to try to prove a false statement gave the key to understanding the true state of things. In the remainder, you’ll learn about a method that allows you to build the placement of green waves both on networks, interesting from the point of view of practical application, as well as on unrealistic networks with arbitrarily high road density. At the end of this chapter, I will leave you an open problem that I have not been able to deal with, and now I ask you to pay attention to one small and elegant theory.
Shading bands
Figure 6 shows at three different points in time two vertical and one horizontal flow crossing them. As already mentioned, the speeds of all flows are assumed to be the same, and the movement - not leading to conflicts between their black zones. Fragment A of the horizontal flow, being black, thereby prohibits black fragments B and C of the vertical flows from being black .
Свяжем с фрагментом A движущуюся синхронно с ним наклонную полосу, граничные прямые которой образуют с вертикалью рисунка угол в 45 градусов. По аналогии с тенью, которую бы отбрасывал A в косых лучах солнца, будь он непрозрачным предметом, назовем эту полосу «теневой». Как видно из того же рисунка, область пересечения связанной с A теневой полосы и любого вертикального восходящего (направленного вверх) потока остается относительно последнего абсолютно неподвижной и, самое главное, не может быть черной.
With each black segment of any horizontal flow, in fact, it is worth connecting two shadow stripes at once: one of them will be tilted towards the segment’s movement (like a tree is tilted towards the wind blow), and the other will meet it. We will agree to call the bands of the first type “red”, and the second - blue (Figure 7).
Fig. 7
The role of the red and blue shadow bands in the created theory is determined by their properties: not a single segment of the upward stream that fell into the “shading” of at least one blue strip, and not a single segment of the downward stream (the vertical stream directed downward) that fell into the shading of at least single red stripes should not be black.
Let us now see how in general the set of all shadow bands looks, for example, the red color of a horizontal stream (Figure 8).
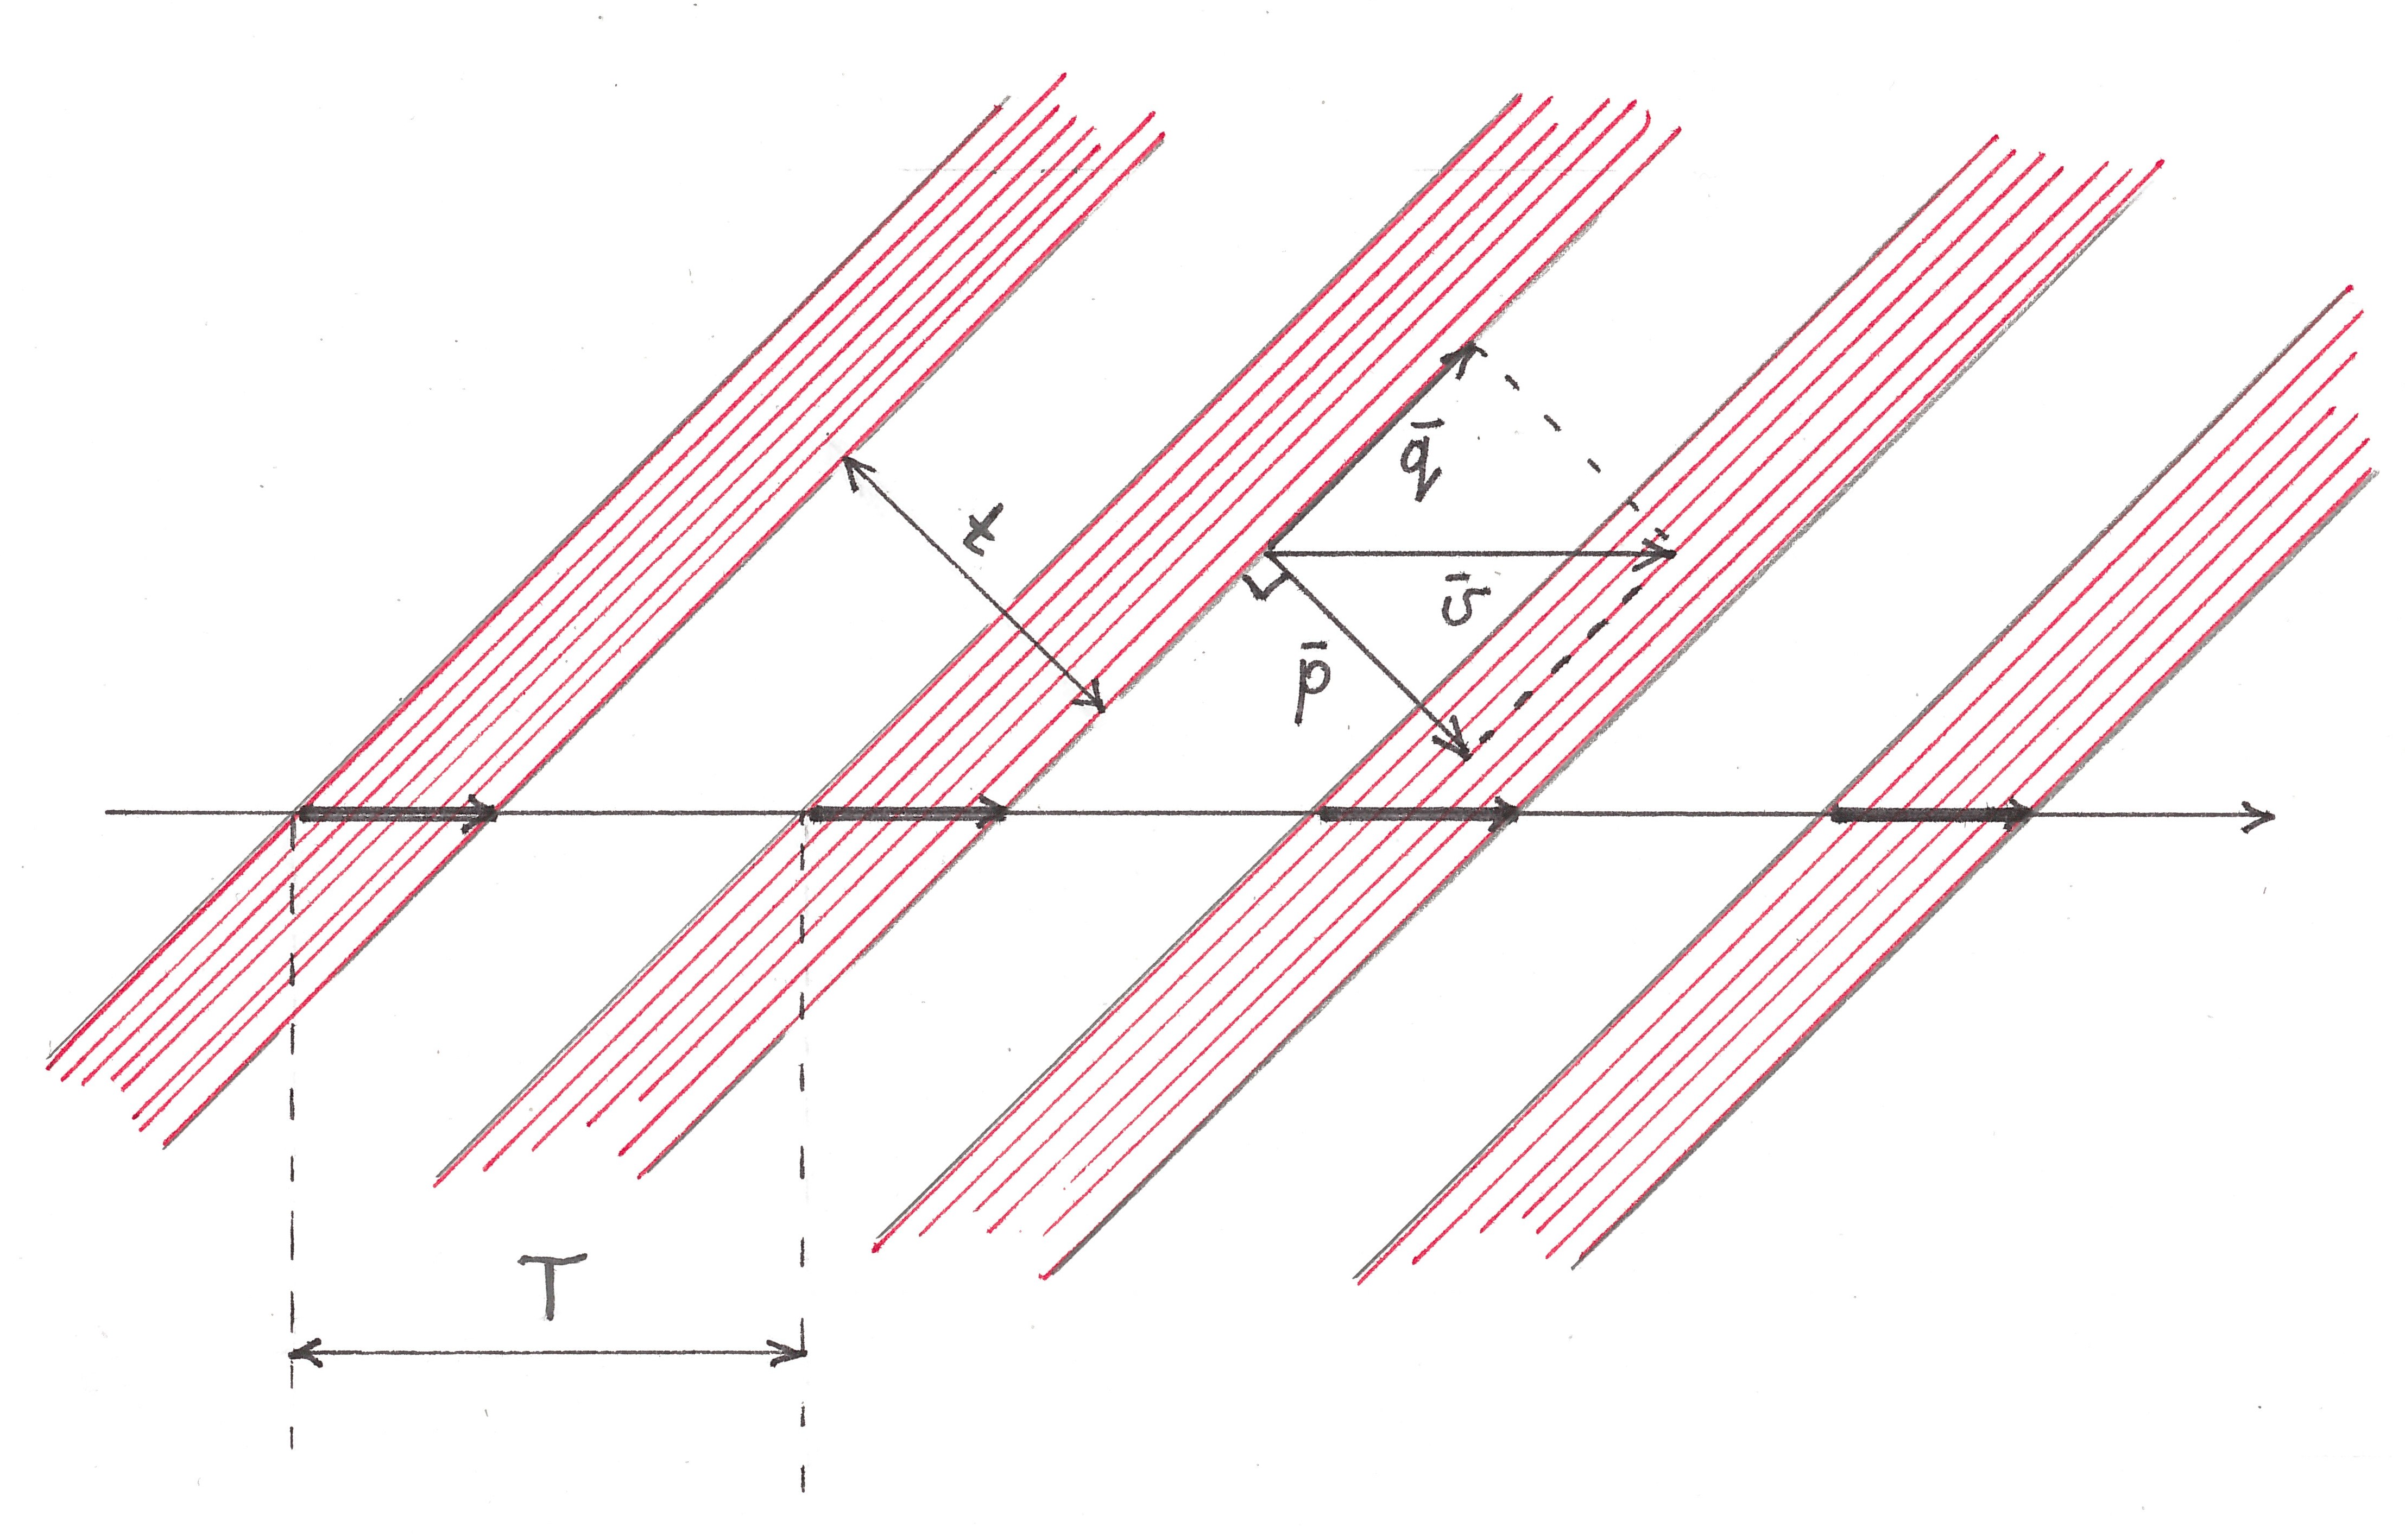
Fig. 8
Located along the flow T-periodically, its black zones generate a periodic line pattern of parallel stripes of the same width. More precisely, this pattern is T-periodic (completely coincides with itself when shifted by a distance T) in the horizontal direction, periodic with a period t = T / √2 in the direction of the
(common) normal to the borders of its bands and “withstands” any shift in parallel the bands themselves. It is interesting to observe how the entire pattern, together with the flow, moves to the right. The movement of each individual strip (vector ʋ ) can be represented as the vector sum of its displacement along itself (vector q ) and simultaneous movement in a direction perpendicular to its boundary (vector p) As you might imagine, it is difficult for our vision to notice the movement of an endless strip of shadow along itself, if any makes any sense other than formal, so there is an illusion that the pattern does not move to the right with the stream, but in a direction perpendicular to the borders of its stripes, moving relative to the picture diagonally to the right down. According to the laws of geometry, the velocity of the leading front of each band is exactly √2 times less than the velocity of the black zone with which it is associated.
By the way, the use of swept wings in supersonic aviation is most likely based on the same phenomenon: air movement parallel to the wing itself should not affect the lifting force in any way, and the normal component of the speed with which the supersonic stream hits its leading edge, due to the sweep angle, less sound speed, allowing the wing to work in a subsonic mode that is comfortable for it.
The description of the illusion allows us to conclude that the following three types of movement look indistinguishable for any red shadow band, and therefore can be considered as equivalent:
* movement along the horizontal along with the stream with speed ʋ ;
* movement along the diagonal of the figure down with the speed ʋ / √2;
* downward movement at a speed of ʋ .
After replacing the word “down” with the word “up”, everything said about the properties of the movement of red stripes and red line patterns becomes valid with respect to the movement of blue ones.
Global stripes and line patterns.
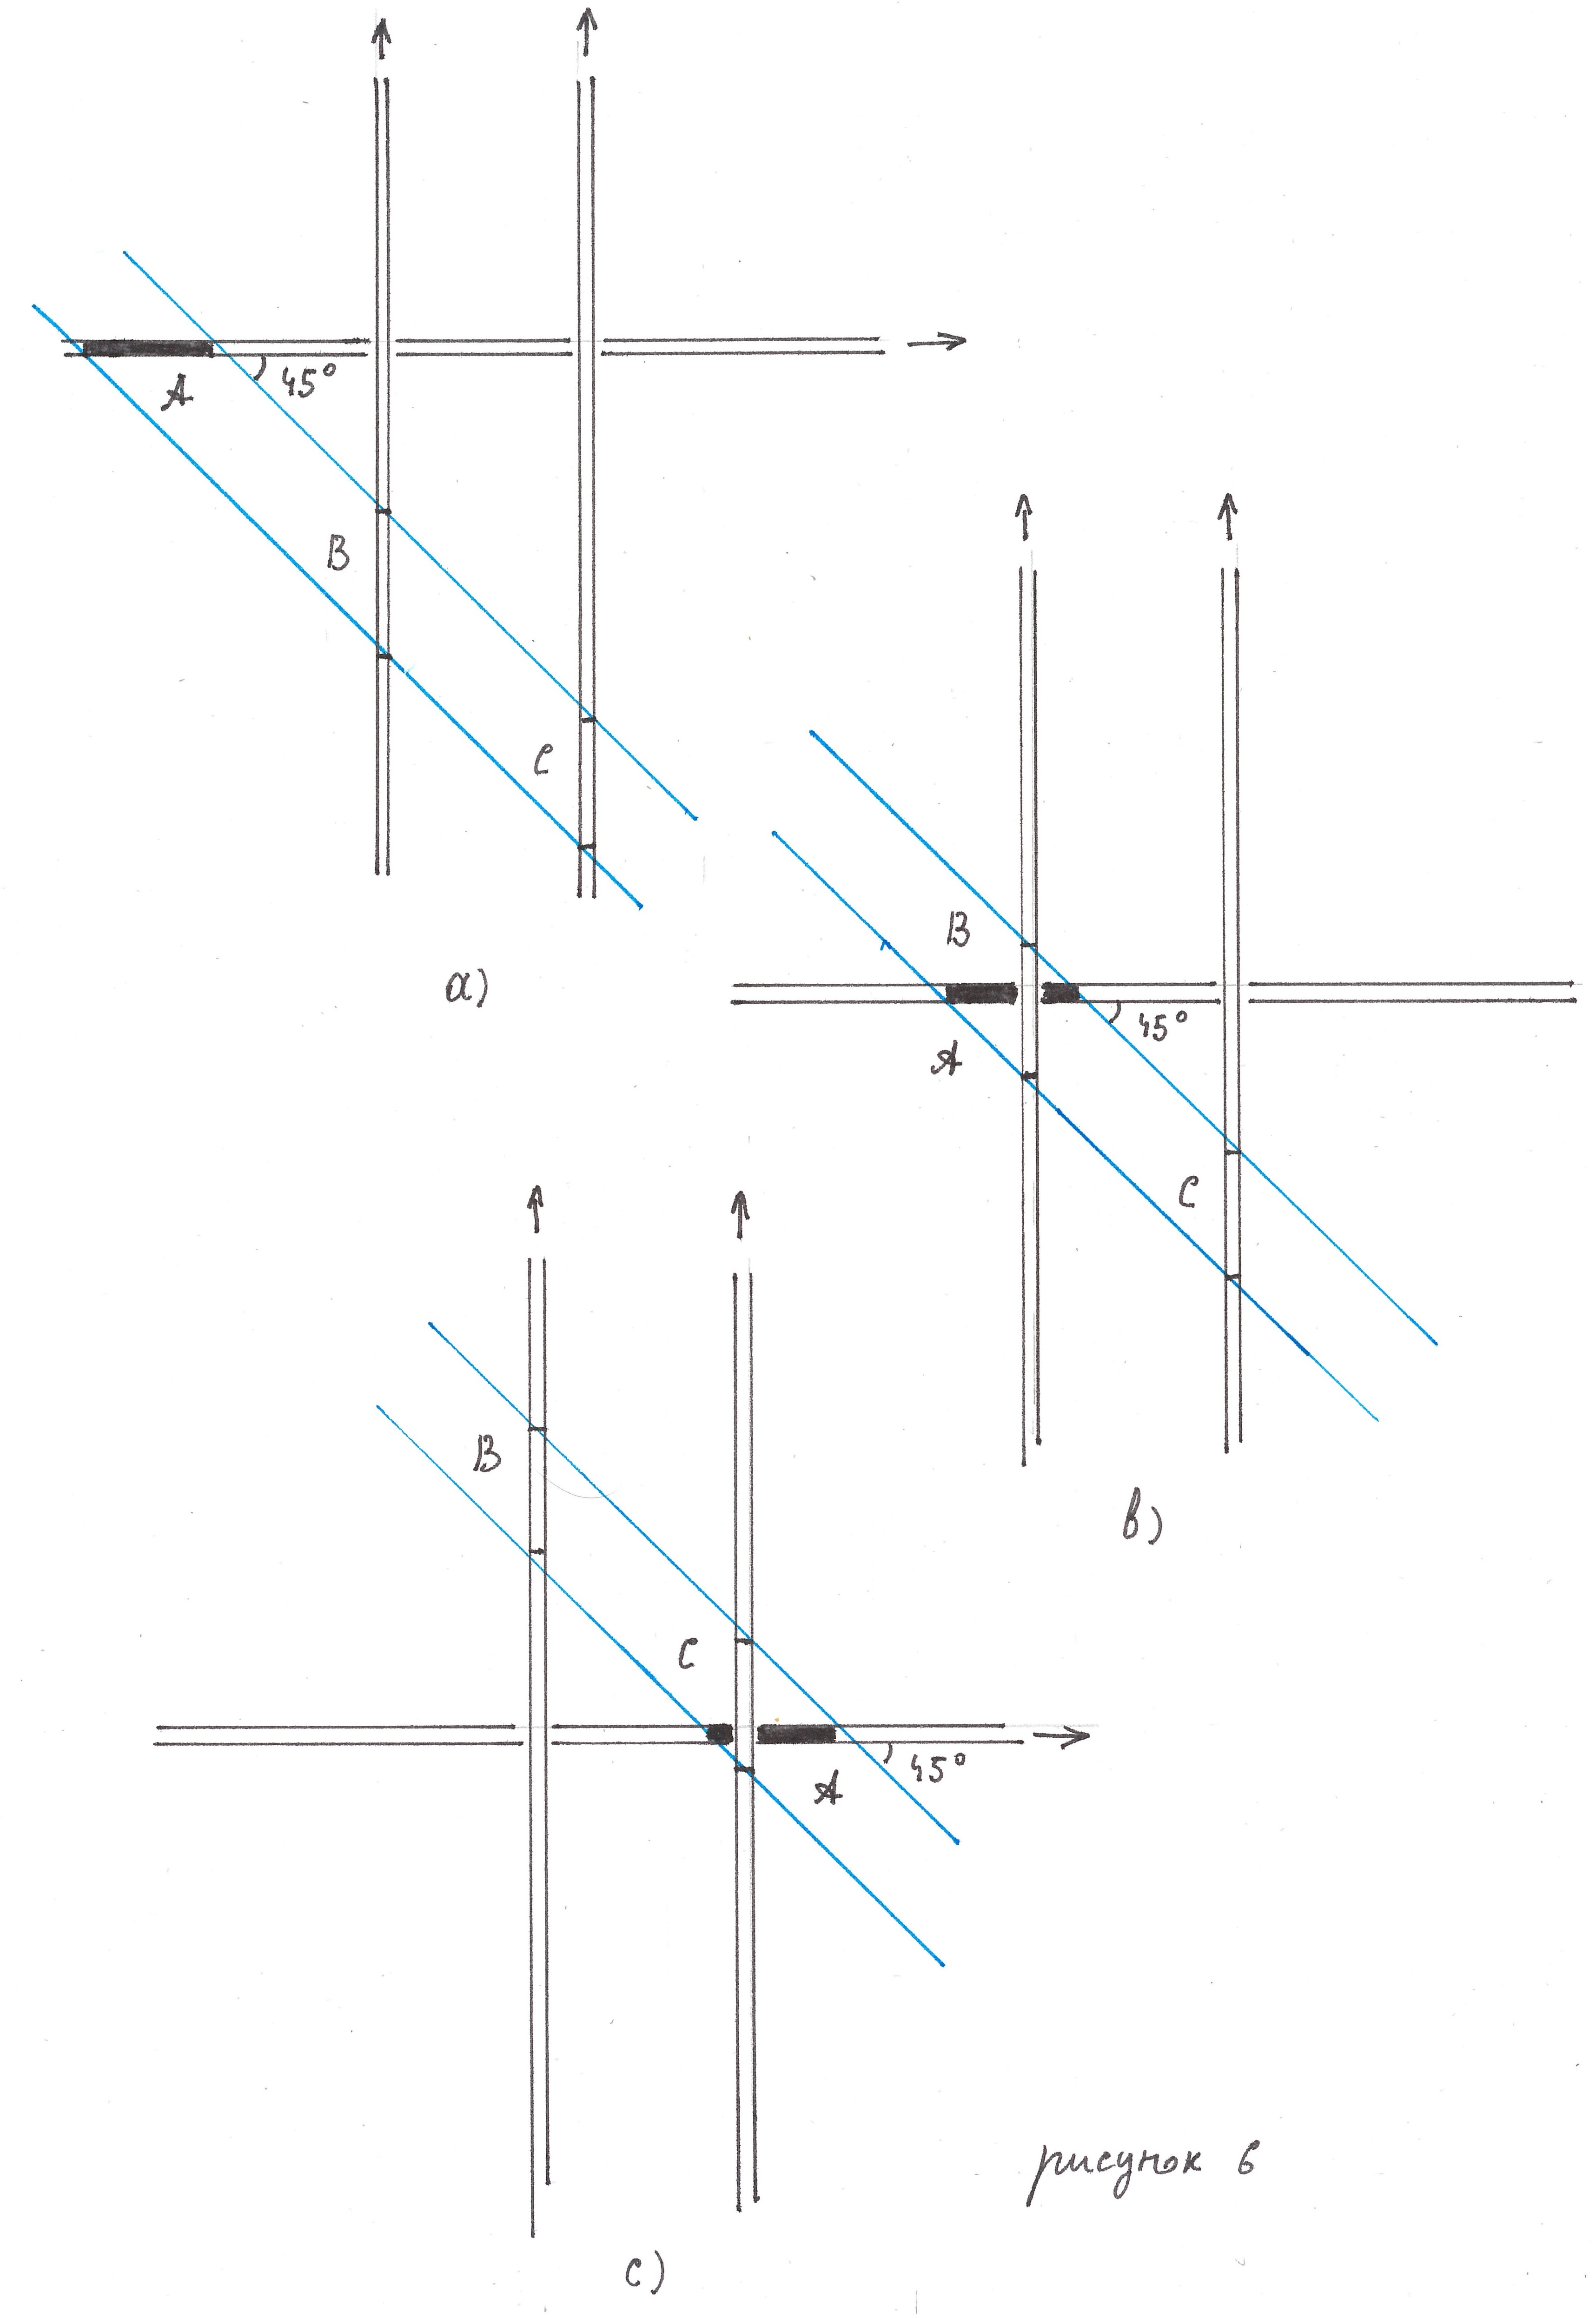
Let some arrangement of green waves be given on some road network. Shadow stripes of the same color, referring to flows moving in one direction, are necessarily parallel to each other, but can either stand apart, or partially or even be completely superimposed on each other (Figure 9). Since their movement is directed in the same direction and has the same speed, these bands remain absolutely motionless relative to each other. Let's combine strips of one color at once of all (horizontal) flows moving in one direction. As a result of overlapping, the intersecting shadow bands of different streams merge to form global shadow bands . The new stripes will also be parallel to each other, together forming a global line pattern .
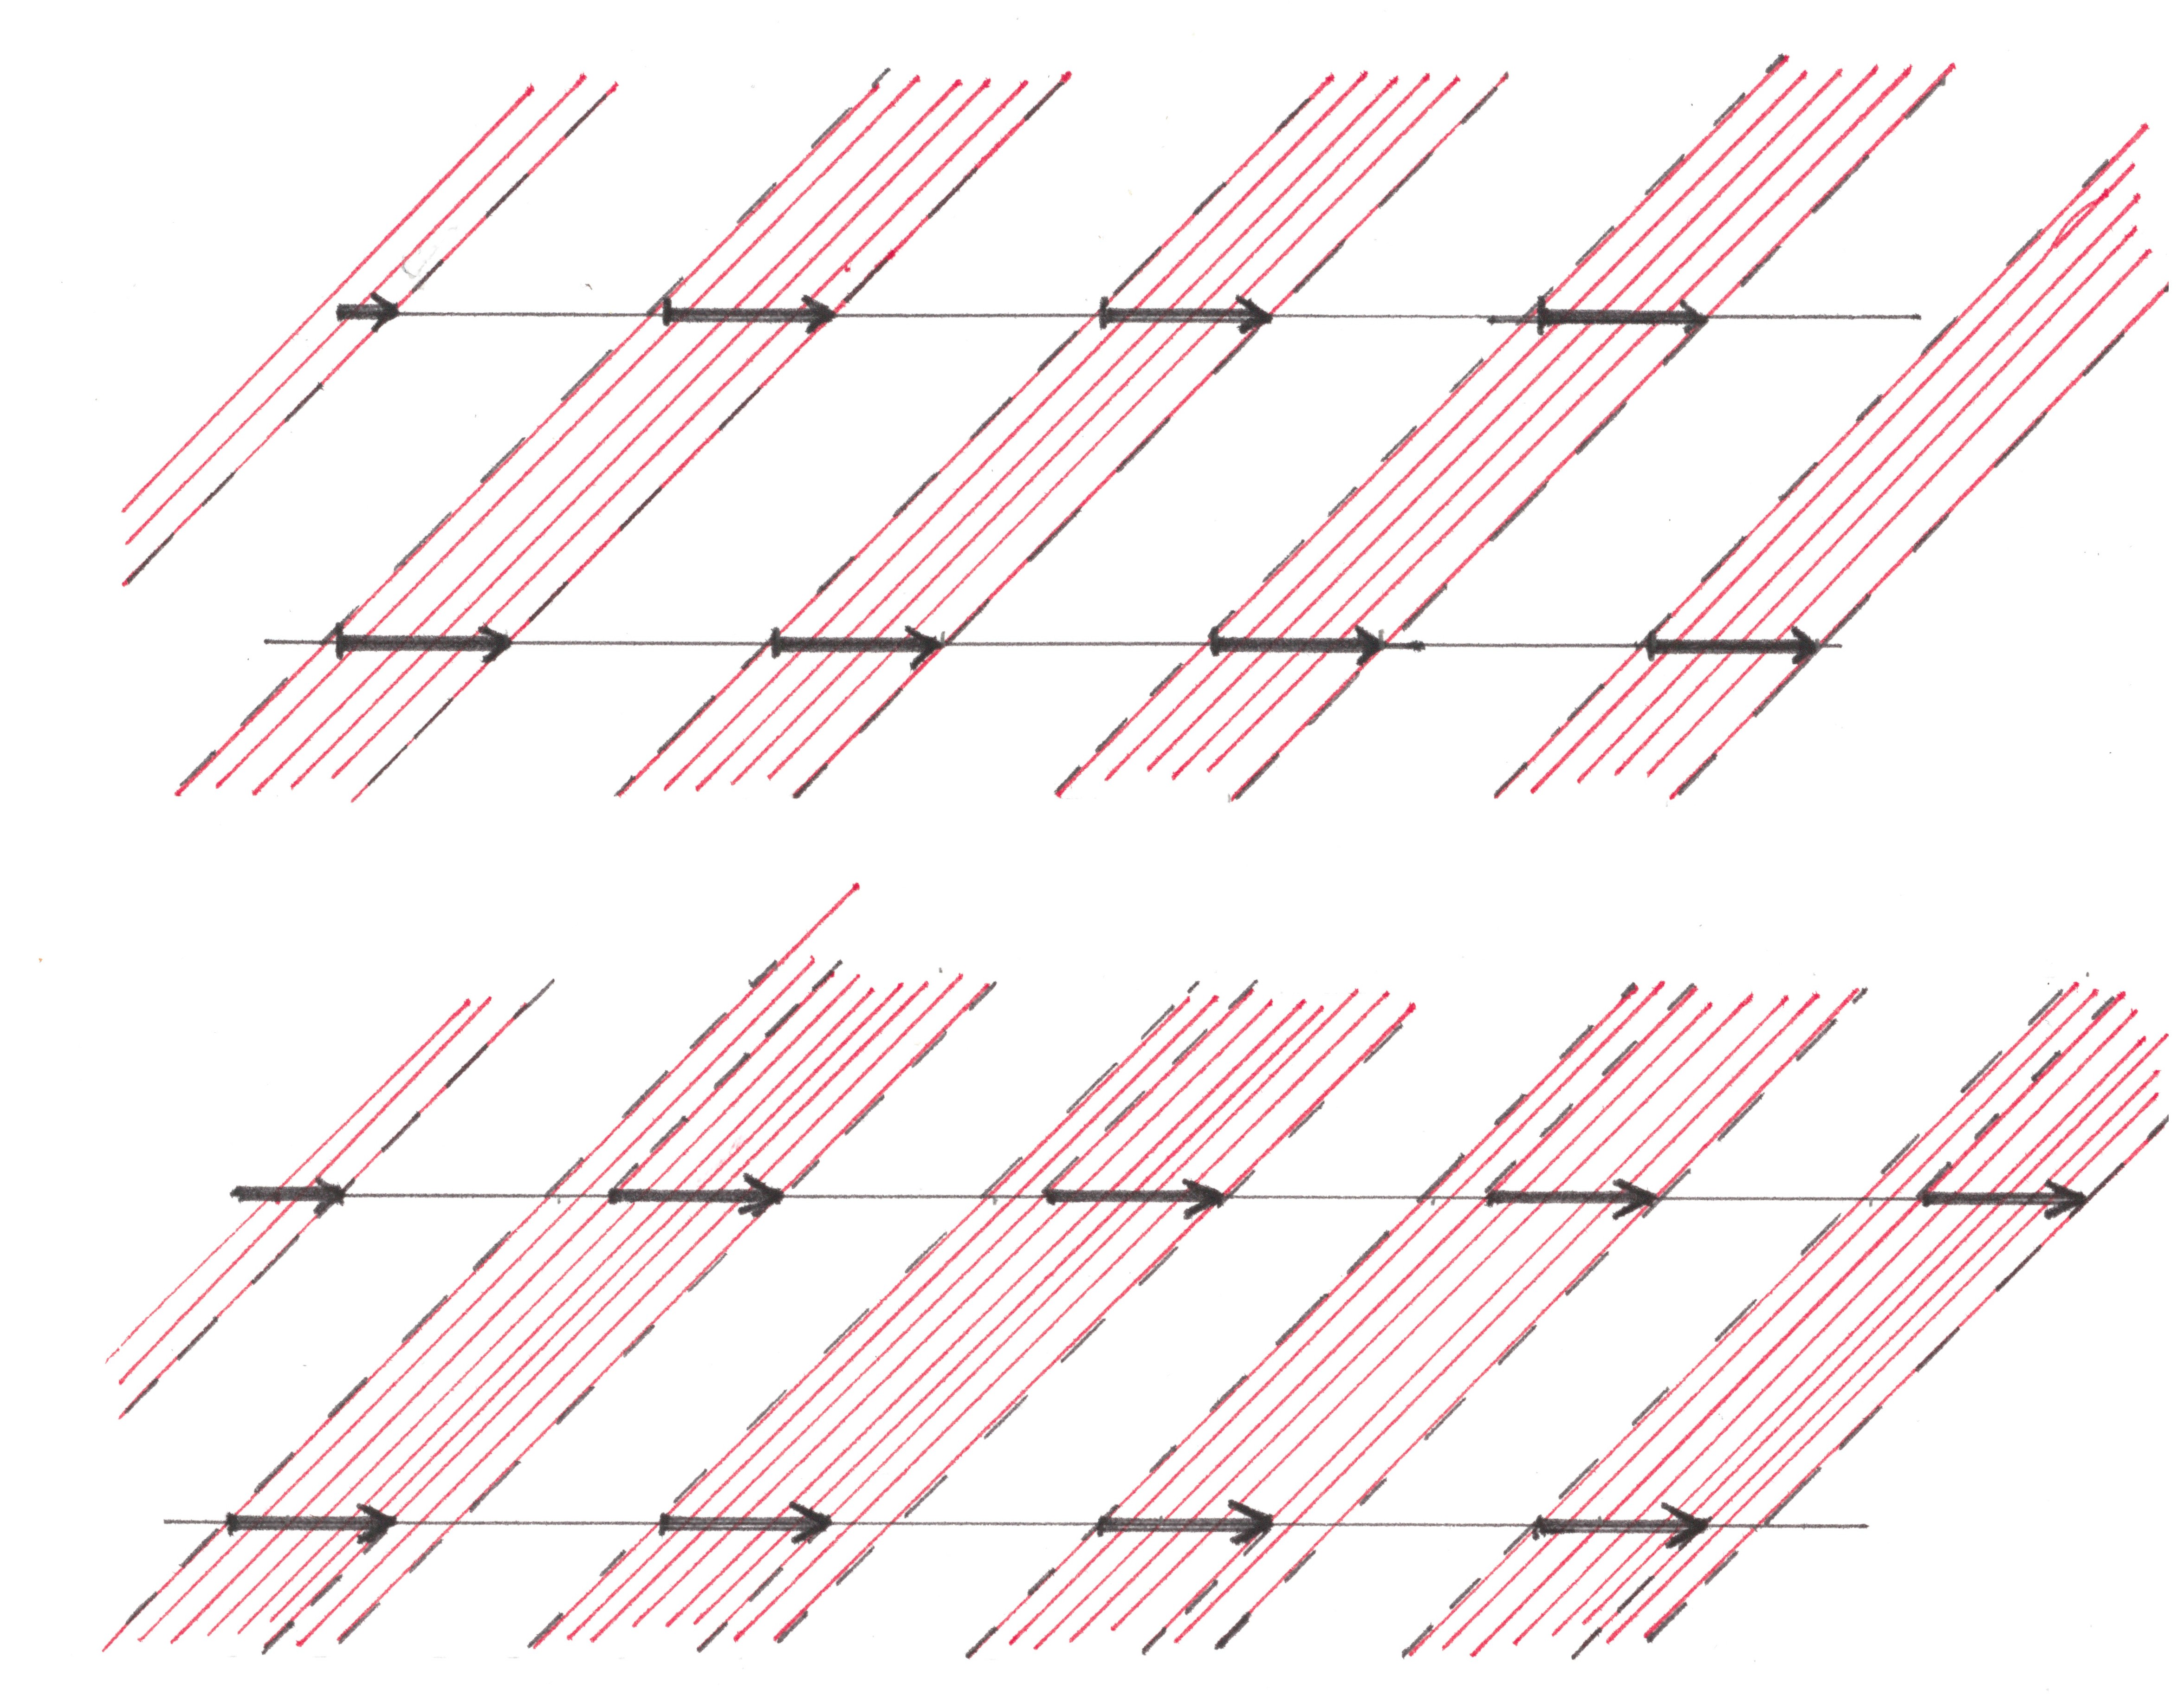
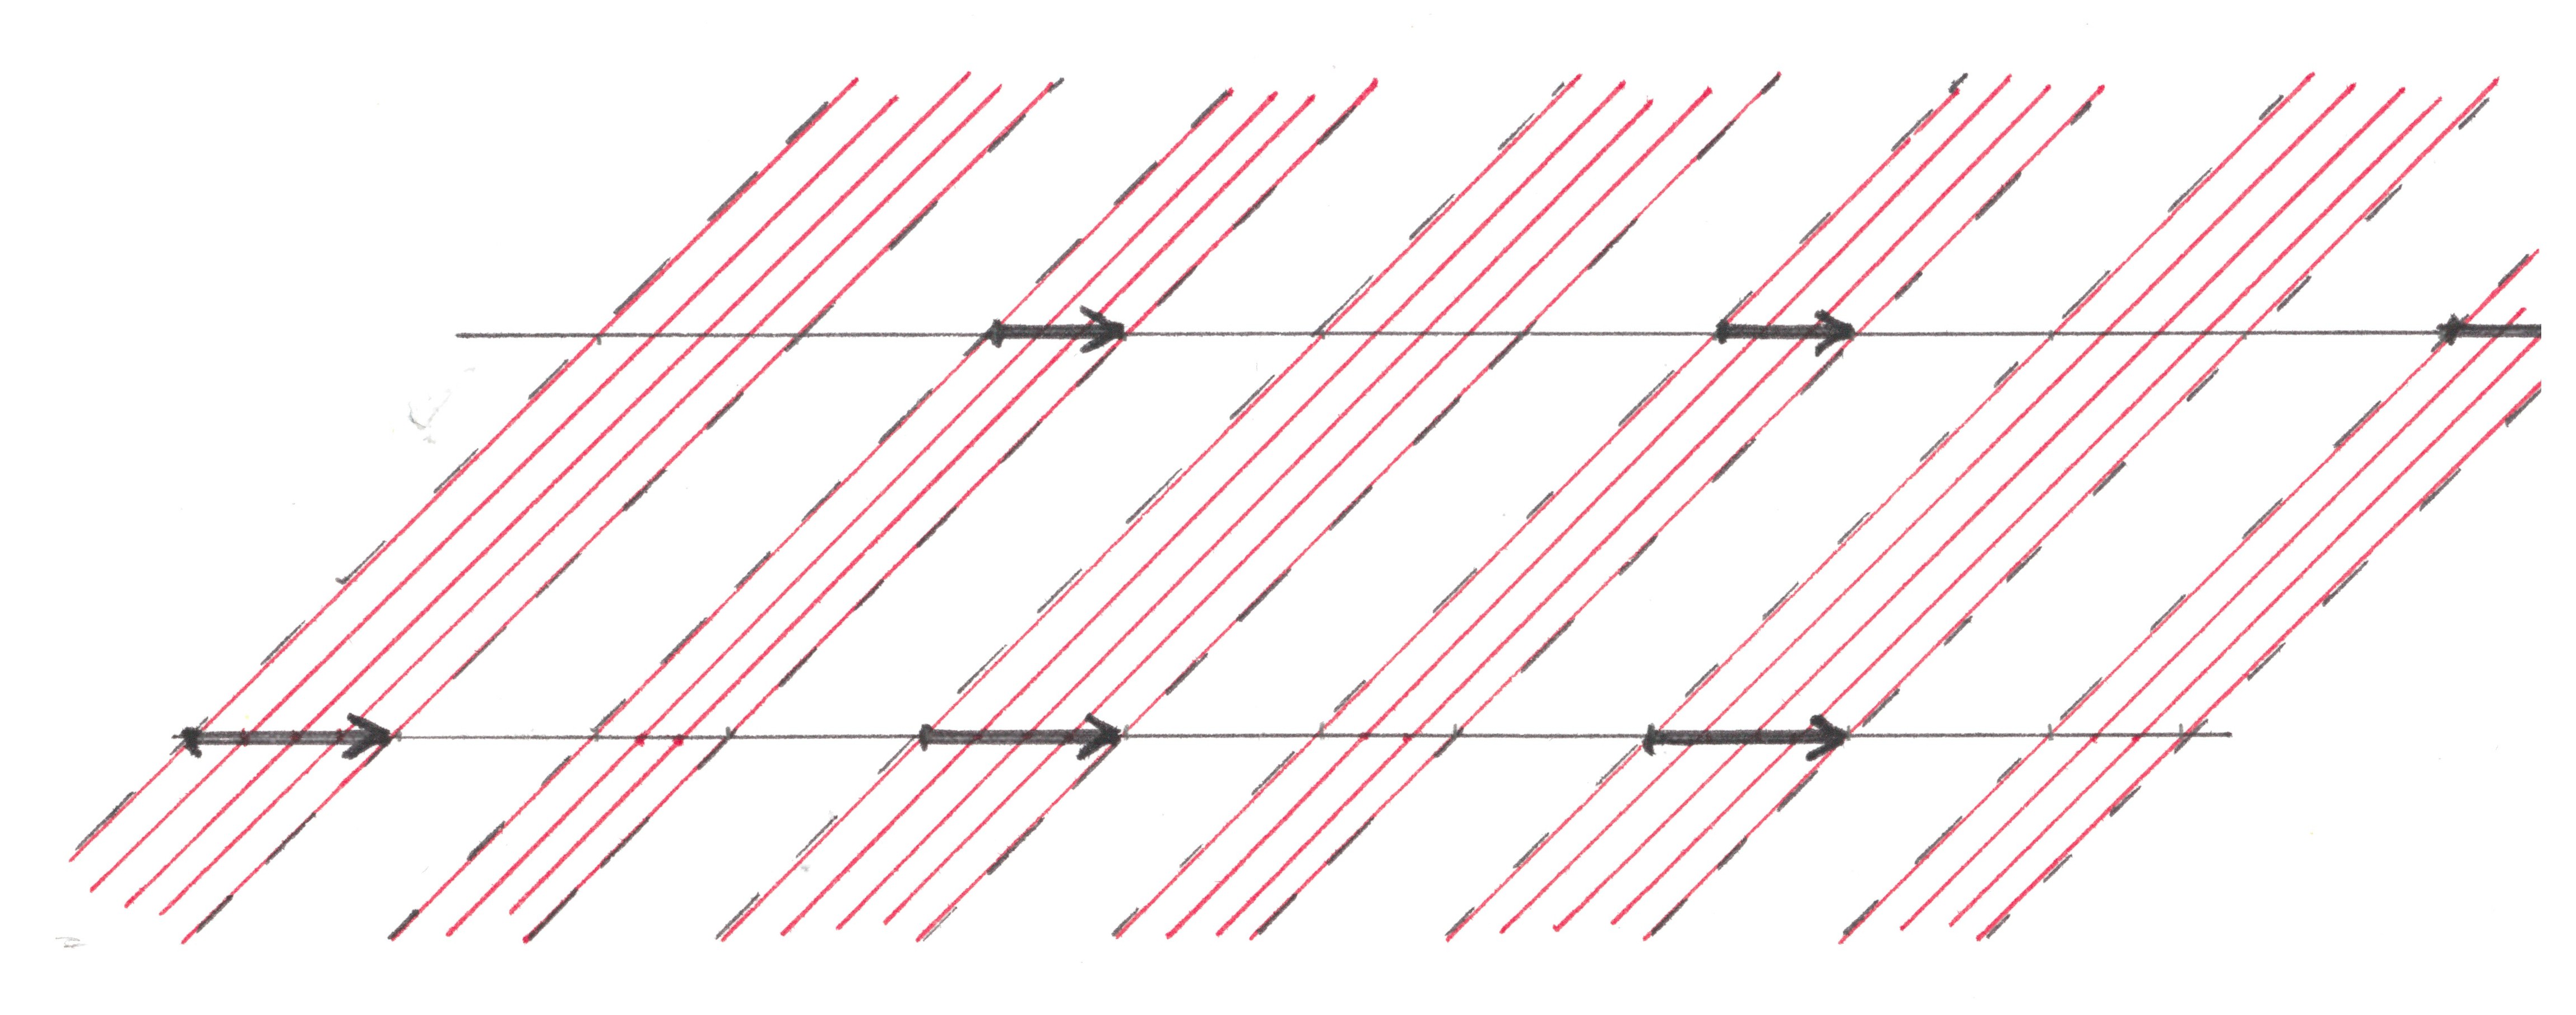
Fig. 9 The
global line pattern is t-periodic along one of the diagonal directions of the layout and can withstand any displacement along the other, since all line patterns of the individual flows from which it was formed possessed this property. For the same reasons, the global pattern is T-periodic in the horizontal and vertical directions, although T along these directions may no longer be its shortest period.
In total, four global line patterns are formed, differing in the color and slope of the stripes: composed of red right, red left, blue right and blue left. In Figure 10a, all global patterns generated by the flows of Figure 4a are combined, and in Figure 10b, their position after a quarter of the (
time) period.
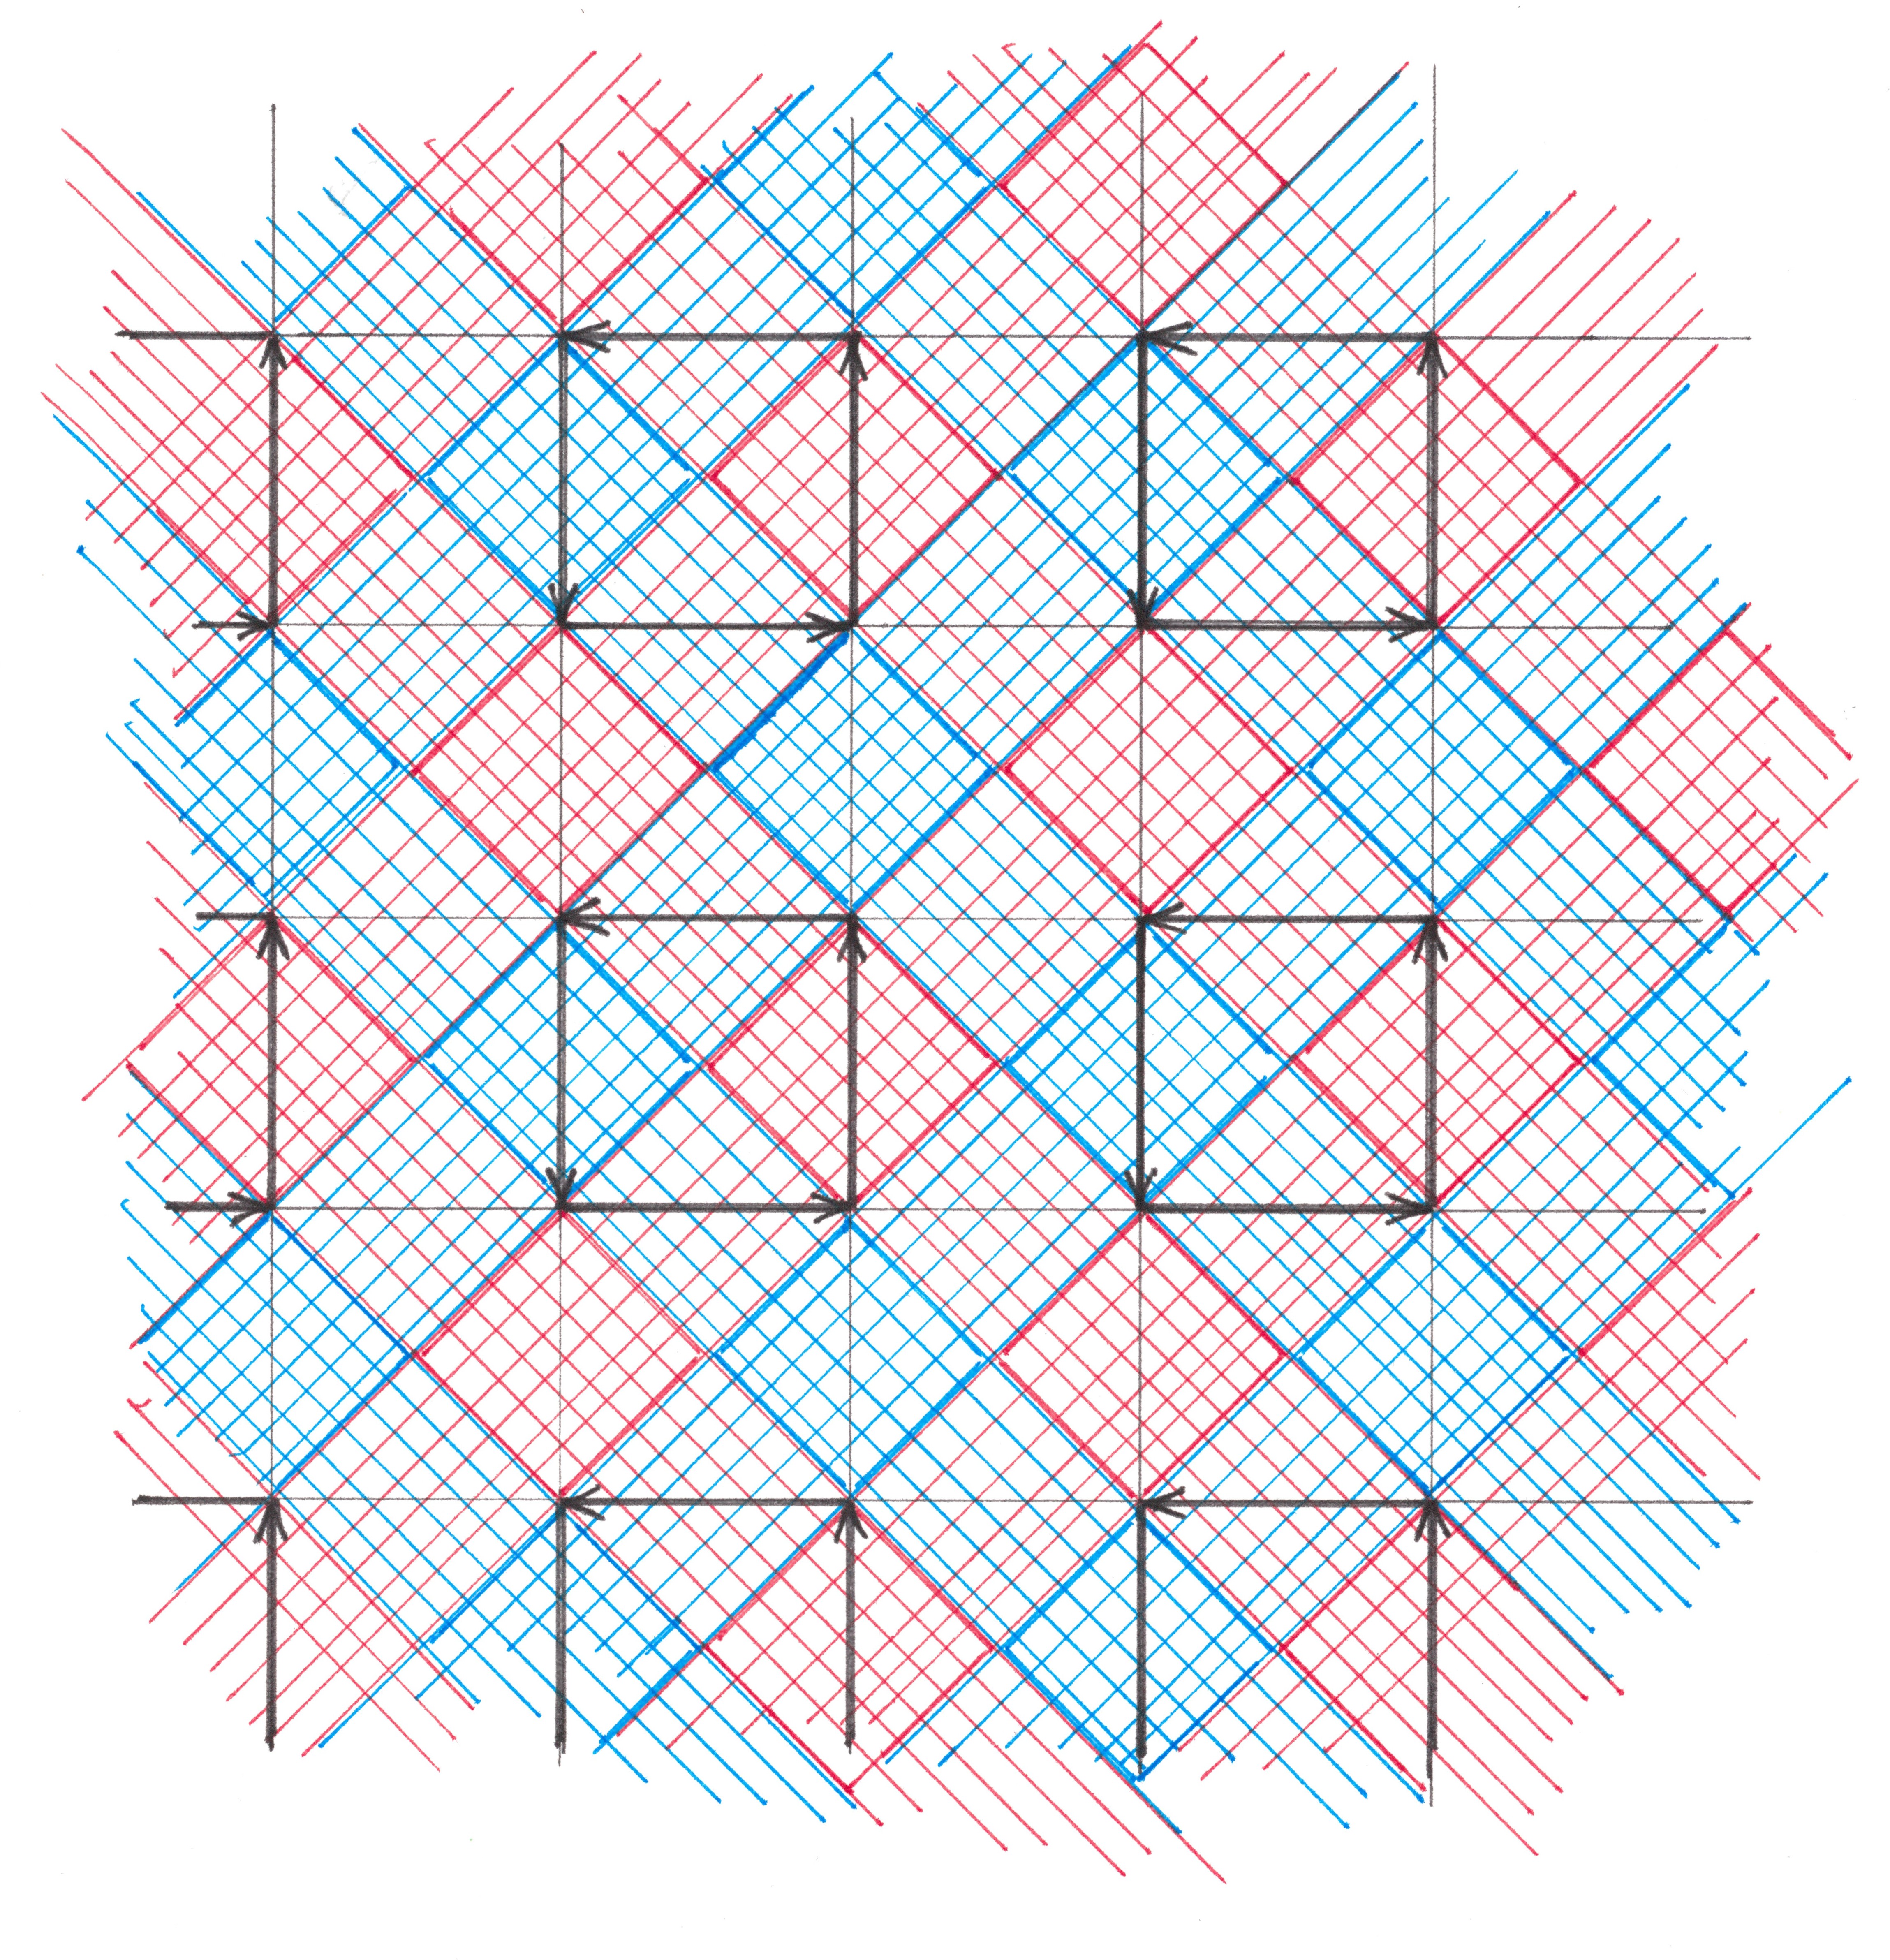
Fig. 10a

Figure 10b
A characteristic feature of both illustrations is the pattern between the arrangement of arrows and different color zones: the right arrows always appear at the intersection of the right red and left blue stripes, the left arrows - left red and right blue ones, the up arrows lie exclusively inside areas free of red shadows, and the down arrows are inside the blue-free zones. The explanation for this observation is contained in the rule for constructing shadow bands.
Checkered patterns
Any pair of line patterns, the shadow stripes of which are stretched along different diagonals of the pattern, is a checkered pattern, like a Scottish kilt pattern, a Provencal-style tablecloth or your office shirt. Checkered patterns have simple and at the same time useful properties for our research, let's look at them.
Fig. 11
If two diagonally located shadow bands move in the same direction with the same speed ʋ , then, obviously, the rectangle, which is the area of their intersection, moves in the same direction with speed ʋ (Figure 11a). Let now the movement of these bands occur along a horizontal line with equal velocities ʋ , but in opposite directions.
Two cases are possible here: both bands move either towards their slope (like all red global stripes), or against it (like all blue global stripes). In the first case, the movement of each of them is indistinguishable from the vertical movement down, where it moves at a speed ʋrectangular area of their intersection. The second case is completely similar to the first, but with the difference that the intersection area moves vertically downward.
Another important property of checkered patterns is the inherited periodicity both in diagonal directions and along the main axes. Let the checkered pattern be formed by the intersection of two diagonal line patterns, the first of which is p-periodic along the northeast direction, and the second q-periodic along the northwest. In such a situation, the checkered pattern itself will be p-periodic along the northeast, q-periodic along the northwest directions and can be represented as a rectangular mosaic of p × q cells (Figure 12). If p = q = T / √2, then this pattern is also T-periodic vertically and horizontally.

Fig. 12
Synchronized movement of checkered patterns and green waves
As already mentioned, four checkered patterns are associated with any periodic arrangement of green waves: red-blue - at the intersection of the right red and left blue global stripes, blue-red - at the intersection of the right blue and left red global stripes, and two symmetrical - red- red and blue blue .
If all traffic flows are moving at a speed of ʋ , then the results of the previous paragraph in the appendix to the associated checkered patterns mean that the red-blue pattern moves at a speed of ʋ horizontally to the right, blue-red - at a speed of ʋ horizontally to the left, red-red and blue - blue patterns with speed ʋmove strictly vertically, the first - down, and the second - up.
From the latter it can be concluded that the movement of the black zones of the road flows, indicated by arrows in the figures, and the cells corresponding to the zones of checkered patterns turn out to be synchronized. So, any right arrow moves all the time inside the red-blue rectangle, while remaining stationary relative to its borders, any left arrow is in a similar relationship with some blue-red rectangle, any up arrow is with the white-white rectangle of the blue-blue pattern, and any down arrow - with a white and white rectangle of a red - red pattern.
The synchronism of movement of arrows and cells opens up the fundamental possibility of using cellular patterns to build green waves.
Reverse engineering
Generation lemma.
Let a network of horizontal and vertical lines with a direction indicated on them, denoting traffic flows, be marked on the plane. Let also the position of the two initial diagonal checkered patterns: red-red and blue-blue, each of which is t-periodic along the directions of the length of its stripes.
There is a canonical (standard) way to build the placement of green waves on the mentioned network, in which:
*) the black zones of each stream are located T-periodically on it (T = t × √2);
**) at the zero moment of time, the red-red global pattern associated with the placement will be entirely contained inside the original red-red pattern, and the global blue-blue inside the original blue-blue pattern (the term “checkered pattern A contained inside the checkered pattern B” means the requirement that each strip included in the pattern A lie entirely inside some strip of the pattern B);
Immediately, we note the T-periodicity of the initial patterns along the horizontal and vertical directions (see the previous paragraph). Crossing the right (inclined to the right) stripes of one of the original patterns with the left stripes of the other, we thereby distinguish two derived checkered patterns: blue-red and red-blue. Derived patterns will also be t-periodic along both diagonal directions of the plane, and hence T-periodic along its vertical and horizontal lines. As a result, the intervals into which any vertical or horizontal line is divided by its intersection with the cells of any of the original or derived patterns fill this line with T-periodic regularity.
On each upward flow, among the intervals at which the flow intersects with the white-white cells of the blue-blue initial pattern, we take some interval with a maximum length. When the selected interval is shifted by a multiple of T up or down, it will again coincide with the intersection of its flow and the white-white cell of the blue-blue pattern. Let us consider all such areas and consider the black zones of upward flows (Figure 13).
Fig. 13
To construct black zones on downward flows, the procedure just described must be performed with respect to the intervals of their intersection with white-white cells of the red-red original pattern, for flows to the right, with respect to the intervals of their intersection with red-blue, and for streams to the left - with blue-red cells of derived patterns.
All flows are now divided into zones, it remains to show that during movement there will be no conflict between them.
At the zero point in time, there are no conflicts between the flows according to the rule of color prohibition: the black zones of horizontal flows, located inside the red-blue and blue-red cells, cannot be in intersection with the black zones of the flows directed upwards, since they lie in cells free from blue, just like they cannot be in intersection with the black zones of flows directed downward, because the latter are inside cells that are free of red.
Having come into motion, the zones of all flows, by condition, must have the same speed ʋ . Make the red-red original pattern move at a speed ʋdown, and blue-blue - at the same speed, but up. Moving the original patterns will cause the red-blue derived pattern to move along the horizontal at a speed of ʋ to the right, and blue-red - exactly the same, but to the left. It turns out that the black zones of the flows will move synchronously with the cells of the colored patterns within which they were originally built, which means that the proof based on the rule of the prohibition of colors can be repeated for any moment in time.
An important property of the procedure of canonical construction of placements is its “involution”: if applied to the road network and checkered patterns associated with a certain traffic pattern, the result is the same pattern.
The reader is invited to independently prove the second:
Lemma on the optimality of canonically constructed allocations
Among all the green wave arrangements satisfying the requirements *) and **) of the generation lemma, there is not one that would be more efficient than a canonically constructed arrangement on at least one thread.
One of the promising traffic patterns in areas with high-rise buildings
Previously, a method was described how to get a traffic pattern with a coefficient of efficiency of 25 from the bidirectional traffic pattern of Figure 5, with the size of quarters to half a period (500 meters) and a 50 percent level of efficiency of use of each road, crossing out every second arrow in each flow % and the size of quarters in a quarter of the period (250 meters).
Using one tricky view of the cellular patterns and the Generation Lemma, we will now build a green wave placement with the same value of efficiency in 25% of road use, but on a network with the size of quarters in only 1/8 of the period (125 meters). Such a high density of roads may be preferable in parts of the city, which are mainly built up with skyscraper buildings, which, as you know, in terms of the number of people and the number of cars they are quite comparable with entire blocks in traditional areas.
Figure 14a depicts “elementary” fragments of the mentioned patterns, and in Figure 14b they are both superimposed simultaneously on top of the road network, allowing us to seamlessly split its flows into black and white zones.
Fig. 14a
Fig. 14b
The proposed road network, if desired, can be replenished with any number of horizontal and vertical flows (roads), and the Generation Lemma guarantees the possibility to place green waves on new roads so that they will not conflict with each other or with green waves on streams present on the network initially.
Try to determine which positions of the new roads will allow you to use them with an efficiency of 25% for the selected direction of movement, and for which - this value will be significantly less. Find locations in which road utilization is zero.
Extremely efficient traffic patterns
The widespread use of the traffic scheme described in the previous paragraph will undoubtedly be hindered by its relatively low efficiency of road use: two times lower than the theoretically achievable level of 50%. It is natural then to ask the question: "What can be traffic patterns that support the regime of green waves and use every road with 50 percent efficiency." We will call any such motion scheme extremely effective .
Now we will describe a general method that allows you to build all the most effective traffic patterns, and at the end of the section, those that are most promising for practical use are separately drawn.
Let some extremely effective scheme of movement be given.
From the requirement of T-periodicity it follows that each of its flows is composed of alternating white and black zones of the same magnitude equal to T / 2. In the considered motion scheme, as well as in any other, at least one horizontal stream moving to the right is necessarily present. The line pattern of red shadow bands associated with this stream should look like Figure 16a.
Fig. 16a
Also, at least one horizontal flow moving to the left is necessarily present in the diagram. Its red shadow stripes are depicted in Figure 16b.
Fig. 16b It is
obviously impossible to be sure that the line pattern of red shadow stripes from a single randomly taken stream moving to the right will coincide with the pattern of all red right global shadow bands, just as one cannot be sure that the linear pattern of red shadow stripes from a single randomly taken stream moving to the left , matches the pattern of all the red left global shadow bars. But let's look at the checkered pattern (Figure 16c) that the red shadow stripes of these two randomly selected streams form together (Figure 16c).

Fig. 16c
This pattern is made up of equal-sized squares with a diagonal value of T / 2, so 50% efficiency can be achieved by any flow directed downwards, provided that the road reserved for it passes exactly through the vertical diagonals of white-white cells pattern. The examined checkered pattern, being generated by black zones of only a part of all flows of the movement pattern, is bound to be contained within the global red-red pattern associated with this pattern. But, as we can see, once again glancing at Figure 16, add at least one red strip to the checkered pattern depicted on it, or expand the existing ones just a bit - and not a single downward flow can already be 50% efficient.
The last observation allows us to draw several conclusions about the properties of any extremely effective motion schemes:
- The line pattern (both red and blue) of any horizontal flow coincides with the global one.
- The color cells of all four checkered patterns associated with the pattern of movement are equal squares with a long T / 2 diagonal.
- The distance between the streams nearest to each other moving in the same direction is a multiple of T / 2.
- The motion scheme shown in Figure 5 has the smallest block size among all bidirectional schemes of maximum efficiency with respect to the period of green waves.
Some chains of our conclusions can be drawn, thereby obtaining:
Lemma on the generation of extremely effective patterns of movement
Let us take two checkered patterns arbitrarily located relative to each other with a diagonal arrangement of stripes, the first of which is red-red and the second is blue-blue. Let the color cells of both patterns be equal squares with a diagonal length equal to T / 2. We apply any network of horizontal and vertical flows to the plane, if only their positions satisfy the following requirements:
- Each stream directed downward must pass through the vertical diagonals of the white-white cells of the red-red pattern;
- Each flow directed upward must pass through the vertical diagonals of the white-white cells of the blue-blue pattern;
- Each flow directed to the right must pass through the horizontal diagonals of the red-blue cells of the red-blue derived pattern;
- Each flow directed to the left should pass through the horizontal diagonals of the blue-red cells of the blue-red derived pattern.
If we canonically construct the placement of green waves from these patterns for a road network laid on a plane, then as a result an extremely effective traffic pattern will be obtained. (Prove yourself). The fact that in the described way it is possible to obtain every extremely effective scheme of motion immediately follows from the involution property of the canonical construction procedure.
So, we already have one extremely efficient traffic scheme with two-way streets, but the size of the quarters that it assumes is as much as 500 meters. Extremely efficient traffic patterns are most attractive from the point of view of road construction costs and saving city space, however, there is a limitation on the distance between the flows in one direction: it cannot be less than the half-wave of the green wave, or all the same 500 meters .
Is it possible to make blocks smaller?
The only logical loophole that remains for us is to abandon two-way traffic and try to alternate flows in opposite directions: if successful, the length of the blocks will be only a quarter of the green wave period, or quite acceptable 250 meters.
Luckily, such a traffic pattern really exists and, apparently, it is it that is the most promising for practical application. One of the instantaneous positions of its flows is shown in Figure 17.
Fig. 17
How should the face of modern cities change
Let's estimate how many more roads will need to be built so that each employee can get to their place of work in a personal car. For starters, take a relatively small city with 150 thousand people with a standard density of 10 thousand people per square kilometer. The entire territory of such a town can easily fit inside a 16 × 16 block matrix (4 × 4 km square), and a trip between its two most distant points on free roads will not take more than ten minutes.
We make the simplifying assumption that in all quarters the same number of jobs is concentrated, as are the citizens living there permanently, while there is no statistical relationship between the address of the house and work. In this case, almost all residents will leave their quarters during the morning migration, and approximately the same number of people will follow from each quarter to each. We will assume that for the organization of traffic the transport scheme of Figure 17 is used with a restriction allowing exit from the quarters only on horizontal roads, and arrival only on vertical roads.
Let's try to find what the maximum flow of cars on a given street in the morning rush hour will be.

Fig. 18
Figure 18 shows a fragment of a map with a similar traffic pattern, but smaller. On this map are marked all the routes that, starting inside the selected quarter, then diverge along different vertical streets. Each quarter has the same number of such routes (according to the number of vertical streets), and each route has the same number of cars that will follow it.
If you draw a line across a horizontal road with traffic to the right, on the right side
of which there will be X quarters, and a field Y of vertical streets, then this line will cross X × Yroutes. The maximum value of their number will be observed exactly in the middle of the road and in the case when the street extends for 16 blocks in length, it will be equal to 108 (16 blocks on the left × 8 vertical roads on the right). In each quarter, 1/4 × 1/4 × 10,000 = 625 people live, according to statistics, about 320 of them work, therefore, for each of the 16 routes leading from the quarter, there are 20 people, thus, the middle of each horizontal street is crossed by 108 × 20 = 2200 cars.
Imagine that in our hypothetical city there is a conservative way of life, when the working day for most residents starts at 9 in the morning. All employees will go to work at about the same time, but under the influence of age, character traits and random circumstances, the period of the beginning of morning migration is likely to stretch by about a quarter of an hour.
So, 2200 cars should pass you along the street in a quarter of an hour, how many lanes do you need to build for this?
In one lane at a speed of 1 kilometer per minute, distances of 30 meters and the efficiency of using the road in green waves mode, only 250 cars manage to drive 50% in a quarter of an hour, and for 2200 cars it will take as many as 10 lanes, in other words, “ Leninsky Prospekt ”on every street of a medium provincial town.
Once, the calculations done show that it is worth getting rid of conservative views, we will make the work day begin for different people at different times. In conditions of a new rhythm of life, the number of bands can be reduced to a completely acceptable value. For example, the arrival of employees, distributed between four points: 9:00, 9:15, 9:30 and 9:59, will cost only three-lane roads on each street.
Unfortunately, for megacities, how not to smear the beginning of the day with a cup of coffee, the number of stripes still remains monstrous. For a 15 million city built with all its mind, the length of the streets, and with it the number of lanes on the roads, will increase by about 10 times (without the use of overpasses, the square root of the number of times the population has increased).
30 lanes every 250 meters - is this really the city of your dreams?
Summing up, I would like to share my vision of the situation:
- A car is a useful invention, which in the current state of technology should be available to every citizen in a civilized society.
- With a reasonable approach, it is not at all difficult to organize free movement, storage and pedestrian access to personal cars, without disturbing the comfort of cities of a reasonable size. For cities with a population of less than 1 million, this can be achieved without the construction of flyovers.
- The problem of automobile traffic within megacities cannot be solved only within the framework of roads with traffic lights and remains open so far.
The time has come to address the issue of the relationship between the density of roads and the possibility of their effective use.
Measures of density and effectiveness
First of all, we’ll get rid of the need to use the phrase: “in relation to the size of the spatial period of green waves” and agree that from now on the period of all these waves is equal to one.
A quantitative measure of the density of the location of roads within the network is the length of the longest quarter in the city. We agree to call this value the major minority of the network . Majority fineness is correctly defined for all city models (even with an infinite number of quarters) of finite length.
For a specifically selected placement of green waves, the value of the efficiency of the use of roads by its flows may be different for different flows. It is reasonable to call the lower bound of the set of these values as minorate efficiencyselected placement. For green wave locations on networks with a finite number of roads, the value of minorate efficiency coincides with the value of the efficiency of the most inefficiently used road.
I will give a few statements related to this concept, which the reader, I hope, can easily prove independently.
- In any arrangement of green waves, it is thus possible to cut off the black zones of all flows, so that after all they become the same length, and the minorate placement efficiency does not change.
- For some placement, take the cellular patterns associated with it and apply the canonical generation Lemma to them. The multiple efficiency of the resulting placement will be no less than that of the original.
- Пусть миноратная эффективность некоторого размещения равна D. Удалим из ассоциированных с ним красно-красного и сине-синего клетчатых узоров сначала все цветные полосы, ширина которых меньше D/√2, заменив их на белый фон. Затем удалим все белые полосы, с шириной меньше D/√2, закрасив их в каждом случае основным цветом узора, после чего используем два, уже видоизмененных, узора в качестве изначальных для канонического процесса Леммы о порождении — значение миноратной эффективности полученного в итоге размещения окажется большим или равным D.
Давайте возьмем все возможные размещения зеленых волн (с единичным периодом) на какой-нибудь конкретно выбранной сети. Верхнюю грань множества миноратных эффективностей этих размещений назовем миноратной эффективностью самой сети.
Иными словами, если E — миноратная эффективность дорожной сети, то существуют размещения зеленых волн на этой сети со значениями миноратной эффективности сколь угодно близкими к E.
Фактом куда более нетривиальным является то, что, по крайней мере, для одного размещения близость превращается в точное равенство. План доказательства этого утверждения приведен в конце статьи.
Универсальный объект в мире дорожных сетей
Imagine that movement in both directions is allowed along each horizontal and along each vertical line. It is unlikely that at least one city in the world will be able to boast of such a road network, but as a mathematical object, it is quite real and, moreover, has the useful property of Universality: it contains any other Manhattan type road network as its subnet. Each placement of green waves on the Universal Network that has a minorate efficiency D (induces) generates on each subnet its placement of green waves with a minorate efficiency greater than or equal to D. As a result, the minorate efficiency of any Manhattan type road network is greater than or equal to the value of minorate efficiency for Universal network.
The main intrigue now lies in the question: is the minirate efficiency of the Universal Network equal to zero, and if not, then what is its true value.
Top estimate The
minimum efficiency of any placement of green waves on the Universal Road Network does not exceed 1/4.
The proof is enough to hold only for such locations, each of which uses all roads with equal efficiency (statement 1 of the previous paragraph). We arbitrarily choose one of these arrangements and designate its effectiveness as δ (period T = 1). Each stream of this arrangement is composed of alternating black zones of length δ and white zones of length 1 - δ. We construct red shadow stripes for any two oncoming streams of the selected location. Intersecting, these stripes form a checkered pattern, a fragment of which you can see in Figure 18.
Fig. 19 The
unit cell of this pattern will have the shape of a square with a diagonal of unit length, and its red stripes will intersect any horizontal or vertical straight line along a segment of size δ.
Black zones of downward flows can only be located inside white-white cells, therefore, each vertical line should have an intersection area with white-white cells of a length greater than or equal to δ. The least advantageous position, from this point of view, is for the lines passing exactly in the middle between the vertical diagonals of the white squares (Figure 20).
Fig. 20
Denoting by x the lengths of the segments along which each of these lines intersects with white-white cells and using the similarity of triangles, we obtain the equation:
x + δ = 1/2. Whence, given the inequality x ≥ δ, we find δ ≤ 1/4.
Lower
bound The multiplicity of effectiveness of the Universal Road Network is greater than or equal to 1/6.
Consequence:
On any road network of the Manhattan type, no matter how dense and non-periodic it is, there will always be a placement of green waves with a minor efficiency greater than or equal to 1/6.
On the Universal Network, I was able to track down the placement of green waves with a 1/6 efficiency. The generating checkered pattern of this arrangement is shown in Figure 21:
Fig. 21
As can be seen from Figure 21, any vertical line on its way will necessarily intersect one of the red-red rectangles along the largest of the possible segments, the length of which is just 1/6. Together with the periodicity of the pattern, this serves as a proof that the efficiency of all flows directed downwards is equal to the 1/6th. For flows of other directions, the efficiency is also equal to 1/6, which can be done using the symmetry of the checkered pattern.
Fig. 22
A good research challenge:
What is the true meaning of the minorate efficiency of the Universal Network?
This question can be answered using linear programming - the program will come out pretty tricky, but with a modest number of restrictions. It would be interesting to find the value of efficiency somehow elegantly. Perhaps one of you will be able to do this task.
Thank you for your attention and good luck!
Sergey Kovalenko.
2019 year.
magnolia@bk.ru