I try .NET Core + Kubernetes + appmetrics + prometheus + grafana + jobs + health checks
- Tutorial
Brief introduction to kubernetes for developers on the example of deploying a simple template site, setting it up for monitoring, performing jobs on a schedule and health checks (all sources attached)
- Installing Kubernetes
- Installing UI
- Running your application in a cluster
- Adding custom metrics to the application
- Collecting metrics through Prometheus
- Displaying metrics in Grafana
- Running tasks on a schedule
- Fault tolerance
- Conclusions
- Notes
- References
not suitable for linux users, you will have to use minikube
Create a deployment file
Short description
Further:
And you should see your interface http: // localhost: 8001 / api / v1 / namespaces / kube-system / services / https: kubernetes-dashboard: / proxy / #! / Deployment? Namespace = default
Inside of which there is a Replica Set, showing that the application is running in duplicate (Pods) and there is one related service with an address from the outside to open the completed application in the browser
Added a package to the application https://www.app-metrics.io/
I will not describe in detail how I will not add them, while briefly - register the middleware for the increment of call counters of api methods
And the collected metrics are available at http: // localhost: 9376 / metrics

* IMetricRoot or its abstraction can be easily registered in services and used in the application ( services.AddMetrics (Program.Metrics); )
The most basic setting of prometheus: add a new job to its config (prometheus.yml) and feed it a new target:
But Prometheus has native support for collecting metrics from cubernetis https://prometheus.io/docs/prometheus/latest/configuration/configuration/#kubernetes_sd_config
I want to monitor each service individually filtering by tag apptype: business
After reviewing the dock, it turns out that:
In Cubernetis there is a special place for storing configs files - ConfigMap.
There you save this config:
Departure for Cubernetis
Now you need to shut the prometheus with this config file.
Notice - file prometheus.yml nowhere indicates
all files that were specified in the config files are Mape under prometheus-config-volume, which is mounted in the directory / etc / config /
Also listed container startup arguments through to the config
- -web.enable-lifecycle - says that you can pull POST / - / reload, which will apply the new config files (useful if configuration changes "on the fly" and does not want to restart the container)
Actually deploy
Follow a little after the rise of the basement and go to the address http: // localhost: 9090 / targets , there you should see the endpoints of your service.
And on the main page you can write requests to prometheus
The query language is https://prometheus.io/docs/prometheus/latest/querying/basics/
We were lucky - before version 5, we could only slip the configs of the dashboards via HTTP API, but now we can do the same trick as with the Grafan
prometheus, by default, when launching, it knows how to pull up the configs of the data sources and dashboards
Expanding
Remember that grafana doesn’t immediately rise, it scares a bit with sqlite migrations that you can see in the submenu logs.
Now go to http: // localhost: 3000 /
And click on the dashboard.
If you want to add a new view or change the existing one, change it directly in the interface, and then click Save, you will get a modal window with json, which you need to put in the config-map
To perform crown tasks in a cuber there is a CronJob concept.
With the help of CronJob, you can set a schedule for performing any tasks, the simplest example:
In the schedule section, the classic rule for the krone is set.
By trigger, the pod of the container (busybox) is launched in which I pull the metricsdemo api service method.
You can use the command to monitor the job.
The main service, which is pulled from the job, is launched in several instances, because the call to the service goes to one of the pods with an approximately uniform spread
A small demo on the example of calculating the number π, about the difference in launches from the console
If the application terminates unexpectedly, the cluster restarts pod.
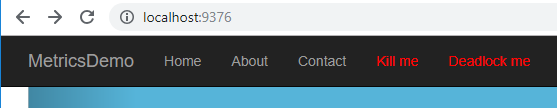
For example, I made a method that drops the api
* The exception that occurred in api in the async method. void is considered a unhandled exception, which completely crashes the application.
I make a call to http: // localhost: 9376 / api / job / kill / me.
In the list of pods you can see that one of the pods of the service was restarted.
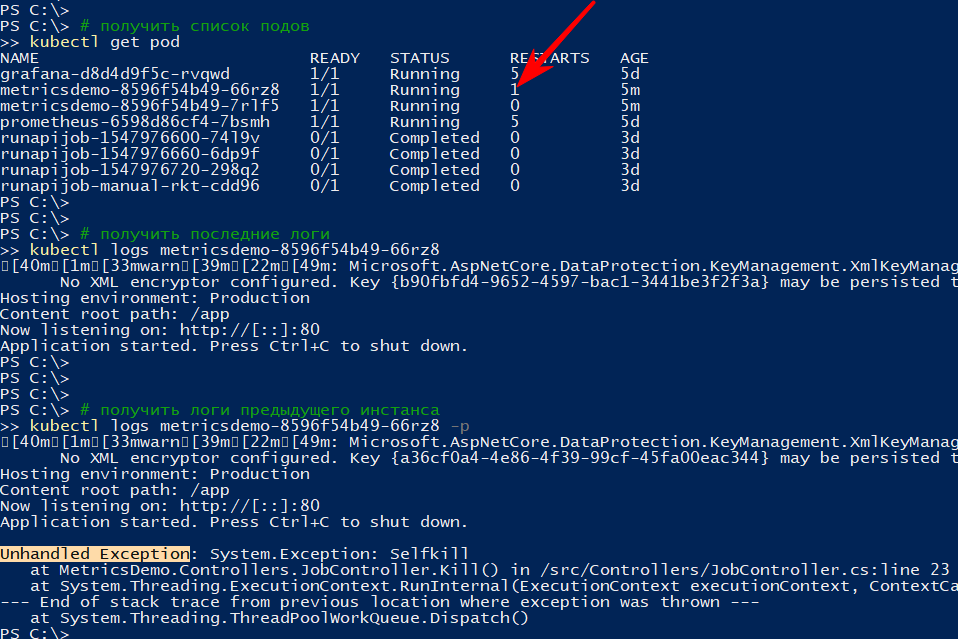
The logs command shows the current output, and with the -p option will output the logs of the previous instance. In this way, you can find out the reason for the restart.
I think with a simple fall everything is clear: it fell - it rose.
But the application can be conditionally alive, i.e. not fallen, but doing nothing, or doing their job, but slowly
According to the documentation, there are at least two types of checks for “survivability” of applications in the subfields
I will check the restart by timeout, for this I add a new api method, which, according to a certain command, will start to slow down the method of checking survivability for 123 seconds
In the file 1-deployment-app.yaml I add a couple of sections to the container:
Redeploy, I am convinced that the apish has started and subscribe to events
I press the Deadlock me menu ( http: // localhost: 9376 / api / job / alive / deadlock )
And within five seconds I begin to observe the problem and its solution
 Source code and jaskas are available on github
- Installing Kubernetes
- Installing UI
- Running your application in a cluster
- Adding custom metrics to the application
- Collecting metrics through Prometheus
- Displaying metrics in Grafana
- Running tasks on a schedule
- Fault tolerance
- Conclusions
- Notes
- References
Kubernetes installation
not suitable for linux users, you will have to use minikube
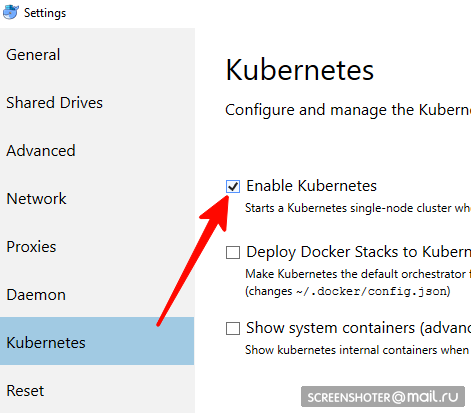
- Do you have a docker desktop
- You need to find and enable Kubernetes single-node cluster in it.
- Now you have api http: // localhost: 8001 / for working with cuberntes
- You communicate with him through the convenient utility kubectl.
Check its version with the command>kubectl version
The last actual is written here https://storage.googleapis.com/kubernetes-release/release/stable.txt
You can download the corresponding link https://storage.googleapis.com /kubernetes-release/release/v1.13.2/bin/windows/amd64/kubectl.exe - Check that the cluster works>
kubectl cluster-info
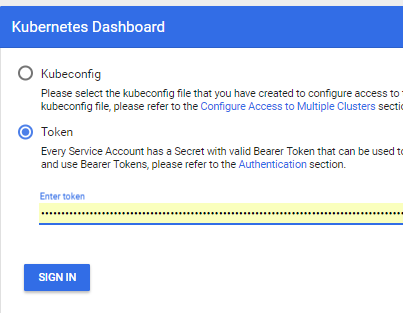
UI installation
- The interface is deployed in the cluster itself.
kubectl create -f https://raw.githubusercontent.com/kubernetes/dashboard/master/aio/deploy/recommended/kubernetes-dashboard.yaml - Get a token to access the interface
kubectl describe secret
And copy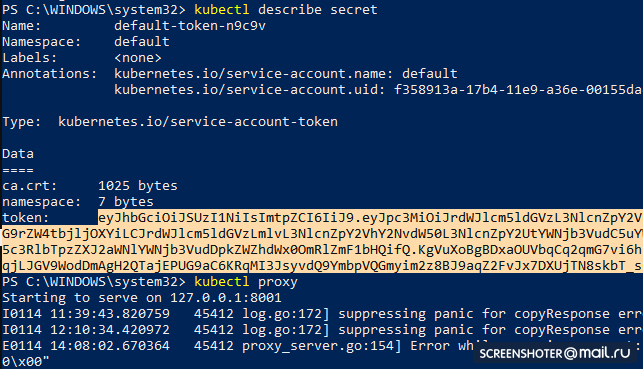
- Now run the proxy
kubectl proxy - And you can use http: // localhost: 8001 / api / v1 / namespaces / kube-system / services / https: kubernetes-dashboard: / proxy /
Run your application in a cluster
- I made a standard mvc netcoreapp2.1 application through the studio https://github.com/SanSYS/kuberfirst
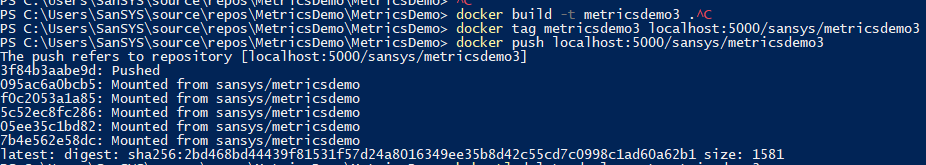
- Dockerfile:
FROM microsoft/dotnet:2.1-aspnetcore-runtime AS base WORKDIR /app EXPOSE 80 FROM microsoft/dotnet:2.1-sdk AS build WORKDIR /src COPY ./MetricsDemo.csproj . RUN ls RUN dotnet restore "MetricsDemo.csproj" COPY . . RUN dotnet build "MetricsDemo.csproj" -c Release -o /app FROM build AS publish RUN dotnet publish "MetricsDemo.csproj" -c Release -o /app FROM base AS final WORKDIR /app COPY --from=publish /app . ENTRYPOINT ["dotnet", "MetricsDemo.dll"] - Collected this business with a metricsdemo3 tag
docker build -t metricsdemo3 . - But! Kuber defaults to drawing images from the hub, so I raise the local register
- Note - did not try to run in cubernetis
docker create -p 5000:5000 --restart always --name registry registry:2 - And I prescribe it as permitted unsafe:
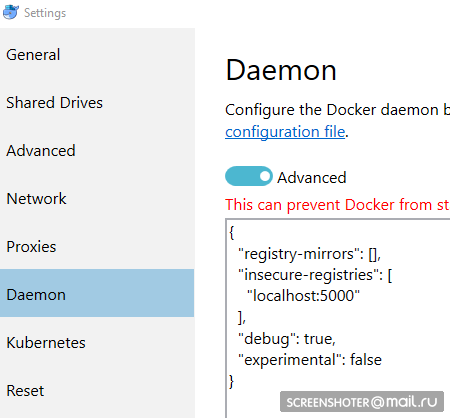
{ "registry-mirrors": [], "insecure-registries": [ "localhost:5000" ], "debug": true, "experimental": false } - Before we push in, register a couple more gestures
docker start registry docker tag metricsdemo3 localhost:5000/sansys/metricsdemo3 docker push localhost:5000/sansys/metricsdemo3 - It turns out like this:
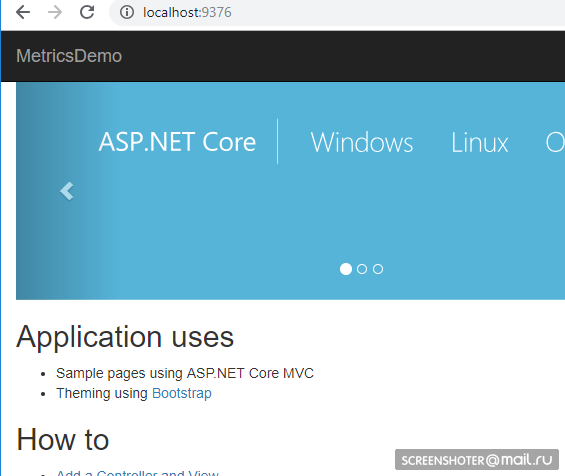
- Run via UI
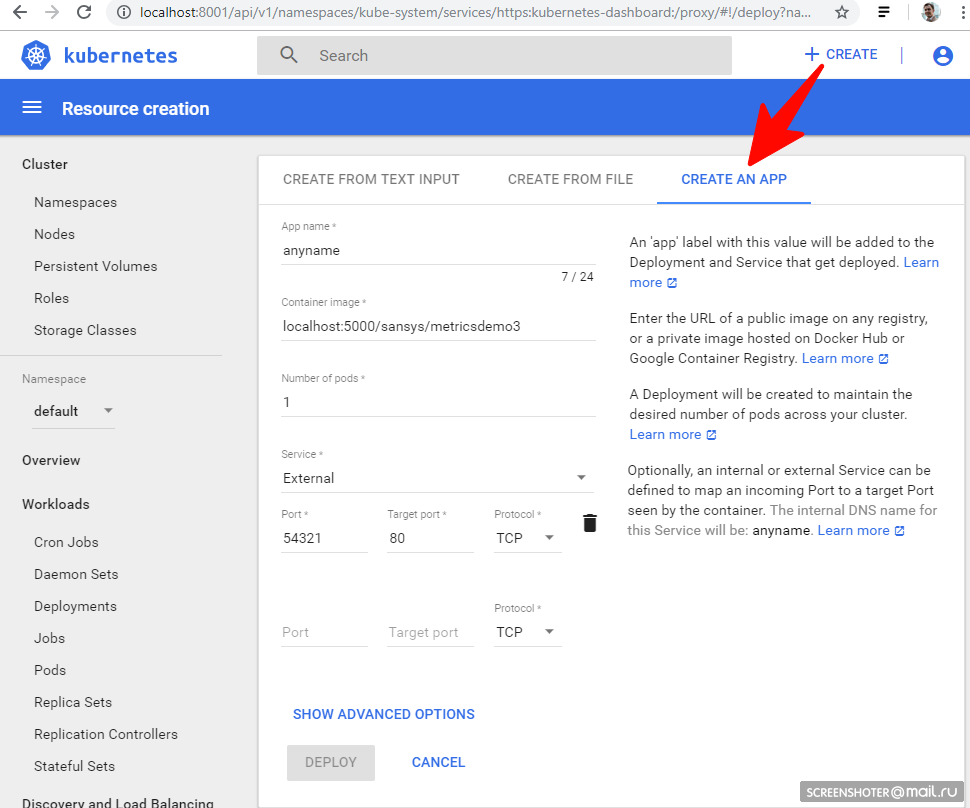
If started, then everything is OK and you can start using
Create a deployment file
1-deployment-app.yaml
kind: Deployment
apiVersion: apps/v1
metadata:
  name: metricsdemo
  labels:
    app: web
spec:
  replicas: 2 # сколько подов поднять (инстансов запущенных приложений)# селектор решает, на какие шаблоны распространяется деплой
  selector:
    matchLabels:
      app: metricsdemo
  template:
    metadata:
      labels:
        app: metricsdemo # по этой метке ищет selector в kind: Service
    spec:
      containers:
      - name: metricsdemo # имя деплоя
        image: localhost:5000/sansys/metricsdemo3 # образ в докере
        ports:
        - containerPort: 80 # какой порт слушает приложение внутри докера# ВАЖНО: три дефиса делят файл, как бы на два отдельных ямла
---
kind: Service
apiVersion: v1
metadata:
  name: metricsdemo # имя для прометеуса __meta_kubernetes_service_name="metricsdemo", см https://prometheus.io/docs/prometheus/latest/configuration/configuration/#kubernetes_sd_config
  labels:
    apptype: business # имя для прометеуса __meta_kubernetes_service_label_apptype="business" - запомни
    instancetype: web # имя для прометеуса __meta_kubernetes_service_label_instancetype="web"
spec:
  selector:
    app: metricsdemo # селектор приложений по labels:apptype: LoadBalancer # реверспрокси из вне до подов
  ports:
  - protocol: TCP # имя для прометеуса _meta_kubernetes_service_port_protocol="TCP"
    port: 9376
    targetPort: 80
    name: portapi # имя для прометеуса __meta_kubernetes_service_port_name="portapi"
Short description
- Kind - indicates that the entity type is described through the yaml file.
- apiVersion - in which the object is passed
- labels - in fact, just labels (the keys on the left and the values can be invented by ourselves)
- selector - allows you to associate services with deploem, for example, through tags
Further:
kubectl create -f .\1-deployment-app.yaml
And you should see your interface http: // localhost: 8001 / api / v1 / namespaces / kube-system / services / https: kubernetes-dashboard: / proxy / #! / Deployment? Namespace = default
Screen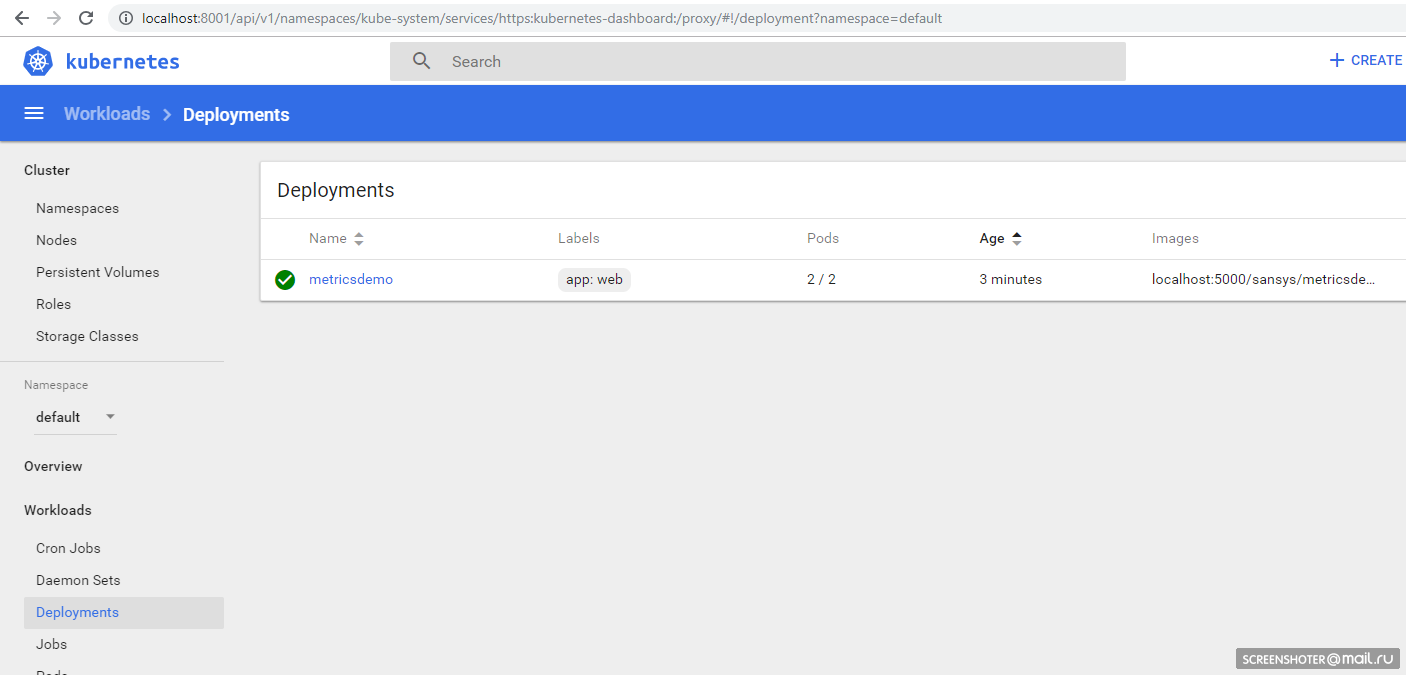
Inside of which there is a Replica Set, showing that the application is running in duplicate (Pods) and there is one related service with an address from the outside to open the completed application in the browser
Screenshots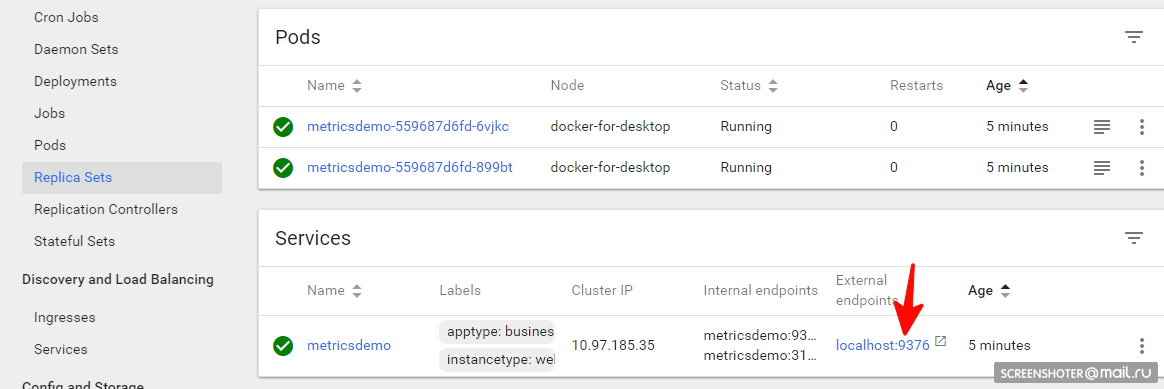
Adding custom metrics to the application
Added a package to the application https://www.app-metrics.io/
I will not describe in detail how I will not add them, while briefly - register the middleware for the increment of call counters of api methods
This is what middleware looks like.
privatestaticvoidAutoDiscoverRoutes(HttpContext context)
{
    if (context.Request.Path.Value == "/favicon.ico")
        return;
    List<string> keys = new List<string>();
    List<string> vals = new List<string>();
    var routeData = context.GetRouteData();
    if (routeData != null)
    {
        keys.AddRange(routeData.Values.Keys);
        vals.AddRange(routeData.Values.Values.Select(p => p.ToString()));
    }
    keys.Add("method");     vals.Add(context.Request.Method);
    keys.Add("response");   vals.Add(context.Response.StatusCode.ToString());
    keys.Add("url");        vals.Add(context.Request.Path.Value);
    Program.Metrics.Measure.Counter.Increment(new CounterOptions
    {
        Name = "api",
        //ResetOnReporting = true, // обнулять, если коллетор собрал данные
        MeasurementUnit = Unit.Calls,
        Tags = new MetricTags(keys.ToArray(), vals.ToArray())
    });
}
And the collected metrics are available at http: // localhost: 9376 / metrics
* IMetricRoot or its abstraction can be easily registered in services and used in the application ( services.AddMetrics (Program.Metrics); )
Collecting metrics through Prometheus
The most basic setting of prometheus: add a new job to its config (prometheus.yml) and feed it a new target:
global:
  scrape_interval:     15s
  evaluation_interval: 15s
rule_files:
  # - "first.rules"# - "second.rules"
scrape_configs:
  - job_name: prometheus
    static_configs:
      - targets: ['localhost:9090', 'ещё_один_сервис:порт']
But Prometheus has native support for collecting metrics from cubernetis https://prometheus.io/docs/prometheus/latest/configuration/configuration/#kubernetes_sd_config
I want to monitor each service individually filtering by tag apptype: business
After reviewing the dock, it turns out that:
- job_name: business-metrics # просто придумал имя джоба
  metrics_path: /metrics
  kubernetes_sd_configs:
    - role: endpoints # какую сущность мониторить. ещё есть service,pod,ingress
  static_configs:
  - targets:
    - localhost:9090
  relabel_configs: # собираю метрики сервисов только из пространства default и приложений c меткой apptype = business
  - action: keep
    regex: default;business
    source_labels:
    - __meta_kubernetes_namespace
    - __meta_kubernetes_service_label_apptype
In Cubernetis there is a special place for storing configs files - ConfigMap.
There you save this config:
2-prometheus-configmap.yaml
apiVersion: v1
kind: ConfigMap # тип сущности, обрати внимание
metadata:
  name: prometheus-config # имя конфиг-маппы
  namespace: default
  labels:
    kubernetes.io/cluster-service: "true"
    addonmanager.kubernetes.io/mode: EnsureExists
data:
  # имя файла в конфиге
  prometheus.yml: |
    global:
      scrape_interval:     5s # Default is every 1 minute.
      evaluation_interval: 5s # The default is every 1 minute.
    scrape_configs:
    - job_name: prometheus
      static_configs:
      - targets:
        - localhost:9090
    - job_name: business-metrics # просто придумал имя джоба
      metrics_path: /metrics
      kubernetes_sd_configs:
        - role: endpoints # какую сущность мониторить. ещё есть service,pod,ingress
      static_configs:
      - targets:
        - localhost:9090
      relabel_configs: # собираю метрики сервисов только из пространства default и приложений c меткой apptype = business
      - action: keep
        regex: default;business
        source_labels:
        - __meta_kubernetes_namespace
        - __meta_kubernetes_service_label_apptype
Departure for Cubernetis
kubectl create -f .\2-prometheus-configmap.yamlNow you need to shut the prometheus with this config file.
kubectl create -f. \ 3-deployment-prometheus.yaml
apiVersion: extensions/v1beta1
kind: Deployment
metadata:
  name: prometheus
  namespace: default
spec:
  replicas: 1
  template:
    metadata:
      labels:
        app: prometheus-server
    spec:
      containers:
        - name: prometheus
          image: prom/prometheus
          args:
            - "--config.file=/etc/config/prometheus.yml"
            - "--web.enable-lifecycle"
          ports:
            - containerPort: 9090
          volumeMounts:
            - name: prometheus-config-volume # какой вольюм монтировать
              mountPath: /etc/config/ # в качестве какой директории
      volumes:
        - name: prometheus-config-volume # объявление вольюма в деплое
          configMap:
            defaultMode: 420
            name: prometheus-config # имя конфиг-маппы
---
kind: Service
apiVersion: v1
metadata:
  name: prometheus
spec:
  selector:
    app: prometheus-server # селектор приложений по labels:apptype: LoadBalancer # реверспрокси из вне до подов
  ports:
  - protocol: TCP
    port: 9090
    targetPort: 9090
Notice - file prometheus.yml nowhere indicates
all files that were specified in the config files are Mape under prometheus-config-volume, which is mounted in the directory / etc / config /
Also listed container startup arguments through to the config
- -web.enable-lifecycle - says that you can pull POST / - / reload, which will apply the new config files (useful if configuration changes "on the fly" and does not want to restart the container)
Actually deploy
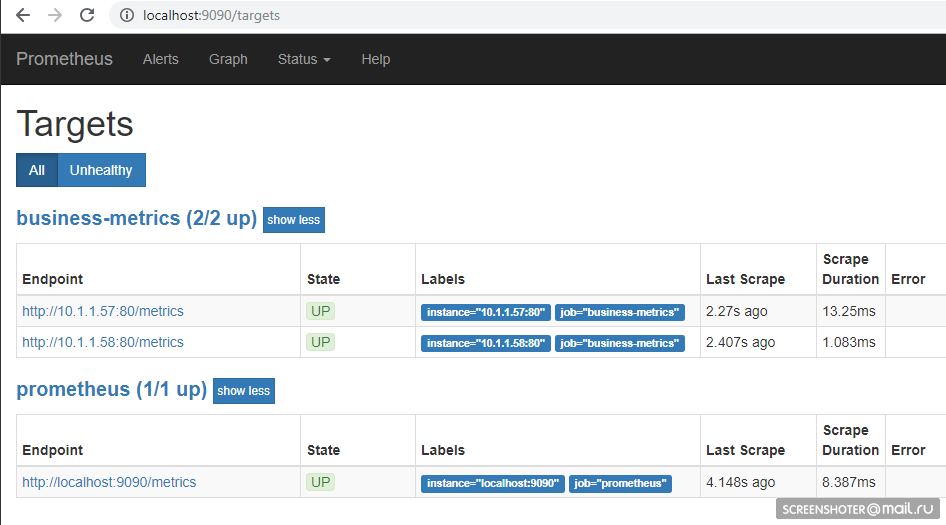
kubectl create -f .\3-deployment-prometheus.yamlFollow a little after the rise of the basement and go to the address http: // localhost: 9090 / targets , there you should see the endpoints of your service.
And on the main page you can write requests to prometheus
sum by (response, action, url, app) (delta(application_api[15s]))Provided that the site still someone like, it turns out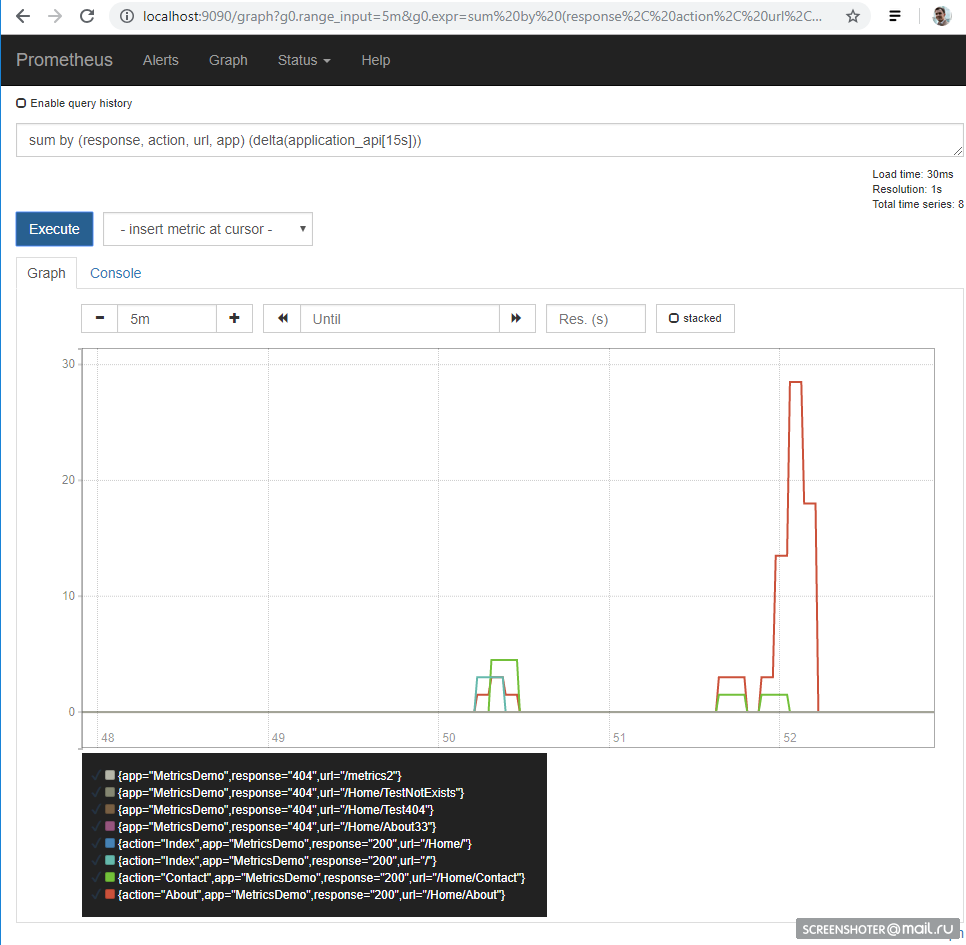
The query language is https://prometheus.io/docs/prometheus/latest/querying/basics/
Displaying metrics in Grafana
We were lucky - before version 5, we could only slip the configs of the dashboards via HTTP API, but now we can do the same trick as with the Grafan
prometheus, by default, when launching, it knows how to pull up the configs of the data sources and dashboards
/etc/grafana/provisioning/datasources/- configs of sources (settings for access to promethus, postgres, zabbiks, elastic, etc.)/etc/grafana/provisioning/dashboards/- access settings to dashboards/var/lib/grafana/dashboards/- here I will store the dashboards themselves as json files
It turned out like this
apiVersion: v1
kind: ConfigMap
metadata:
  creationTimestamp: null
  name: grafana-provisioning-datasources
  namespace: default
data:
  all.yml: |
    datasources:
    - name: 'Prometheus'type: 'prometheus'
      access: 'proxy'
      org_id: 1
      url: 'http://prometheus:9090'
      is_default: true
      version: 1
      editable: true
---
apiVersion: v1
kind: ConfigMap
metadata:
  creationTimestamp: null
  name: grafana-provisioning-dashboards
  namespace: default
data:
  all.yml: |
    apiVersion: 1
    providers:
    - name: 'default'
      orgId: 1
      folder: ''type: file
      disableDeletion: false
      updateIntervalSeconds: 10 #how often Grafana will scan for changed dashboards
      options:
        path: /var/lib/grafana/dashboards
---
apiVersion: v1
kind: ConfigMap
metadata:
  creationTimestamp: null
  name: grafana-dashboards
  namespace: default
data:
  service-http-requests.json: |
    {
      "annotations": {
        "list": [
          {
            "builtIn": 1,
            "datasource": "-- Grafana --",
            "enable": true,
            "hide": true,
            "iconColor": "rgba(0, 211, 255, 1)",
            "name": "Annotations & Alerts",
            "type": "dashboard"
          }
        ]
      },
      "editable": true,
      "gnetId": null,
      "graphTooltip": 0,
      "links": [],
      "panels": [
        {
          "aliasColors": {},
          "bars": false,
          "dashLength": 10,
          "dashes": false,
          "fill": 1,
          "gridPos": {
            "h": 9,
            "w": 12,
            "x": 0,
            "y": 0
          },
          "id": 2,
          "legend": {
            "alignAsTable": false,
            "avg": false,
            "current": false,
            "max": false,
            "min": false,
            "rightSide": true,
            "show": true,
            "total": false,
            "values": false
          },
          "lines": true,
          "linewidth": 1,
          "links": [],
          "nullPointMode": "null",
          "percentage": false,
          "pointradius": 5,
          "points": false,
          "renderer": "flot",
          "seriesOverrides": [],
          "spaceLength": 10,
          "stack": false,
          "steppedLine": false,
          "targets": [
            {
              "expr": "sum by (response, action, url, app) (delta(application_api[15s]))",
              "format": "time_series",
              "interval": "15s",
              "intervalFactor": 1,
              "legendFormat": "{{app}} {{response}} - {{url}}",
              "refId": "A"
            }
          ],
          "thresholds": [],
          "timeFrom": null,
          "timeRegions": [],
          "timeShift": null,
          "title": "Http requests",
          "tooltip": {
            "shared": true,
            "sort": 0,
            "value_type": "individual"
          },
          "type": "graph",
          "xaxis": {
            "buckets": null,
            "mode": "time",
            "name": null,
            "show": true,
            "values": []
          },
          "yaxes": [
            {
              "format": "short",
              "label": null,
              "logBase": 1,
              "max": null,
              "min": null,
              "show": true
            },
            {
              "format": "short",
              "label": null,
              "logBase": 1,
              "max": null,
              "min": null,
              "show": true
            }
          ],
          "yaxis": {
            "align": false,
            "alignLevel": null
          }
        }
      ],
      "refresh": "5s",
      "schemaVersion": 16,
      "style": "dark",
      "tags": [],
      "templating": {
        "list": []
      },
      "time": {
        "from": "now-30m",
        "to": "now"
      },
      "timepicker": {
        "refresh_intervals": [
          "5s",
          "10s",
          "30s",
          "1m",
          "5m",
          "15m",
          "30m",
          "1h",
          "2h",
          "1d"
        ],
        "time_options": [
          "5m",
          "15m",
          "1h",
          "6h",
          "12h",
          "24h",
          "2d",
          "7d",
          "30d"
        ]
      },
      "timezone": "",
      "title": "Business metrics",
      "uid": "Dm0tD0Qik",
      "version": 1
    }
Deploy itself, nothing new
apiVersion: extensions/v1beta1
kind: Deployment
metadata:
  name: grafana
  namespace: default
  labels:
    app: grafana
    component: core
spec:
  replicas: 1
  template:
    metadata:
      labels:
        app: grafana
        component: core
    spec:
      containers:
      - image: grafana/grafana
        name: grafana
        imagePullPolicy: IfNotPresent
        resources:
          limits:
            cpu: 100m
            memory: 100Mi
          requests:
            cpu: 100m
            memory: 100Mi
        env:
          - name: GF_AUTH_BASIC_ENABLED
            value: "true"
          - name: GF_AUTH_ANONYMOUS_ENABLED
            value: "true"
          - name: GF_AUTH_ANONYMOUS_ORG_ROLE
            value: Admin
        readinessProbe:
          httpGet:
            path: /login
            port: 3000
          # initialDelaySeconds: 30# timeoutSeconds: 1
        volumeMounts:
        - name: grafana-provisioning-datasources
          mountPath: /etc/grafana/provisioning/datasources/
        - name: grafana-provisioning-dashboards
          mountPath: /etc/grafana/provisioning/dashboards/
        - name: grafana-dashboards
          mountPath: /var/lib/grafana/dashboards/
      volumes:
        - name: grafana-provisioning-datasources
          configMap:
            defaultMode: 420
            name: grafana-provisioning-datasources
        - name: grafana-provisioning-dashboards
          configMap:
            defaultMode: 420
            name: grafana-provisioning-dashboards
        - name: grafana-dashboards
          configMap:
            defaultMode: 420
            name: grafana-dashboards
      nodeSelector:
        beta.kubernetes.io/os: linux
---
apiVersion: v1
kind: Service
metadata:
  name: grafana
  namespace: default
  labels:
    app: grafana
    component: core
spec:
  type: LoadBalancer
  ports:
  - protocol: TCP
    port: 3000
    targetPort: 3000
  selector:
    app: grafana
    component: core
Expanding
kubectl create -f .\4-grafana-configmap.yaml
kubectl create -f .\5-deployment-grafana.yaml
Remember that grafana doesn’t immediately rise, it scares a bit with sqlite migrations that you can see in the submenu logs.
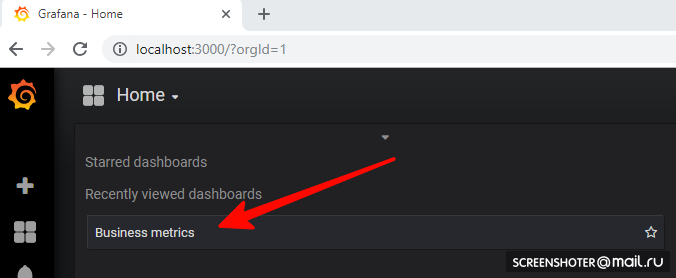
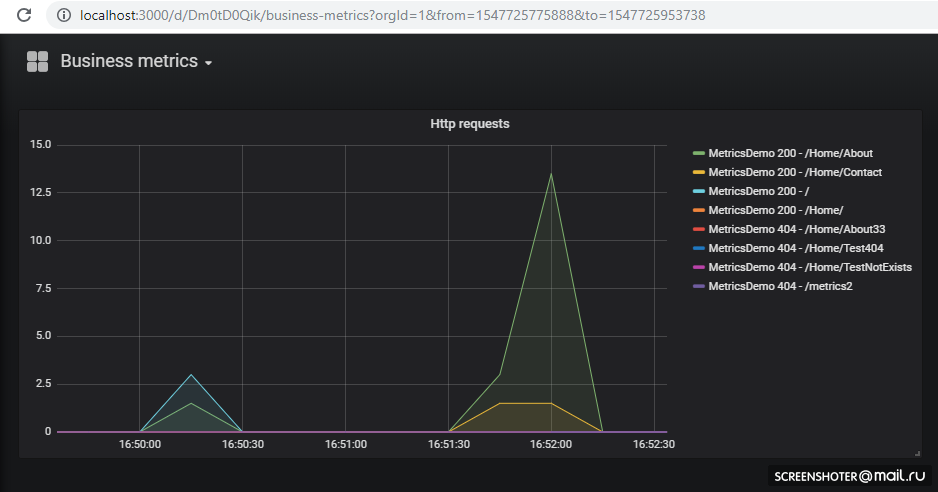
Now go to http: // localhost: 3000 /
And click on the dashboard.
If you want to add a new view or change the existing one, change it directly in the interface, and then click Save, you will get a modal window with json, which you need to put in the config-map
Everything is deployed and works fine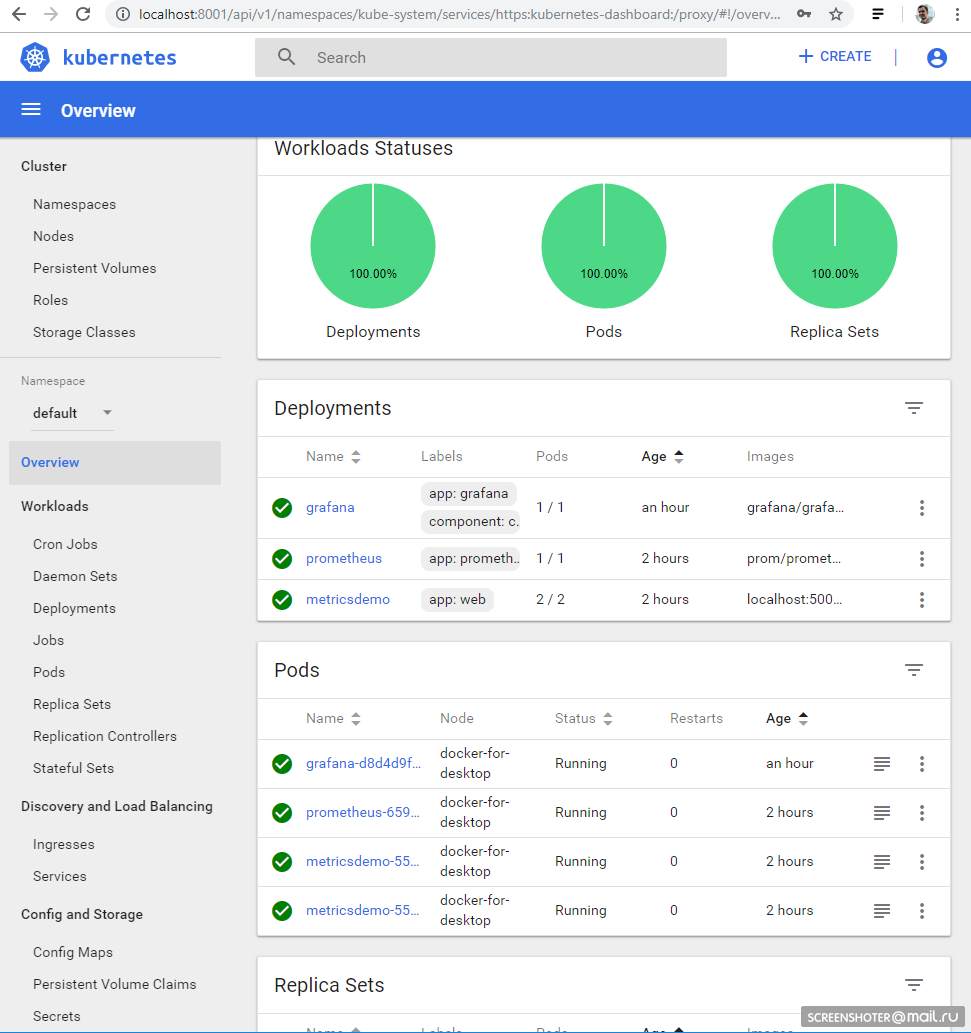
Scheduled Tasks
To perform crown tasks in a cuber there is a CronJob concept.
With the help of CronJob, you can set a schedule for performing any tasks, the simplest example:
# https://kubernetes.io/docs/tasks/job/automated-tasks-with-cron-jobs/
apiVersion: batch/v1beta1
kind: CronJob
metadata:
  name: runapijob
spec:
  schedule: "*/1 * * * *"
  jobTemplate:
    spec:
      template:
        spec:
          containers:
          - name: runapijob
            image: busybox
            args:
            - /bin/sh
            - -c
            - date; wget -O - http://metricsdemo:9376/api/job/run/wakeUp > /dev/null
          restartPolicy: OnFailure
In the schedule section, the classic rule for the krone is set.
By trigger, the pod of the container (busybox) is launched in which I pull the metricsdemo api service method.
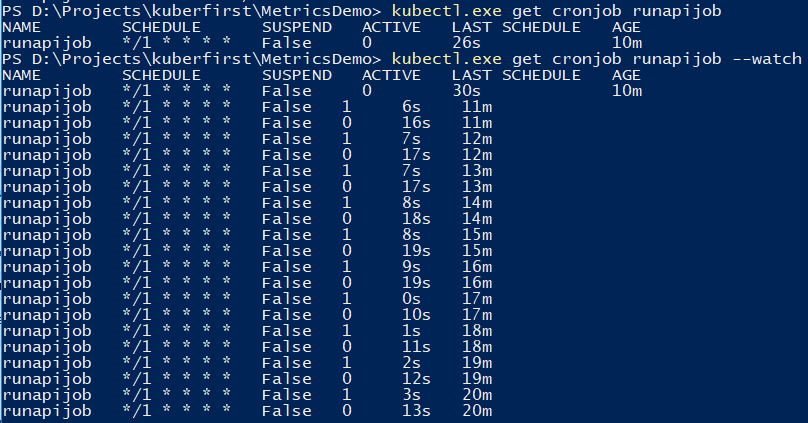
You can use the command to monitor the job.
kubectl.exe get cronjob runapijob --watchThe main service, which is pulled from the job, is launched in several instances, because the call to the service goes to one of the pods with an approximately uniform spread
What it looks like in Prometheus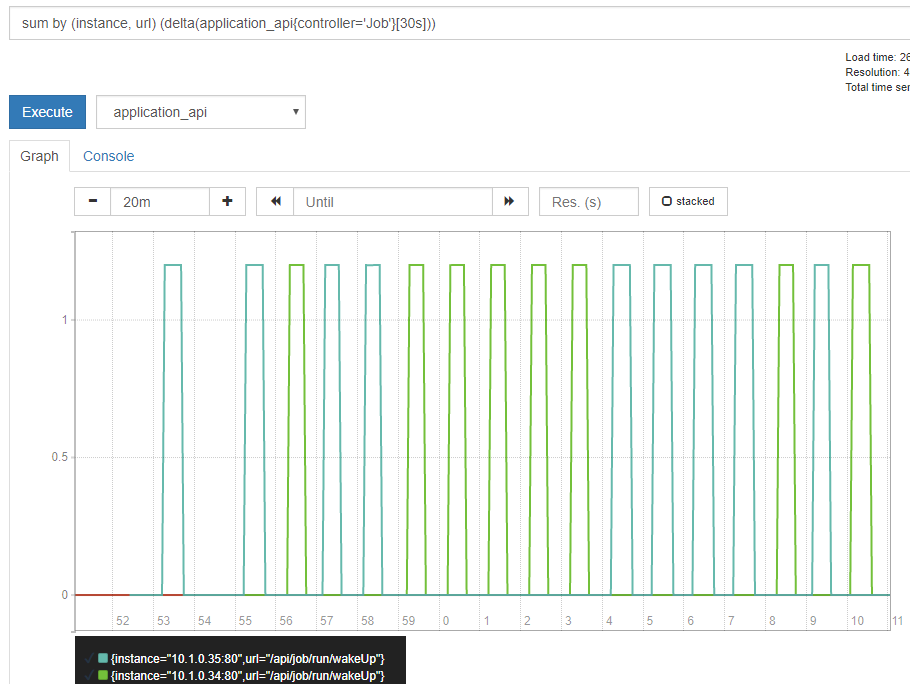
In order to debug joba you can trigger manually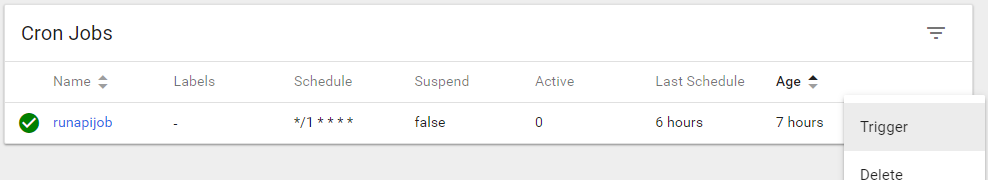
A small demo on the example of calculating the number π, about the difference in launches from the console
# запуск целого деплоймента, но приложение завершается и возвращает контроль - репликасет постоянно пытается его рестартануть
kubectl run pi --image=perl -- perl -Mbignum=bpi -wle 'print bpi(2000)'# запуск одноразового джоба. Запустится, завершится, и всё. Результат расчёта - в логах
kubectl run pi --image=perl --restart=OnFailure -- perl -Mbignum=bpi -wle 'print bpi(2000)'# запуск кронджоба каждые 5 минут
kubectl run pi --image=perl --restart=OnFailure --schedule="0/5 * * * ?" -- perl -Mbignum=bpi -wle 'print bpi(2000)'
fault tolerance
If the application terminates unexpectedly, the cluster restarts pod.
For example, I made a method that drops the api
[HttpGet("kill/me")]
publicasyncvoidKill()
{
    thrownew Exception("Selfkill");
}
* The exception that occurred in api in the async method. void is considered a unhandled exception, which completely crashes the application.
I make a call to http: // localhost: 9376 / api / job / kill / me.
In the list of pods you can see that one of the pods of the service was restarted.
The logs command shows the current output, and with the -p option will output the logs of the previous instance. In this way, you can find out the reason for the restart.
I think with a simple fall everything is clear: it fell - it rose.
But the application can be conditionally alive, i.e. not fallen, but doing nothing, or doing their job, but slowly
According to the documentation, there are at least two types of checks for “survivability” of applications in the subfields
- readiness - this type of test is used to understand whether it is possible to start traffic to this pod. If not, pod is unbalanced until it returns to normal.
- liveness - check the application for survivability. In particular, if there is no access to a vital resource or the application does not respond at all (say, deadlock and therefore timeout), then the container will be restarted. All http codes between 200 and 400 are considered successful, the rest are Fail.
I will check the restart by timeout, for this I add a new api method, which, according to a certain command, will start to slow down the method of checking survivability for 123 seconds
staticbool deadlock;
[HttpGet("alive/{cmd}")]
publicstringKill(string cmd)
{
    if (cmd == "deadlock")
    {
        deadlock = true;
        return"Deadlocked";
    }
    if (deadlock)
        Thread.Sleep(123 * 1000);
    return deadlock ? "Deadlocked!!!" : "Alive";
}
In the file 1-deployment-app.yaml I add a couple of sections to the container:
containers:
- name: metricsdemo
  image: localhost:5000/sansys/metricsdemo3:6
  ports:
  - containerPort: 80
  readinessProbe: # способно ли приложение сейчас обрабатывать запросы
    httpGet:
      path: /health
      port: 80
    initialDelaySeconds: 5
    periodSeconds: 5
  livenessProbe:  # живо ли приложение в принципе
    httpGet:
      path: /api/job/alive/check
      port: 80
    initialDelaySeconds: 5
    periodSeconds: 5
Redeploy, I am convinced that the apish has started and subscribe to events
kubectl get events --watchI press the Deadlock me menu ( http: // localhost: 9376 / api / job / alive / deadlock )
And within five seconds I begin to observe the problem and its solution
1s    Warning   Unhealthy   Pod   Liveness probe failed: Get http://10.1.0.137:80/api/job/alive/check: net/http: request canceled (Client.Timeout exceeded while awaiting headers)
1s    Warning   Unhealthy   Pod   Liveness probe failed: Get http://10.1.0.137:80/api/job/alive/check: net/http: request canceled (Client.Timeout exceeded while awaiting headers)
0s    Warning   Unhealthy   Pod   Liveness probe failed: Get http://10.1.0.137:80/api/job/alive/check: net/http: request canceled (Client.Timeout exceeded while awaiting headers)
0s    Warning   Unhealthy   Pod   Readiness probe failed: Get http://10.1.0.137:80/health: dial tcp 10.1.0.137:80: connect: connection refused
0s    Normal   Killing   Pod   Killing container with id docker://metricsdemo:Container failed liveness probe.. Container will be killed and recreated.
0s    Normal   Pulled   Pod   Container image "localhost:5000/sansys/metricsdemo3:6" already present on machine
0s    Normal   Created   Pod   Created container
0s    Normal   Started   Pod   Started container
findings
- On the one hand, the threshold of entry was much lower than I thought, on the other hand, this is not a real kubernetes cluster, but only a developer’s computer. And the limits for resources, stateful applications, a / b testing, etc. were not considered.
- Prometheus tried for the first time at all, but reading various documents and examples in the process of reviewing the cuber made it clear that it is quite good for collecting metrics from the cluster and applications in it
- So good that it allows the developer to implement a feature on his computer and, in addition to the information, also applies to the deployment - the graphics deployment to the graph. As a consequence, new metrics automatic machine without add. efforts will be displayed on the Stage and Prode. Conveniently
Notes
- Applications can communicate with each other according
имени сервиса:портуto what is done with grafana → promethaus. For those familiar with docker-compose, there is nothing new here. kubectl create -f file.yml- create an entitykubectl delete -f file.yml- remove entitykubectl get pod- get a list of all podov (service, endpoints ...)--namespace=kube-system- filtering by namespace-n kube-system- similarly
kubectl -it exec grafana-d8d4d9f5c-cvnkh -- /bin/bash- Attachment to the hearthkubectl delete service grafana- remove service pod. deploy (--all - remove all)kubectl describe- describe the essence (you can all at once)kubectl edit service metricsdemo- edit all pit on the fly through the launch of the notebookDemo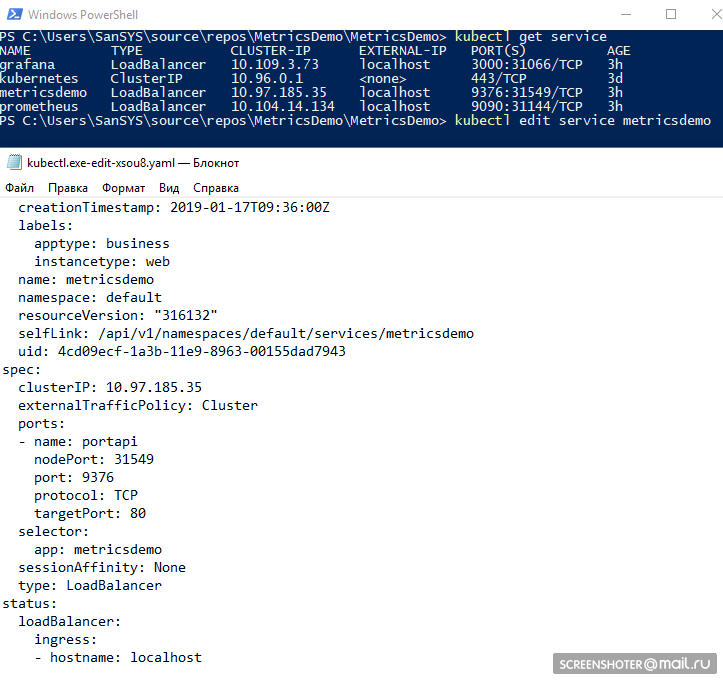
kubectl --help- great help)- A typical problem is pod (consider a running image), something went wrong and there are no options, except how to unwind inside (via tcpdump / nc etc.). - Yuzay kubectl-debug habr.com/en/company/flant/blog/436112
Bibliography
- What is the App Metrics?
- Kubernetes
- Prometheus
- Configuration of pre-prepared grafana
- Spy on how people are doing (but there are already some things out of date) - in principle there is about logging, alerting, etc.
- Helm - The package manager for Kubernetes - through it, it was easier to organize Prometheus + Grafana, but manually - more understanding appears
- The pit for promethus from cuber
- Kubernetes Failure Stories
- Kubernetes-ha. We deploy the Kubernetes failover cluster with 5 masters
Only registered users can participate in the survey. Sign in , please.