AIOps in practice - what can Huawei FabricInsight
In response to an increase in the number of running applications and the number of network devices, network bandwidth increases and packet delivery requirements are tightened. On a scale of cloud-critical data centers critical for business, the traditional approach to infrastructure maintenance no longer allows solving typical tasks. Therefore, the concept of AIOps (Algorithmic IT Operations) was born.
According to Gartner, about 50% of companies will use AIOps by next year. We can talk about what similar tools can do today, using the example of Huawei FabricInsight, a network analyzer that is part of a comprehensive solution for Huawei CloudFabric data centers.
The digital transformation of enterprises provides new opportunities - the introduction of Big Data analysis, the development of machine learning algorithms - is no longer just a fad, but a conscious need, the closure of which brings real profit. However, new implementations entail a multiple increase in the complexity of the infrastructure, which at the same time poses new challenges in terms of its maintenance.
The main problem of maintaining large infrastructure today is the amount of data that must be collected and processed to obtain information about the status of the data center, as well as the speed with which a relevant answer should be given to the causes of failures. On the one hand, the number of monitored parameters is constantly growing, on the other, time is playing against organizations, because the goal of any company is to restore the availability of its services as soon as possible if something went wrong (especially considering the stringent SLA requirements). The speed of the "rise" of the service after the collapse is largely determined by the speed of the incident investigation. And it, in turn, depends on the completeness of information about what is happening. But if at least 50 - 100 server racks are installed in the data center,
Standard mechanisms - SNMP and xFlow - collect data only every 5-15 minutes, sampling information. They were originally developed with an eye to the limitations of post-processing of accumulated data without the task of identifying problems in real time. And even such limited data collection affects the operation of network devices.
Considering that problematic traffic is only 3.65%, the traditional approach, based on the analysis results, reveals only 30% of network problems, 70% are not visible to monitoring systems.
Experienced administrators who know what and where to look are needed to identify the root of the problem from data collected by SNMP and xFlow. Problems have to be identified by analyzing huge logs and multiple error messages, and then manually making configuration changes. But with the development of SDN, with the virtualization of physical resources, manual configuration is a thing of the past. Today, even a whole staff of system administrators can no longer ensure the continuous compliance of infrastructure parameters with business requirements.
The FabricInsight Network Analysis Platform offers a different approach, automating network maintenance and failure point detection. FabricInsight analyzes the behavior of applications, identifies the network paths they use and tracks the status of devices on them.

This approach is based on two key components - the collection of all available data and their automatic analysis. Complemented with functional visualization and a policy of data openness, this approach allows us to solve many of the problems that were previously dead ends.
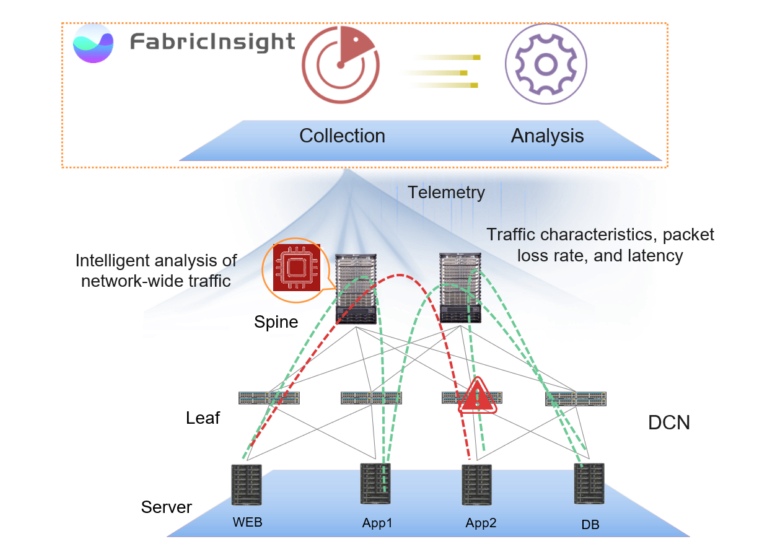
The key to a quick response to the situation is the full picture of what is happening inside the data center at the network level. FabricInsight uses a push telemetry subscription mechanism to collect all second-level service data in a timely manner without sampling. To get a complete picture of the network, data is collected on the operation of devices, applications and the passage of network traffic (TCP SYN, FIN, and RST packets) - ERSPAN is supported for mirroring packets without using the device’s CPU and Google’s GRPC for reporting the performance of the devices themselves.
The collected data through the FabricInsight LEAF is transmitted to the FabricInsight Collector, which monitors the temporal parameters of the packet passing through the network. Collector provides network traffic data with timestamps, encodes and sends over HTTP to FabricInsight Analyzer. This approach allows you to collect maximum information about the network, capturing even short-term bursts of traffic that cannot be detected by "classical" solutions.
At the same time, FabricInsight does not look inside IP packets (it does not capture their contents), using only headers in its work. Thus, it can be used in areas critical for business, for example, where there is work with personal data.
The second integral element of the system is the FabricInsight Analyzer. Receiving the collected data, it identifies traffic paths and runs algorithms that analyze the situation in almost real time. In general, FabricInsight Analyzer correlates network traffic with applications, allowing you to quickly identify and fix problems. Due to machine learning, the algorithms are “trained” to identify normal and abnormal behavior of the infrastructure.
NetworkInsight reflects the results of network analysis in its interface in the form of maps of network status, application interactions, analytics for individual applications, etc., updated in real time. The interface is implemented in such a way as to visually relate the level of applications and specific physical devices responsible for the network’s operability, which speeds up troubleshooting and methods for solving them.
If any anomalies are detected, the initial information is saved automatically, according to which problems have been identified (the storage duration is adjustable), if necessary, FabricInsight warns the user. In addition, the procedures for correcting the situation “in one click with the mouse” through the graphical interface are initialized. At the same time, various error correction patterns are analyzed to find the most relevant approach.
To identify data center anomalies, a correlation analysis of the operation of applications, devices and traffic paths is used, thus various types of anomalies are recorded - both temporary and long-term.

By the way, most of the temporary anomalies mentioned above cannot be fixed using the classical approach. This also applies to some long-term anomalies. A fairly common example is a “crooked” software update. Suppose a certain application was operating in the data center that generated certain traffic. After updating it, the volume of this traffic has changed dramatically, for example, application throughput has decreased, delays have increased. This anomaly will be fixed by FabricInsight.
Another example is the gradual degradation of the optical communication module (loss of performance), preceding the failure. Degradation determines the instability of transmission, which over long periods of time may indicate the need for an early replacement of equipment. But to identify this with a standard approach is extremely difficult.

As an answer to this problem, the FabricInsight interface displays the statuses of all optical modules in the system along with an estimate of the probability of their failure.

Although FabricInsight appeared on the Russian market in January this year, it has already been deployed in ICBC, China UnionPay, China Merchants Bank, PICC and other large data centers based on Huawei infrastructure.
So far, the solution only supports our switches (on Broadcom chipsets), but in the future it is planned to go beyond the ecosystem of one manufacturer. Also, when working on FabricInsight, we initially focused on open standards so that we could make friends with third-party tools normally. For example, Druid can be used to export data from FabricInsight, through which you can send information to third-party visualizers. FabricInsight is also already integrated with Grafana's open rendering tool.
In general, AIOps tools like our FabricInsight are a logical way to develop infrastructure monitoring and maintenance tools. It seems to us that this is the only way to continue to comply with SLA for services.
According to Gartner, about 50% of companies will use AIOps by next year. We can talk about what similar tools can do today, using the example of Huawei FabricInsight, a network analyzer that is part of a comprehensive solution for Huawei CloudFabric data centers.
The digital transformation of enterprises provides new opportunities - the introduction of Big Data analysis, the development of machine learning algorithms - is no longer just a fad, but a conscious need, the closure of which brings real profit. However, new implementations entail a multiple increase in the complexity of the infrastructure, which at the same time poses new challenges in terms of its maintenance.
The main problem of maintaining large infrastructure today is the amount of data that must be collected and processed to obtain information about the status of the data center, as well as the speed with which a relevant answer should be given to the causes of failures. On the one hand, the number of monitored parameters is constantly growing, on the other, time is playing against organizations, because the goal of any company is to restore the availability of its services as soon as possible if something went wrong (especially considering the stringent SLA requirements). The speed of the "rise" of the service after the collapse is largely determined by the speed of the incident investigation. And it, in turn, depends on the completeness of information about what is happening. But if at least 50 - 100 server racks are installed in the data center,
Why does SNMP fail?
Standard mechanisms - SNMP and xFlow - collect data only every 5-15 minutes, sampling information. They were originally developed with an eye to the limitations of post-processing of accumulated data without the task of identifying problems in real time. And even such limited data collection affects the operation of network devices.
Considering that problematic traffic is only 3.65%, the traditional approach, based on the analysis results, reveals only 30% of network problems, 70% are not visible to monitoring systems.
Experienced administrators who know what and where to look are needed to identify the root of the problem from data collected by SNMP and xFlow. Problems have to be identified by analyzing huge logs and multiple error messages, and then manually making configuration changes. But with the development of SDN, with the virtualization of physical resources, manual configuration is a thing of the past. Today, even a whole staff of system administrators can no longer ensure the continuous compliance of infrastructure parameters with business requirements.
FabricInsight works differently
The FabricInsight Network Analysis Platform offers a different approach, automating network maintenance and failure point detection. FabricInsight analyzes the behavior of applications, identifies the network paths they use and tracks the status of devices on them.
This approach is based on two key components - the collection of all available data and their automatic analysis. Complemented with functional visualization and a policy of data openness, this approach allows us to solve many of the problems that were previously dead ends.
Collect all available data.
The key to a quick response to the situation is the full picture of what is happening inside the data center at the network level. FabricInsight uses a push telemetry subscription mechanism to collect all second-level service data in a timely manner without sampling. To get a complete picture of the network, data is collected on the operation of devices, applications and the passage of network traffic (TCP SYN, FIN, and RST packets) - ERSPAN is supported for mirroring packets without using the device’s CPU and Google’s GRPC for reporting the performance of the devices themselves.
The collected data through the FabricInsight LEAF is transmitted to the FabricInsight Collector, which monitors the temporal parameters of the packet passing through the network. Collector provides network traffic data with timestamps, encodes and sends over HTTP to FabricInsight Analyzer. This approach allows you to collect maximum information about the network, capturing even short-term bursts of traffic that cannot be detected by "classical" solutions.
At the same time, FabricInsight does not look inside IP packets (it does not capture their contents), using only headers in its work. Thus, it can be used in areas critical for business, for example, where there is work with personal data.
Real time analysis
The second integral element of the system is the FabricInsight Analyzer. Receiving the collected data, it identifies traffic paths and runs algorithms that analyze the situation in almost real time. In general, FabricInsight Analyzer correlates network traffic with applications, allowing you to quickly identify and fix problems. Due to machine learning, the algorithms are “trained” to identify normal and abnormal behavior of the infrastructure.
NetworkInsight reflects the results of network analysis in its interface in the form of maps of network status, application interactions, analytics for individual applications, etc., updated in real time. The interface is implemented in such a way as to visually relate the level of applications and specific physical devices responsible for the network’s operability, which speeds up troubleshooting and methods for solving them.
If any anomalies are detected, the initial information is saved automatically, according to which problems have been identified (the storage duration is adjustable), if necessary, FabricInsight warns the user. In addition, the procedures for correcting the situation “in one click with the mouse” through the graphical interface are initialized. At the same time, various error correction patterns are analyzed to find the most relevant approach.
Cases
To identify data center anomalies, a correlation analysis of the operation of applications, devices and traffic paths is used, thus various types of anomalies are recorded - both temporary and long-term.
By the way, most of the temporary anomalies mentioned above cannot be fixed using the classical approach. This also applies to some long-term anomalies. A fairly common example is a “crooked” software update. Suppose a certain application was operating in the data center that generated certain traffic. After updating it, the volume of this traffic has changed dramatically, for example, application throughput has decreased, delays have increased. This anomaly will be fixed by FabricInsight.
Another example is the gradual degradation of the optical communication module (loss of performance), preceding the failure. Degradation determines the instability of transmission, which over long periods of time may indicate the need for an early replacement of equipment. But to identify this with a standard approach is extremely difficult.
As an answer to this problem, the FabricInsight interface displays the statuses of all optical modules in the system along with an estimate of the probability of their failure.
Integration
Although FabricInsight appeared on the Russian market in January this year, it has already been deployed in ICBC, China UnionPay, China Merchants Bank, PICC and other large data centers based on Huawei infrastructure.
So far, the solution only supports our switches (on Broadcom chipsets), but in the future it is planned to go beyond the ecosystem of one manufacturer. Also, when working on FabricInsight, we initially focused on open standards so that we could make friends with third-party tools normally. For example, Druid can be used to export data from FabricInsight, through which you can send information to third-party visualizers. FabricInsight is also already integrated with Grafana's open rendering tool.
In general, AIOps tools like our FabricInsight are a logical way to develop infrastructure monitoring and maintenance tools. It seems to us that this is the only way to continue to comply with SLA for services.