Experience in building infrastructure on microservice architecture

Over the past year, there have been so many publications about microservices that it would be a waste of time to tell what it is and why, so the rest of the discussion will focus on the question of how to implement this architecture and why it was faced exactly and what problems it encountered.
We had big problems in a small bank: 3 python monoliths connected by a monstrous amount of synchronous RPC interactions with a large volume of legacy. In order to at least partially solve all the problems arising at the same time, it was decided to switch to a microservice architecture. But before deciding on such a step, you need to answer 3 main questions:
- How to break a monolith into microservices and what criteria should be followed.
- How will microservices interact?
- How to monitor?
Actually brief answers to these questions will be devoted to this article.
How to break a monolith into microservices and what criteria should be followed.
This seemingly simple question ultimately determined all further architecture.
We are a bank, accordingly the whole system revolves around operations with finances and various auxiliary things. It is certainly possible to transfer financial ACID transactions to a distributed system with sagas , but in the general case it is extremely difficult. Thus we developed the following rules:
- Observe SOLID S for microservices
- The transaction must be carried out entirely in the microservice - no distributed transactions on DB damage
- To work, the microservice in needs information from its own database or from a request
- Try to ensure cleanliness (in the sense of functional languages) for microservices
Naturally, at the same time it was impossible to completely satisfy them, but even partial implementation greatly simplifies the development.
How will microservices interact?
There are many options, but in the end, all of them can be abstracted out by simple “microservices exchange messages,” but if you implement a synchronous protocol (for example, RPC via REST), then most of the disadvantages of the monolith will remain, but the advantages of microservices will hardly appear. So the obvious decision was to take any message broker and get started. Choosing between RabbitMQ and Kafka settled on the latter, and here's why:
- Kafka is simpler and provides a single messaging model - Publish – subscribe
- It is relatively easy to get data from Kafka a second time. This is extremely convenient for debugging or fixing bugs with incorrect processing, as well as for monitoring and logging.
- A clear and simple way to scale the service: added partitions to the topic, launched more subscribers - the rest will be done by kafka.
Additionally I want to draw attention to a very high-quality and detailed comparison .
Queues at kafka + asynchrony allow us to:
- Turn off any microservice for updates briefly without noticeable consequences for the rest
- Turn off any service for a long time and not bother with data recovery. For example, the fiscalization microservice recently fell. It was repaired after 2 hours, he took the raw accounts from Kafka and processed everything. It was not necessary, as before, to recover what was supposed to happen there and manually carry out HTTP logs and a separate table in the database.
- Run test versions of services on current data from the sale and compare the results of their processing with the version of the service on the sale.
As the data serialization system, we chose AVRO, why - described in a separate article .
But regardless of the serialization method chosen, it is important to understand how the protocol will be updated. Although AVRO supports Schema Resolution, we do not use this and decide purely administratively:
- Data in topics is written and read only through AVRO, the name of the topic corresponds to the name of the circuit (and Confluent has a different approach - they write the ID of the AVRO schema from the registry in high message bytes, so they can have different types of messages in one topic
- If you need to add or change data, a new scheme is created with a new topic in kafka, after which all producers switch to a new topic, and followed by subscribers
We store the AVRO circuits themselves in git submodules and connect to all kafka projects. They decided not to implement a centralized registry of schemes yet.
PS: Colleagues made the opensource option but only with JSON-schema instead of AVRO .
Some subtleties
Each subscriber receives all messages from the topic
This is the specificity of the Publish – subscribe interaction model - when subscribed to a topic, the subscriber will receive them all. As a result, if the service needs only some of the messages, it will have to filter them out. If this becomes a problem, it will be possible to create a separate service router that will lay out messages in several different topics, thereby implementing part of the RabbitMQ functionality that is not in the kafka. Now we have one subscriber on python in one thread processes about 7-5 thousand messages per second, but if you run from through PyPy, then the speed grows to 11-15 thousand / sec.
Limit the lifetime of a pointer in a topic
In the settings of the kafka there is a parameter that limits the time that the kafka "remembers" where the reader stopped - by default 2 days. It would be nice to raise it to a week, so that if the problem arises during the holidays and 2 days are not resolved, then this would not lead to a loss of position in the topic.
Read Confirmation Time Limit
If the Kafka reader does not confirm the reading in 30 seconds (a configurable parameter), then the broker believes that something went wrong and an error occurs when trying to confirm the reading. To avoid this, when processing a message for a long time, we send read confirmations without moving the pointer.
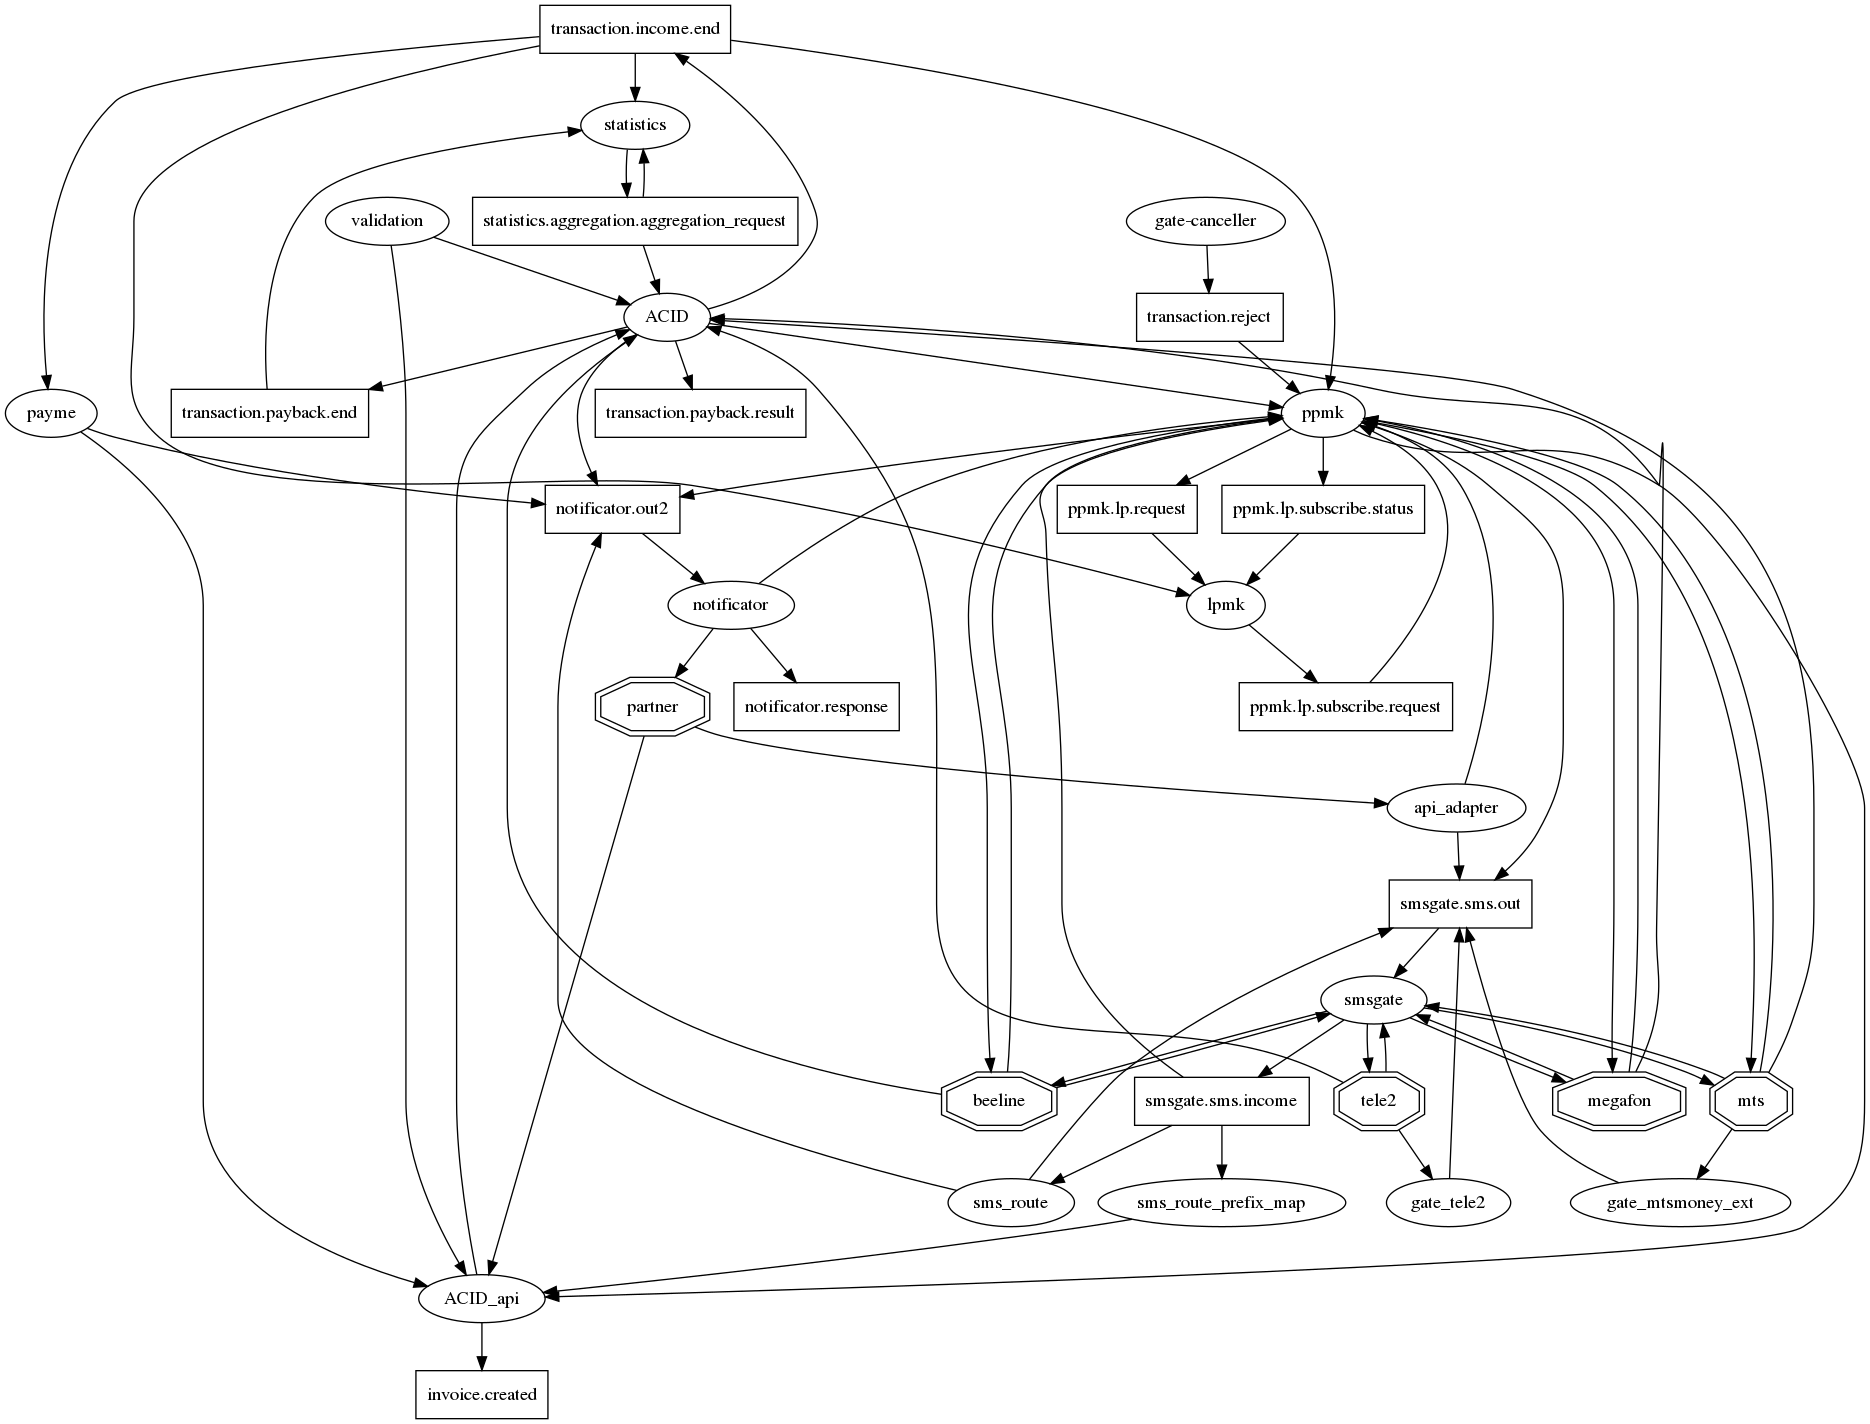
The graph of connections is difficult to understand.
If you honestly draw all the relationships in graphviz, then a hedgehog of the apocalypse, which is traditional for microservices, with dozens of connections in one node. To at least somehow make it (the graph of connections) readable, we agreed on the following notation: microservices - ovals, topics of kafka - rectangles. Thus, on the same graph, it is possible to display both the fact of interaction and its type. But, alas, it is not getting much better. So this question is still open.

How to monitor?
Even as part of the monolith, we had logs in files and Sentry. But as we switched to interaction through Kafka and deployed to k8s, the logs moved to ElasticSearch and, accordingly, were first monitored by reading the subscriber’s logs in Elastic. No logs - no work.
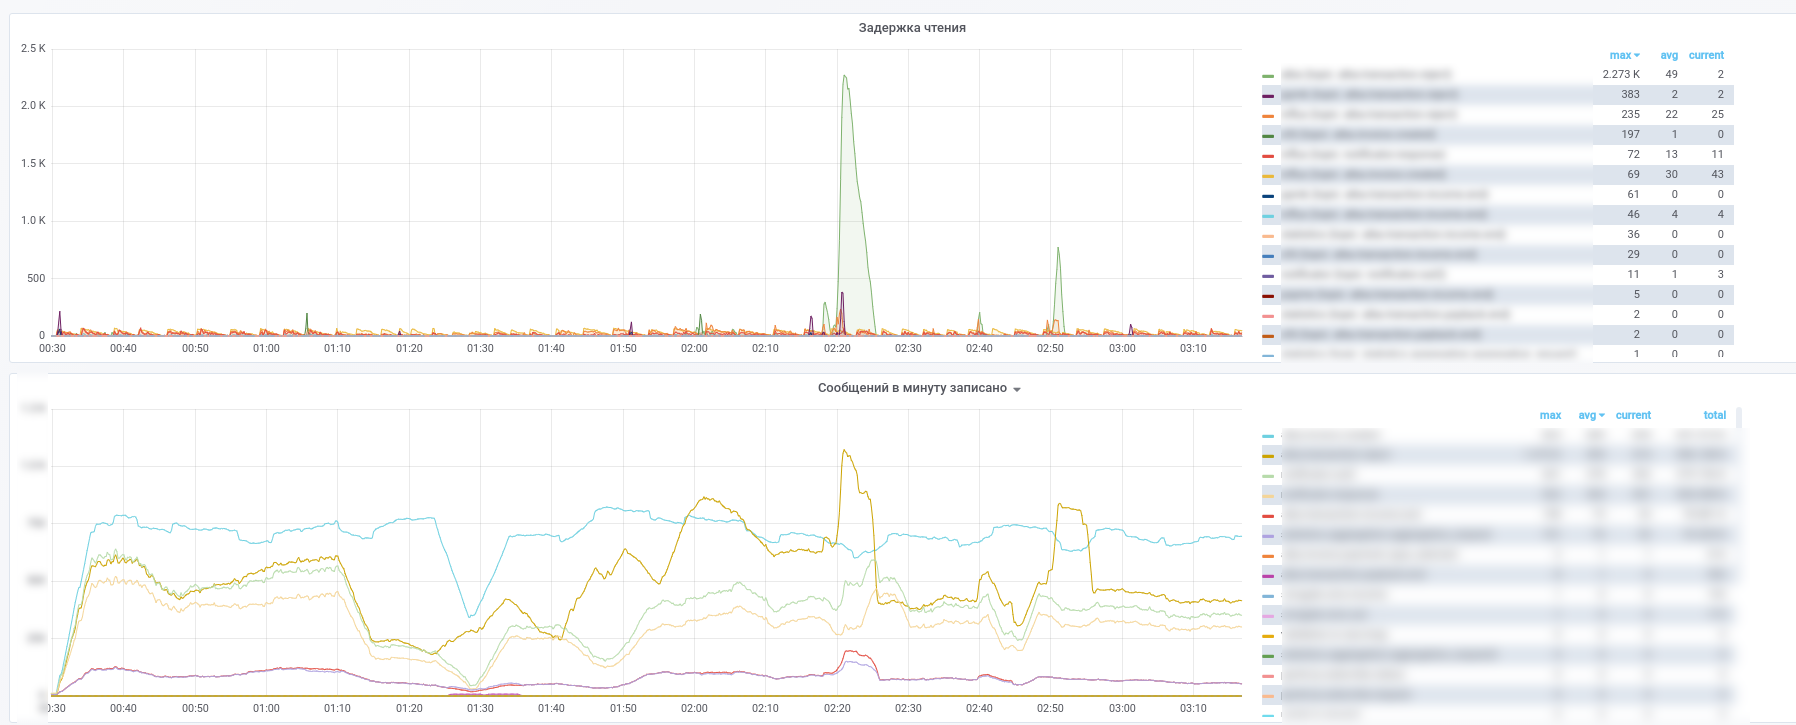
After that, they started using Prometheus and kafka-exporter slightly modified its dashboard: https://github.com/kkirsanov/articles/blob/master/2019-habr-kafka/dashboard.json
As a result, we get these pictures: 
You can see which service has stopped processing which messages.
Additionally, all messages from key (payment transactions, notifications from partners, etc.) topics are copied to InfluxDB, wound up in the same grafana. So we can not only record the fact of message passing, but also make various samples according to the content. So the answers to questions like “what is the average delay time for a response from a service” or “Is the transaction flow very different today from yesterday in this store” is always at hand.
Also, to simplify the analysis of incidents, we use the following approach: each service, when processing a message, supplements it with meta-information containing the UUID issued when the system displays an array of records of the type:
- service name
- UUID of the processing process in this microservice
- process start timestamp
- process time
- tag set
As a result, as the message passes through the computational graph, the message is enriched with information about the path traveled on the graph. It turns out an analogue of zipkin / opentracing for MQ, which allows receiving a message to easily restore its path on the graph. This is of particular value in cases where cycles occur on the graph. Remember the example of a small service, the share in the payments of which is only 0.0001%. By analyzing the meta-information in the message, he can determine whether they were the initiator of the payment without contacting the database for verification.
