Latency numbers on iPhone
Latency Numbers Every Programmer Should Know - a table of "delays that every programmer should know." It contains the average values of time for performing basic computer operations in 2012. There are several alternative views for this table, and here is one of them.
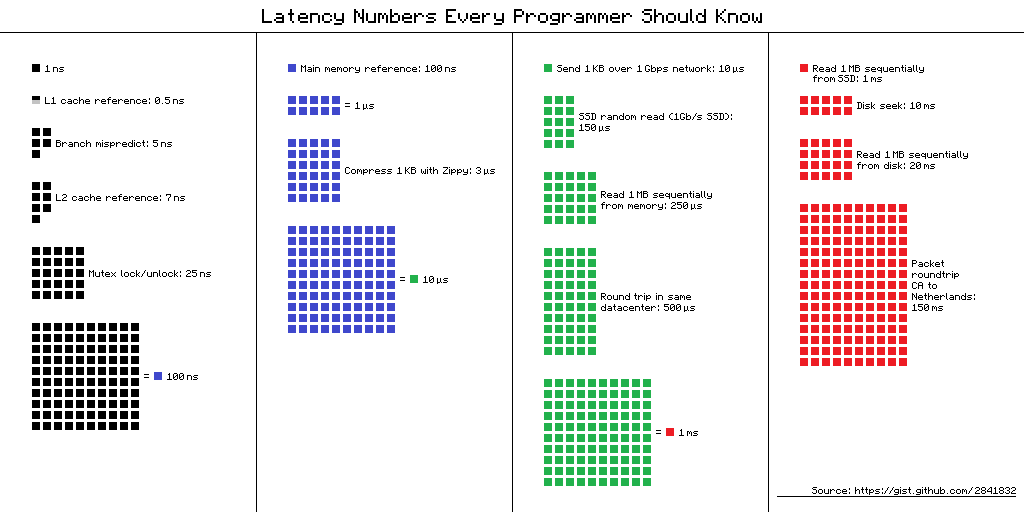
Link to the source of the scheme
But what is the benefit for mobile developers of this information in 2019? It seems that no, but Dmitry Kurkin ( SClown ) from the Yandex.Navigator team thought: “What would the table look like for a modern iPhone?” What came of it, in a revised text version of Dmitry’s report on AppsConf .
Why should programmers know these numbers? And are they relevant for mobile developers? There are two main tasks that can be solved with the help of these numbers.
Take a simple situation - a telephone conversation. We can easily tell when this process is fast and when it is long: a couple of seconds is very fast, a few minutes is an average conversation, and an hour or more is very long. With pages loading, it is similar: in less than a second - quickly, a few seconds - bearable, and a minute is a disaster, the user may not wait for the download.
But what about operations such as adding a number to an array - the very “quick insert” that people sometimes like to talk about in interviews? How much does it take on a smartphone? Nanoseconds, microseconds or milliseconds? I have met few people who could say that 1 millisecond is a long time, but in our case it is so.
The execution time of operations on various devices can vary by tens or hundreds of times. For example, the access time to the main memory is 100 times different from accessing the L1 cache. This is a big difference, but not infinite. If we have specific meaning for this, then when optimizing our applications we can evaluate whether there will be a time gain or not.

When I saw these numbers, I became interested in the difference between cache and memory access. If I carefully put my data in 64 Kbytes, which is not so small, then my code will work 100 times faster - it's fast, everything will fly!

I immediately wanted to check it all out, show it to my colleagues, and apply it wherever possible. I decided to start with the standard tool that Apple offers - XCTest with measureBlock. The test organized as follows: allocated an array, filled it with numbers, their XOR'il and repeated the algorithm 10 times, for sure. After that, I looked at how much time it takes for one element.
The size of the buffer increased 100 times, and the time for the operation not only did not increase 100 times, but decreased almost 2 times. Gentlemen, officers, they betrayed us ?!
After such a result, big doubts crept in me that these numbers can be seen in real life. It may not be possible for a regular application to sense this difference. Or maybe on the mobile platform everything is different.
I began to look for a way to see the difference in performance between caches and main memory. During the search, I came across an article where the author complained that he had a benchmark running on his Mac and iPhone and did not show these delays. I took this tool and got the result - just like in a pharmacy. The memory access time increased quite clearly when the buffer size exceeded the size of the corresponding cache.
LMbench helped me get these results . This is a benchmark created by Larry McVoy, one of the developers of the Linux kernel, which allows you to measure memory access time, thread switching costs and file system operations, and even the time that the main processor operations take: addition, subtraction, etc. According to this benchmark Texas Instruments presented interesting measurement data for its processors. LMBench is written in C, so it was not difficult to run it on iOS.
Armed with such a wonderful tool, I decided to make similar measurements, but for an actual mobile device - for the iPhone. The main measurements were made on the 5S, and then I got the results as other devices fell into my hands. Therefore, if the device is not specified, then it is 5S.
For this test, a special array is used, which is filled with elements that reference each other. Each of the elements is a pointer to another element. The array is not traversed by index, but by transitions from one node to another. These elements are scattered across the array so that, when accessing a new element, as often as possible it was not in the cache, but unloaded from RAM. This arrangement interferes with caches as much as possible.
You have already seen the preliminary result. In the case of L1 cache, it is less than 10 nanoseconds, for L2 it is a couple of tens of nanoseconds, and in the case of main memory, the time rises to hundreds of nanoseconds.
Three main operations are measured:
When working with the buffer, 2 approaches are used: in the first case, only every fourth element is used, and in the second, all elements are sequentially.
The highest speed is obtained with a small buffer size, and then there are clear steps, according to the sizes of L1 and L2 caches. The most interesting thing is that when data is read sequentially, no speed reduction occurs. But in the case of passes, clear steps are visible.
During sequential reading, the OS manages to load the necessary data into the cache, so for any buffer size I do not need to access the memory - all the necessary data is obtained from the cache. This explains why I did not see the time difference in my basic test.
The results of measurements of read and write operations showed that in a normal application it is quite difficult to obtain the estimated acceleration of 100 times. On the one hand, the system itself caches data quite well, and even with large arrays we are very likely to find data in the cache. And on the other hand, working with various variables can easily require access to memory and the loss of hundreds of nanoseconds won.
Next, I wanted to get similar data for working with threads in order to understand the cost of using multithreading : how much does it cost to create a thread and switch from one thread to another. For us, these are frequent operations, and I want to understand the loss.
System Trace helps a lot to track the work of threads in the application. This tool was described in some detail at WWDC 2016 . The tool helps to see transitions by stream conditions and presents data on streams in three main categories: system calls, working with memory and stream conditions.
The first test is the execution of a task in a new thread . We create a thread with a certain procedure and wait for it to complete its work. Comparing the total time with the time for the procedure itself, we get the total loss to start the procedure in a new thread.
In System Trace you can clearly see how everything really happens:
As a result, creating a stream requires quite significant costs: iPhone 5S - 230 microseconds, 6S - 50 microseconds. The completion of the stream takes almost 2 times more time than the creation , join also takes a tangible time. When working with memory, we got hundreds of nanoseconds, which is 100 times less than tens of microseconds.
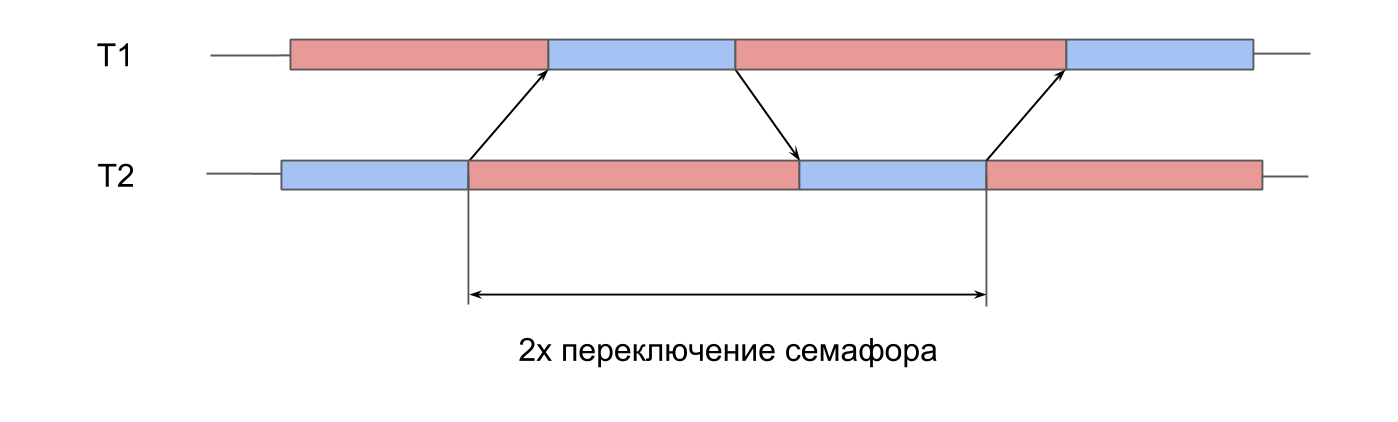
The next test is measurements on the work of the semaphore . We have 2 pre-created threads, and for each of them there is a semaphore. Streams alternately signal the semaphore of the neighbor and wait for their own. Passing signals to each other, streams play ping-pong, revive each other. This double iteration gives double semaphore switching time.
In System Trace, everything looks similar:
The switching time was within 10 microseconds. The difference with creating a thread by 50 times is exactly the reason why thread pools are created, and not a new thread for each procedure.
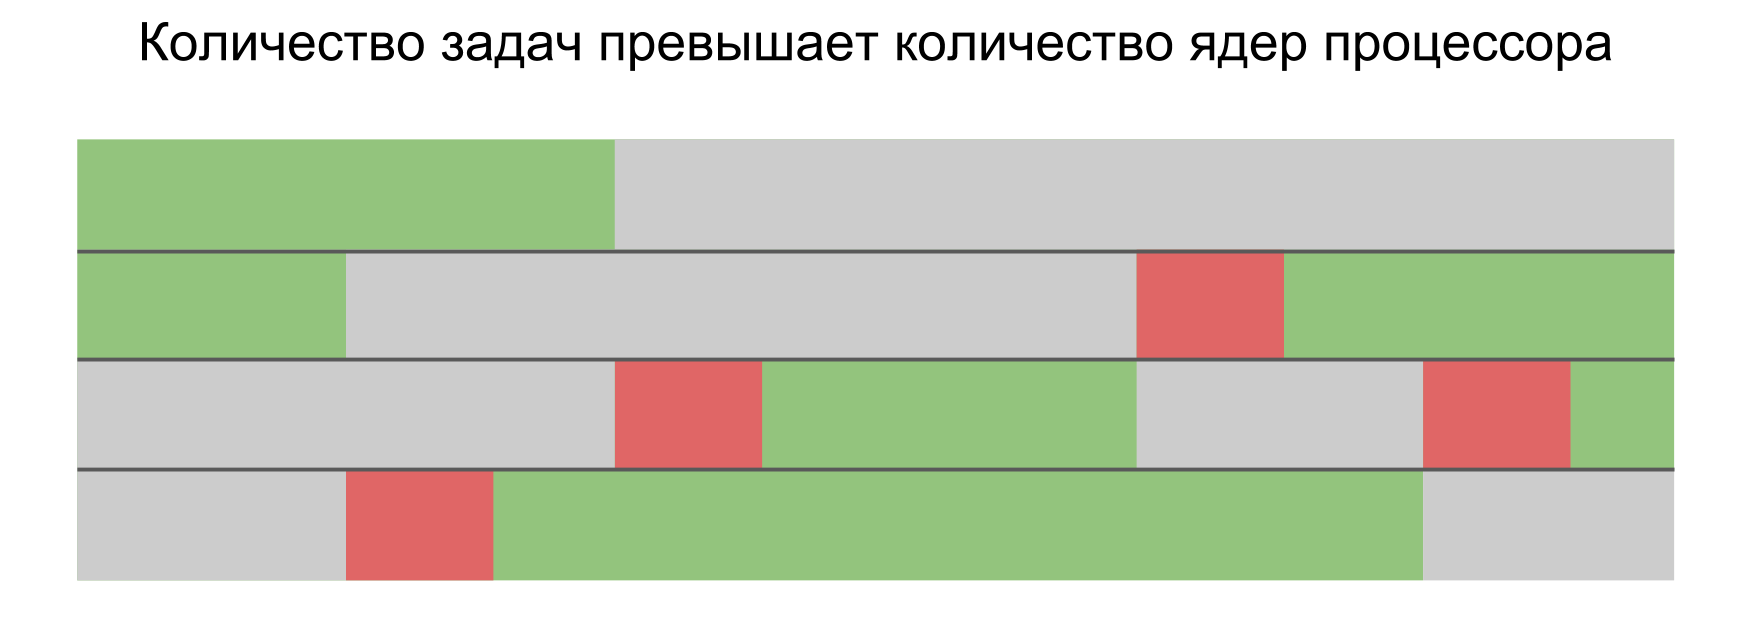
In the previous two tests, the transfer of control between threads was completely controlled - we clearly understood where and where the transition should occur. However, it often happens that the system itself switches from one thread to another. When we run more tasks in parallel than the cores in the device, the operating system must be able to switch itself to provide everyone with processor time.
In this test, I wanted to measure the loss of starting too many threads. To do this, a pool of 16 threads is created, each of which waits for a semaphore, and, as soon as it receives a signal, performs a certain procedure and signals the semaphore back. The main thread starts the entire pool, giving 16 signals, and after that it waits 16 signals in response.
In System Trace you can see that the blocks are scattered randomly, some of them are much longer than the rest. If multiple switching leads to an increase in the execution time of the operation, then the average execution time should increase as a result.
However, with an increase in the number of threads, the average operation time does not increase.
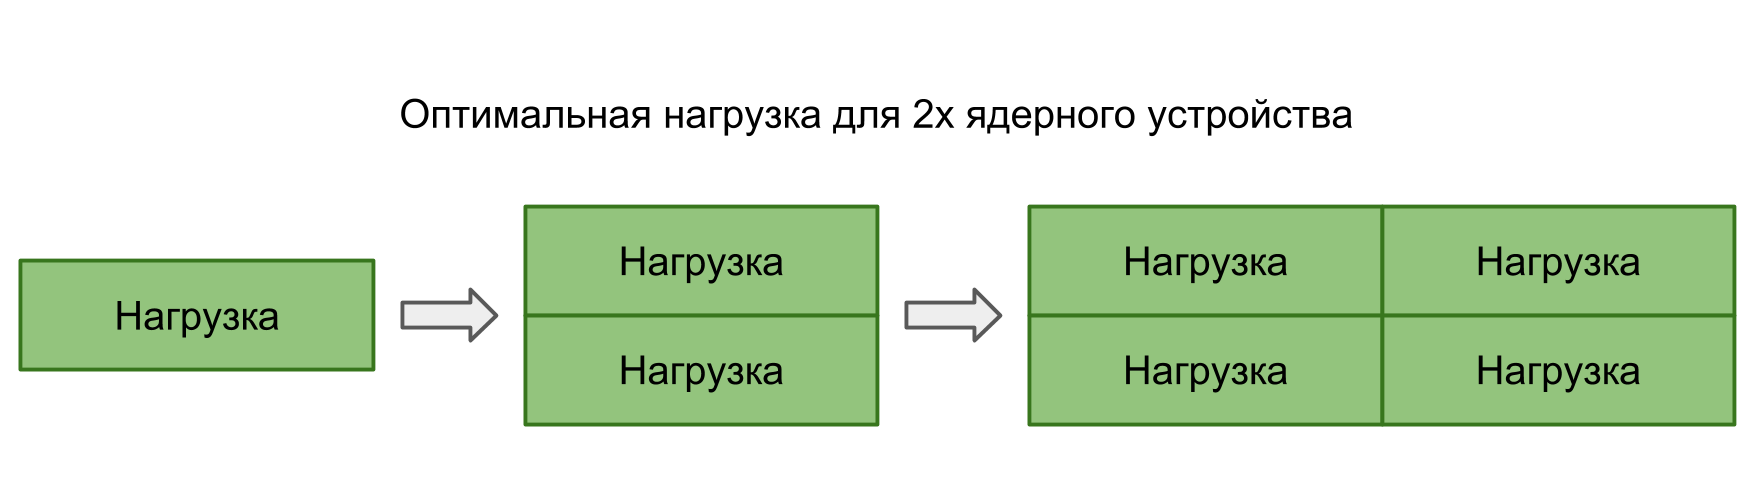
In theory, the average time should be kept as long as the load corresponds to the processing power. That is, the number of tasks corresponds to the number of cores.
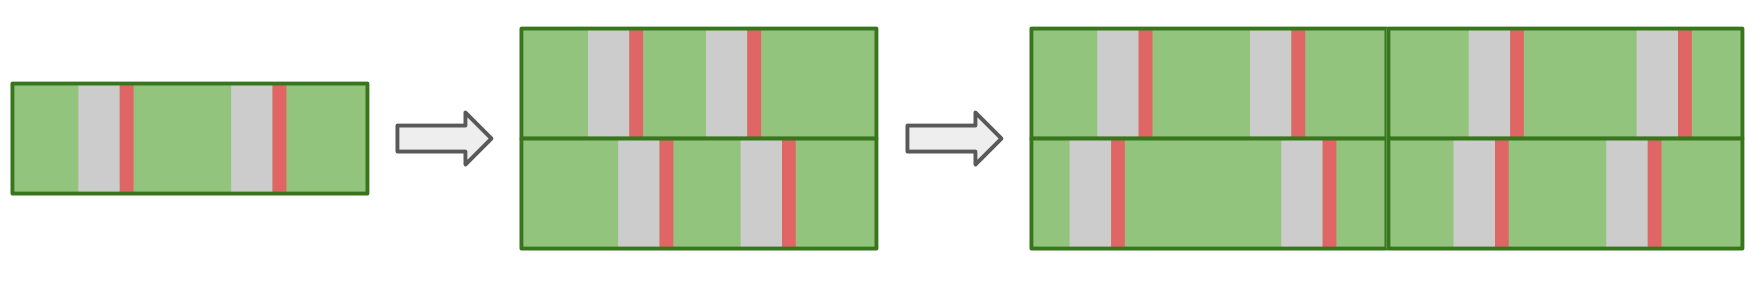
If you run many tasks in parallel, then the OS, switching from one task to another, will introduce additional delays. This should be reflected in the result.
In practice, not only our application works on the device, but it still has many parallel and system processes. Even the only thread in our application will be affected by switching, which leads to interruptions and delays. Therefore, in all situations there are delays, and there is no difference whether to build tasks in series or run in parallel.
Below is our Latency Numbers table with data on flows and semaphore.
We already have memory and threads - for completeness we only need file system operations.
The first test is reading speed - how much does it cost to read a file. The test consists of two parts. In the first, we measure the reading speed taking into account the opening, reading, and closing of the file. In the second, we assume that the file is constantly open : we position ourselves somewhere and read as much as we want.
The results are correctly viewed from two points of view. When the file is small, there is some minimal time to read data from a file. Up to one kilobyte is 5.3 microseconds - it doesn’t matter: 1 byte, 2 or 1 KB - for all 5.3 μs. Therefore, you can talk about speed only in the case of large files, when the fixed time can already be neglected. The operation to open and close the file takes approximately the same time for any file size - in the case of 5S, about 50 microseconds.
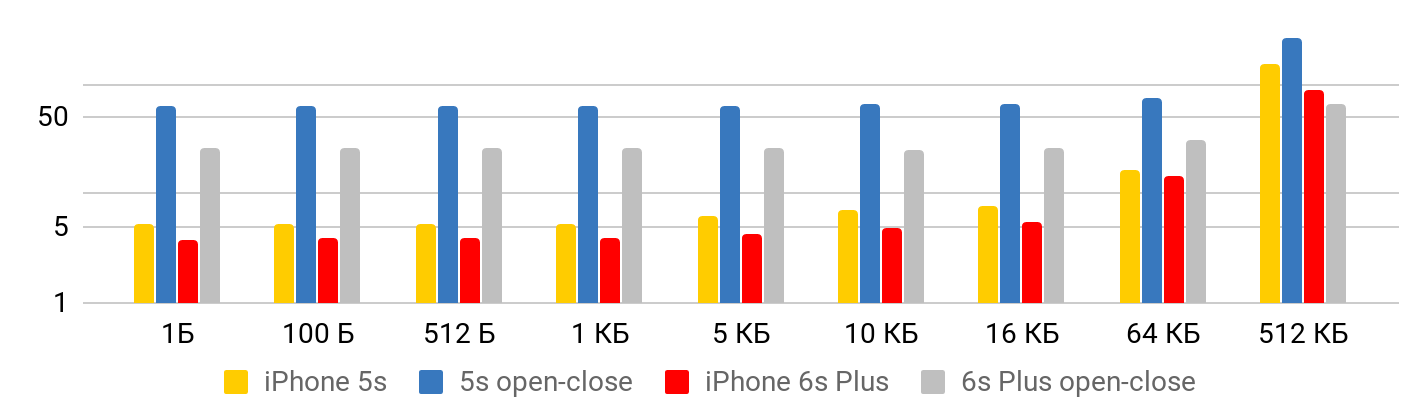
For reading speed, such graphs are obtained.
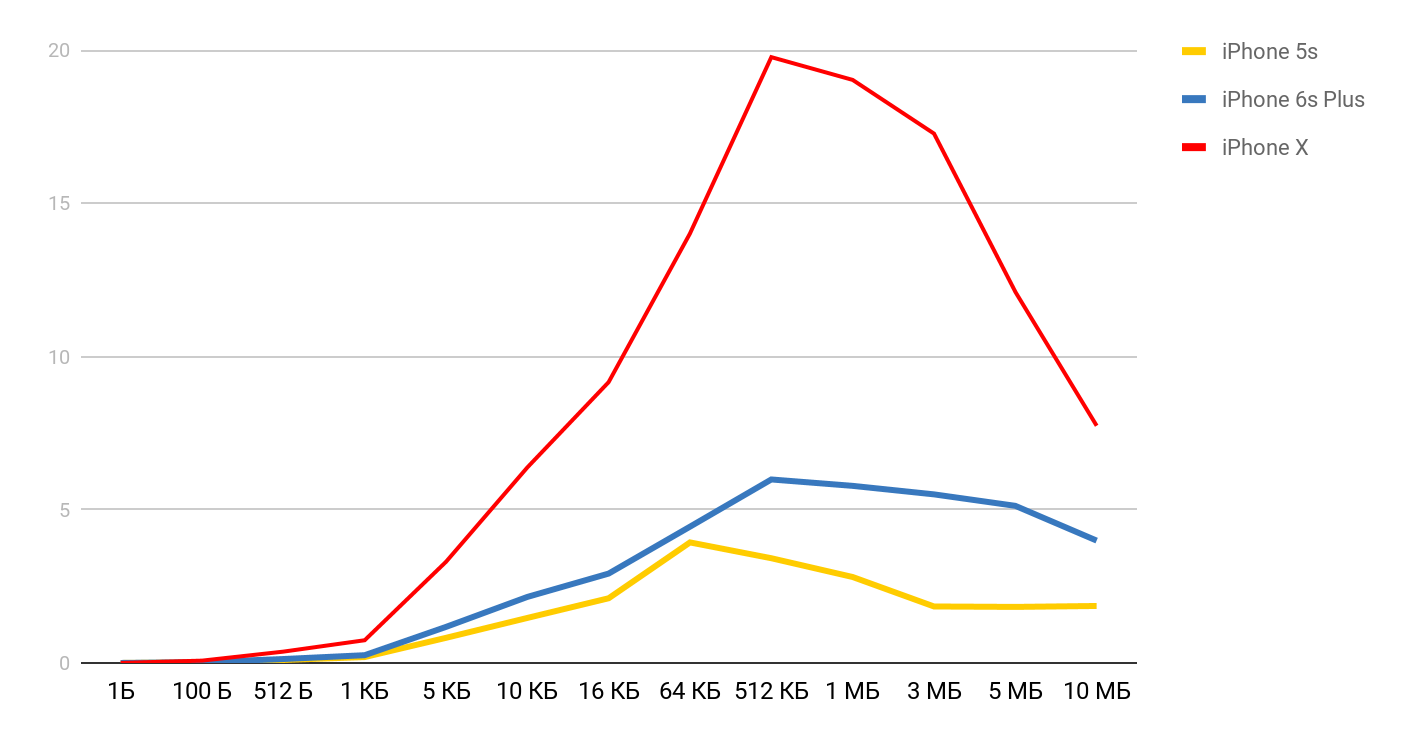
For iPhone X and a file of 1 MB, the speed can reach 20 MB / s. Interestingly, reading a 1 MB file is more efficient. With large file sizes, the cache sizes seem to be affected. That is why the speed drops further and evens out in the region of 10 Mb.
The test consists of the step of creating a file and writing data , and deleting the created files. The result is stepwise: on small sizes, the time is stable - about 7 μs, and further growing. The scale is logarithmic.
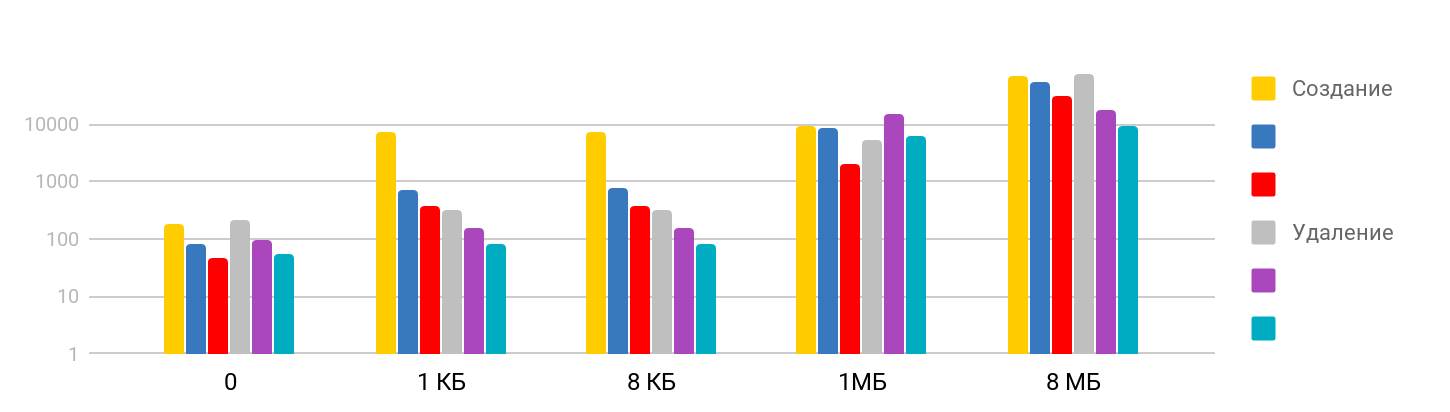
I was surprised that the time it takes to delete a large file is commensurate with the time it took to create, as I assumed that deleting is a quick operation. It turns out no, for iPhone, deleting in time is comparable to creating a file. The summary table looks like this.
Based on these measurements, we now have an idea of how much time the basic iOS operations require: accessing memory is nanoseconds, working with files is microseconds, creating a stream is tens of microseconds, and switching is only a few microseconds.
To get a physically noticeable hang in the application, the execution time of the procedure must exceed 15 milliseconds (the time it takes to update the screen at 60fps). This is almost a thousand times larger than most measurements taken in the article. On such a scale, a millisecond is quite a lot, and a second is already "forever."
Tests showed that despite the large difference in the time access to memory and caches, directly using this ratio is quite difficult. Before compiling all your data under L1, you need to make sure that in your case it really will give a result.
According to the tests of operations with threads, we were able to make sure that creating and destroying threads requires a considerable amount of time, but performing a large number of parallel operations does not bring additional costs.
Well, in conclusion, I would like to remind you the most important rule when working on performance - first measurements and only then optimization !
Profile speaker Dmitry Kurkin on GitHub .
Link to the source of the scheme
But what is the benefit for mobile developers of this information in 2019? It seems that no, but Dmitry Kurkin ( SClown ) from the Yandex.Navigator team thought: “What would the table look like for a modern iPhone?” What came of it, in a revised text version of Dmitry’s report on AppsConf .
What is it for?
Why should programmers know these numbers? And are they relevant for mobile developers? There are two main tasks that can be solved with the help of these numbers.
Understanding the Time Scale of a Computer
Take a simple situation - a telephone conversation. We can easily tell when this process is fast and when it is long: a couple of seconds is very fast, a few minutes is an average conversation, and an hour or more is very long. With pages loading, it is similar: in less than a second - quickly, a few seconds - bearable, and a minute is a disaster, the user may not wait for the download.
But what about operations such as adding a number to an array - the very “quick insert” that people sometimes like to talk about in interviews? How much does it take on a smartphone? Nanoseconds, microseconds or milliseconds? I have met few people who could say that 1 millisecond is a long time, but in our case it is so.
The ratio of the speed of various computer components
The execution time of operations on various devices can vary by tens or hundreds of times. For example, the access time to the main memory is 100 times different from accessing the L1 cache. This is a big difference, but not infinite. If we have specific meaning for this, then when optimizing our applications we can evaluate whether there will be a time gain or not.
"Latency numbers" in real life
When I saw these numbers, I became interested in the difference between cache and memory access. If I carefully put my data in 64 Kbytes, which is not so small, then my code will work 100 times faster - it's fast, everything will fly!
I immediately wanted to check it all out, show it to my colleagues, and apply it wherever possible. I decided to start with the standard tool that Apple offers - XCTest with measureBlock. The test organized as follows: allocated an array, filled it with numbers, their XOR'il and repeated the algorithm 10 times, for sure. After that, I looked at how much time it takes for one element.
| Buffer size | Total time | Time for surgery |
| 50 kb | 1.5 ms | 30 ns |
| 500 kb | 12 ms | 24 ns |
| 5000 kb | 85 ms | 17 ns |
The size of the buffer increased 100 times, and the time for the operation not only did not increase 100 times, but decreased almost 2 times. Gentlemen, officers, they betrayed us ?!
After such a result, big doubts crept in me that these numbers can be seen in real life. It may not be possible for a regular application to sense this difference. Or maybe on the mobile platform everything is different.
I began to look for a way to see the difference in performance between caches and main memory. During the search, I came across an article where the author complained that he had a benchmark running on his Mac and iPhone and did not show these delays. I took this tool and got the result - just like in a pharmacy. The memory access time increased quite clearly when the buffer size exceeded the size of the corresponding cache.
LMbench helped me get these results . This is a benchmark created by Larry McVoy, one of the developers of the Linux kernel, which allows you to measure memory access time, thread switching costs and file system operations, and even the time that the main processor operations take: addition, subtraction, etc. According to this benchmark Texas Instruments presented interesting measurement data for its processors. LMBench is written in C, so it was not difficult to run it on iOS.
Memory Costs
Armed with such a wonderful tool, I decided to make similar measurements, but for an actual mobile device - for the iPhone. The main measurements were made on the 5S, and then I got the results as other devices fell into my hands. Therefore, if the device is not specified, then it is 5S.
Memory access
For this test, a special array is used, which is filled with elements that reference each other. Each of the elements is a pointer to another element. The array is not traversed by index, but by transitions from one node to another. These elements are scattered across the array so that, when accessing a new element, as often as possible it was not in the cache, but unloaded from RAM. This arrangement interferes with caches as much as possible.
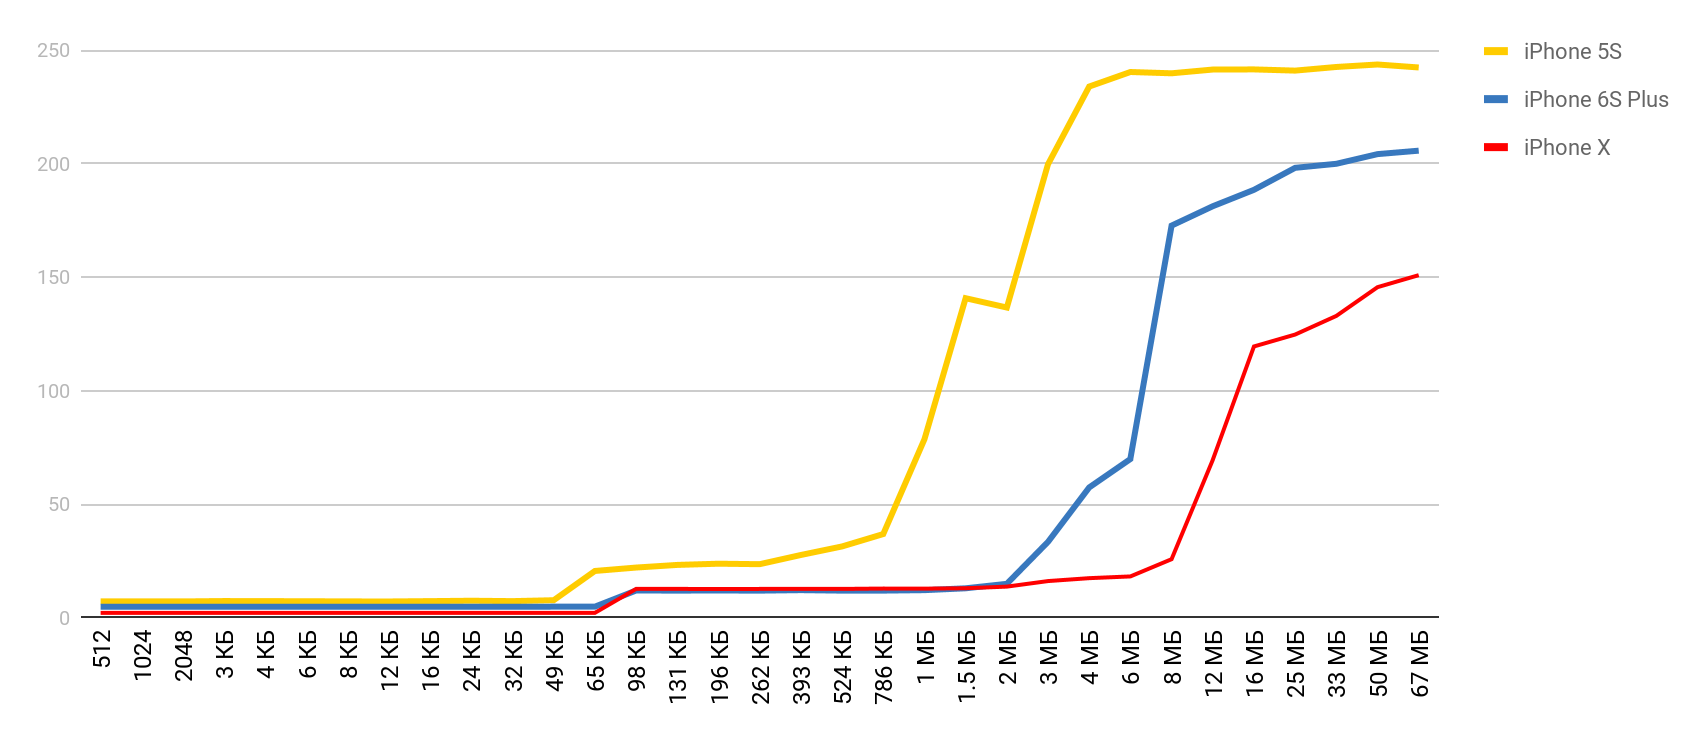
You have already seen the preliminary result. In the case of L1 cache, it is less than 10 nanoseconds, for L2 it is a couple of tens of nanoseconds, and in the case of main memory, the time rises to hundreds of nanoseconds.
Read and write speed
Three main operations are measured:
- reading ( p [i] + ) - we read the elements and add them to the total amount;
- record ( p [i] = 1 ) - a constant number is written in each element;
- reading and writing ( p [i] = p [i] * 2 ) - we take out the element, change it and write the new value back.
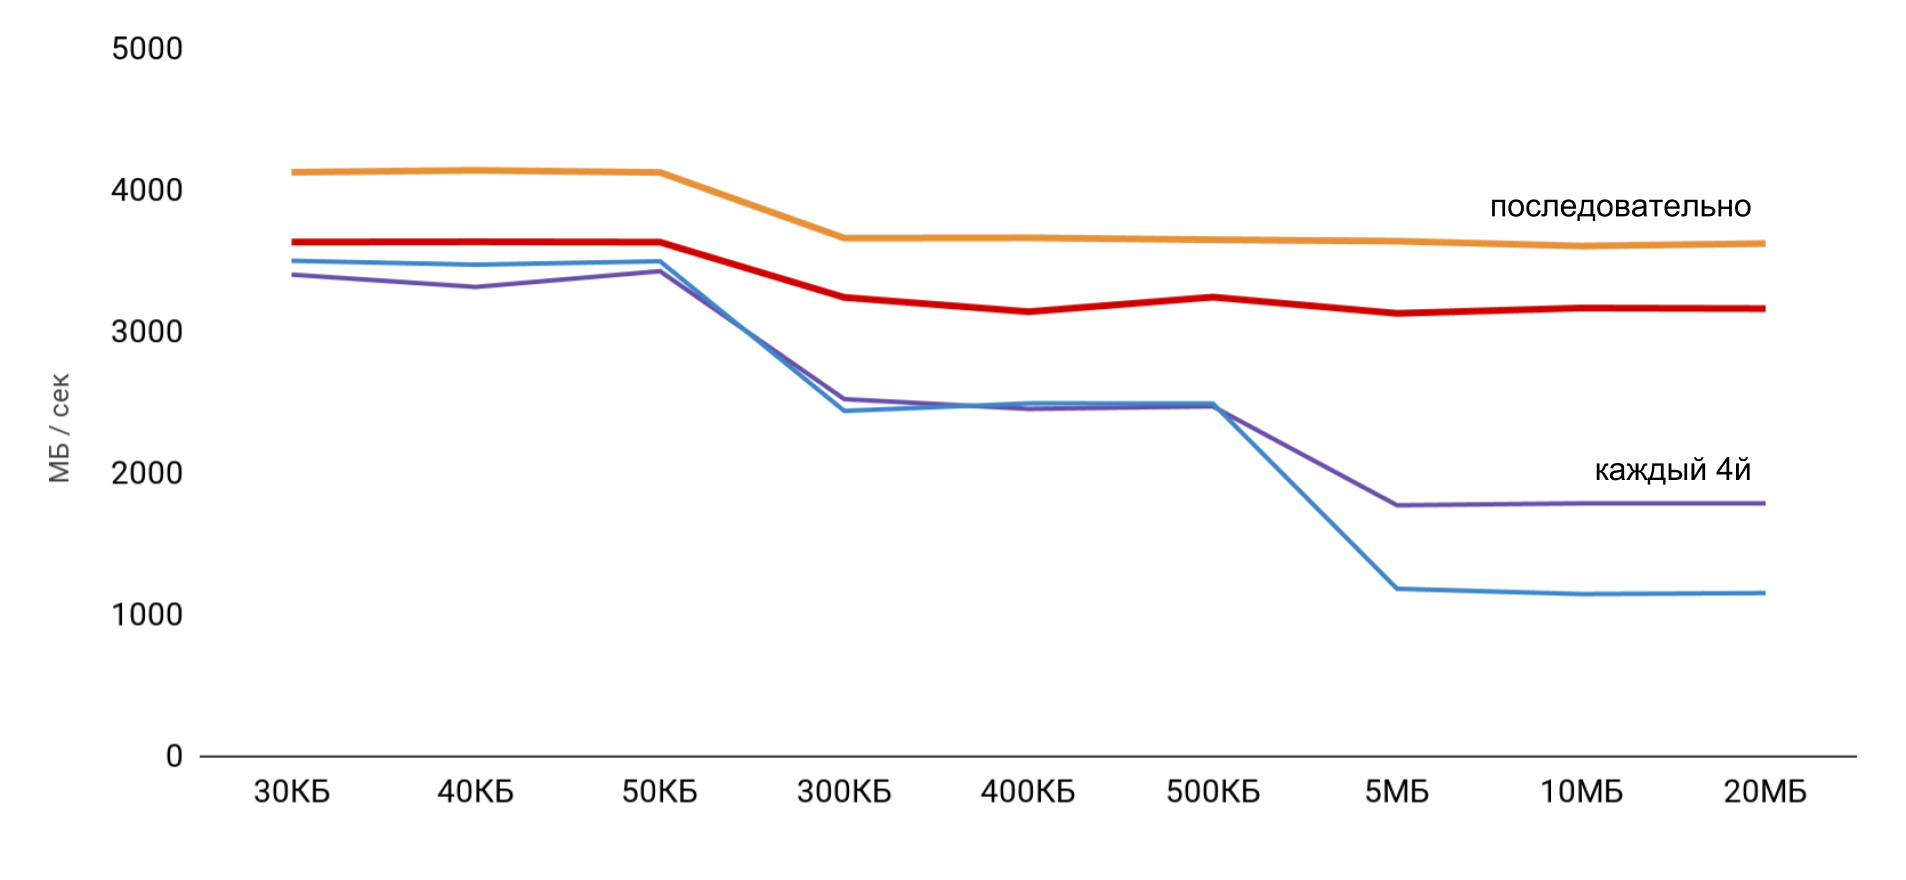
When working with the buffer, 2 approaches are used: in the first case, only every fourth element is used, and in the second, all elements are sequentially.
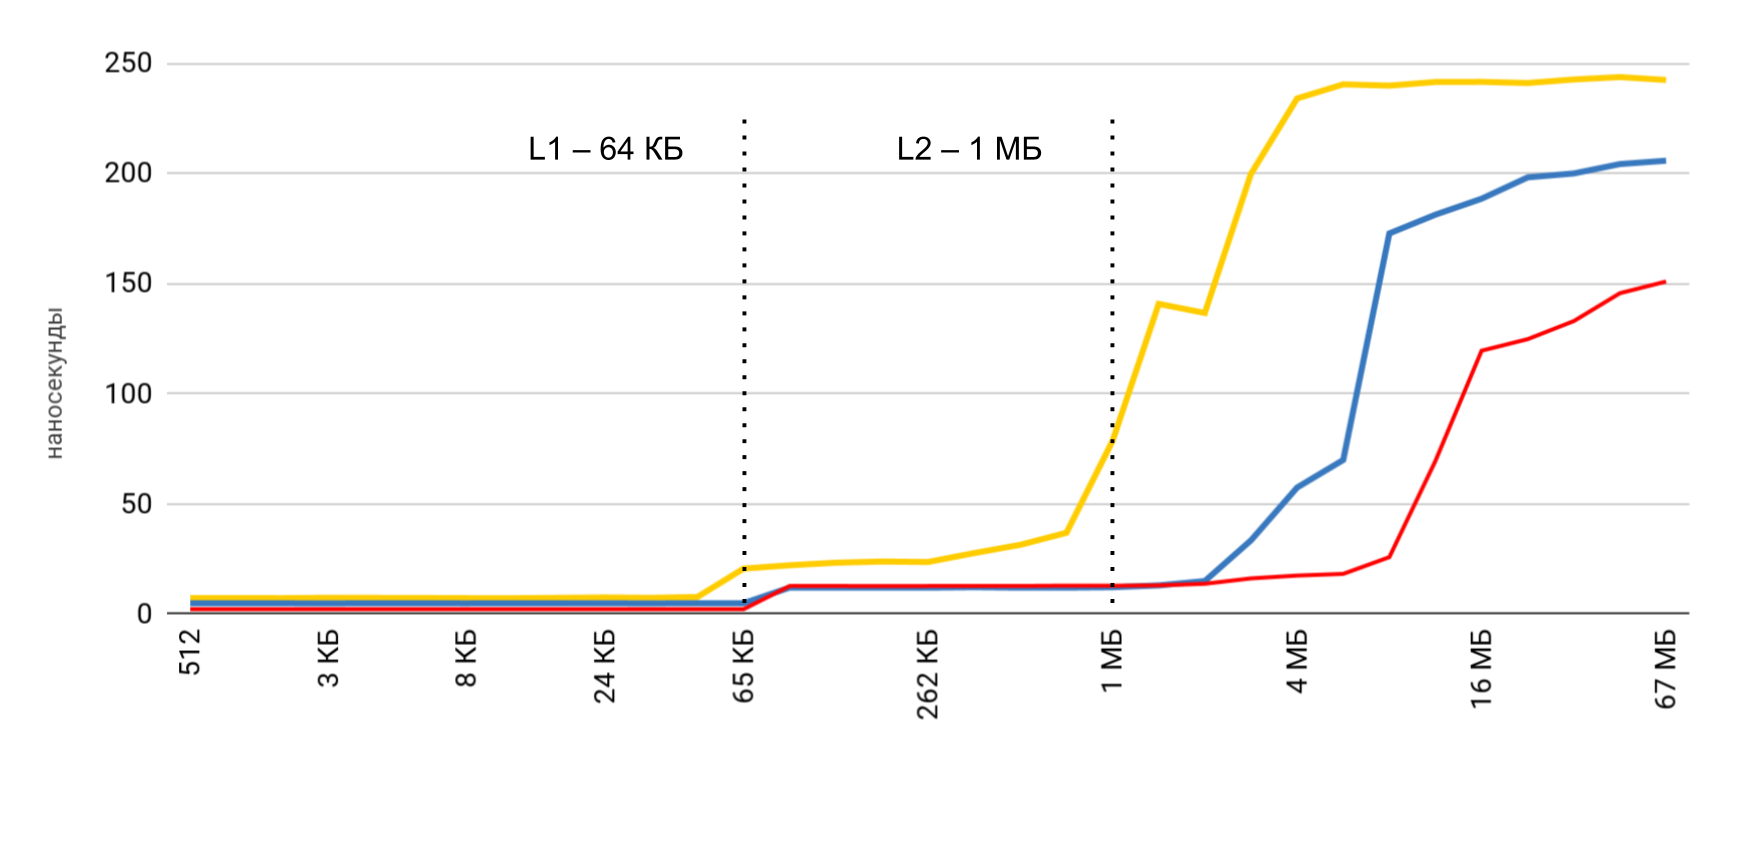
The highest speed is obtained with a small buffer size, and then there are clear steps, according to the sizes of L1 and L2 caches. The most interesting thing is that when data is read sequentially, no speed reduction occurs. But in the case of passes, clear steps are visible.
During sequential reading, the OS manages to load the necessary data into the cache, so for any buffer size I do not need to access the memory - all the necessary data is obtained from the cache. This explains why I did not see the time difference in my basic test.
The results of measurements of read and write operations showed that in a normal application it is quite difficult to obtain the estimated acceleration of 100 times. On the one hand, the system itself caches data quite well, and even with large arrays we are very likely to find data in the cache. And on the other hand, working with various variables can easily require access to memory and the loss of hundreds of nanoseconds won.
| L1 | L2 | Memory | |
| Latency numbers | 1 ns | 7 ns | 100 ns |
| iPhone 5s | 7 ns | 30 ns | 240 ns |
| iPhone 6s Plus | 5 ns | 12 ns | 200 ns |
| iPhone X | 2 ns | 12 ns | 146 ns |
Threading Costs
Next, I wanted to get similar data for working with threads in order to understand the cost of using multithreading : how much does it cost to create a thread and switch from one thread to another. For us, these are frequent operations, and I want to understand the loss.
Instruments. System trace
System Trace helps a lot to track the work of threads in the application. This tool was described in some detail at WWDC 2016 . The tool helps to see transitions by stream conditions and presents data on streams in three main categories: system calls, working with memory and stream conditions.
- System calls . They are presented in the form of red "sausages". When you point them, you can see the name of the system method and the duration of the execution. Often in application applications, such a system call does not occur directly: we use something, which in turn already calls the system method. You should not rely on the fact that here the methods from your code will be visible.
- Memory operations . They are presented in the form of blue "sausages". This includes operations such as memory allocation, freeing, zeroing, etc.
- The state of the stream . Blue color - a thread is running, some processor is executing code from this thread. Gray - the thread is blocked for some reason and cannot continue execution. Red - the thread is ready to work, but at this moment there is no free kernel to execute its code. Orange color - the flow is interrupted for higher priority work.
- Points of interest . These are special labels that can be arranged by code using a call
kdebug_signpost. Labels can be single (a specific place in the code) or as a range (to highlight the whole procedure). Using such labels, it is much easier to correlate microseconds and system calls with your application.
Stream creation costs
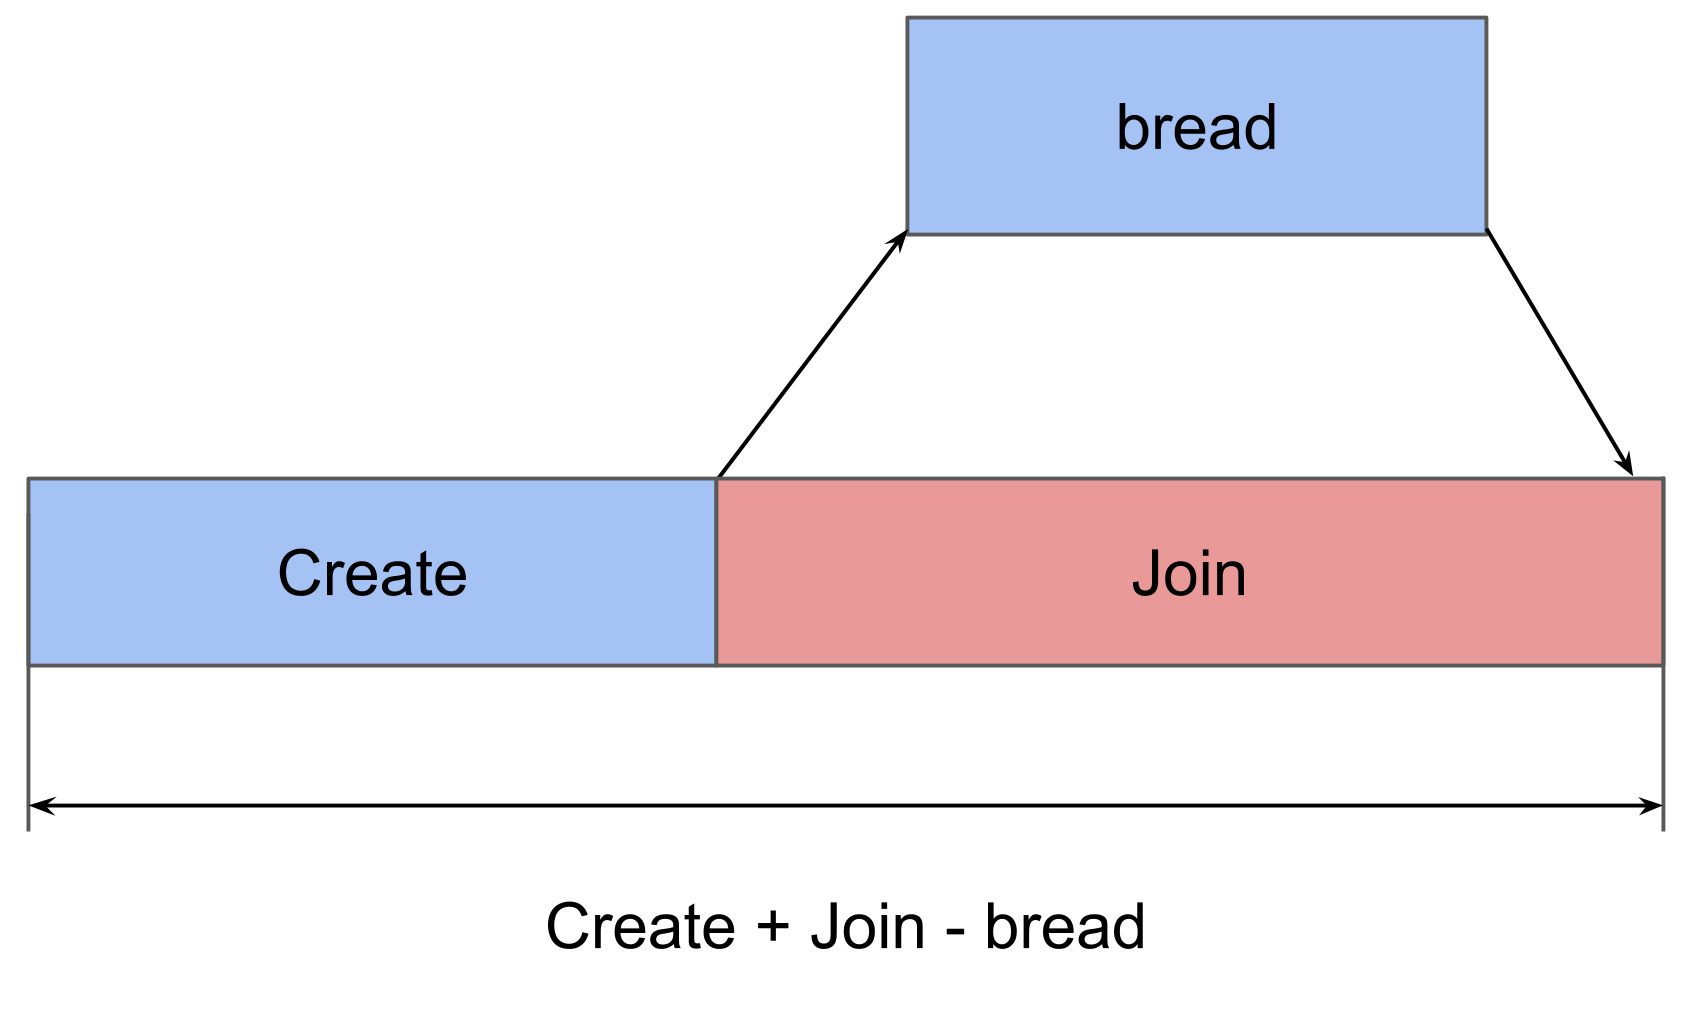
The first test is the execution of a task in a new thread . We create a thread with a certain procedure and wait for it to complete its work. Comparing the total time with the time for the procedure itself, we get the total loss to start the procedure in a new thread.
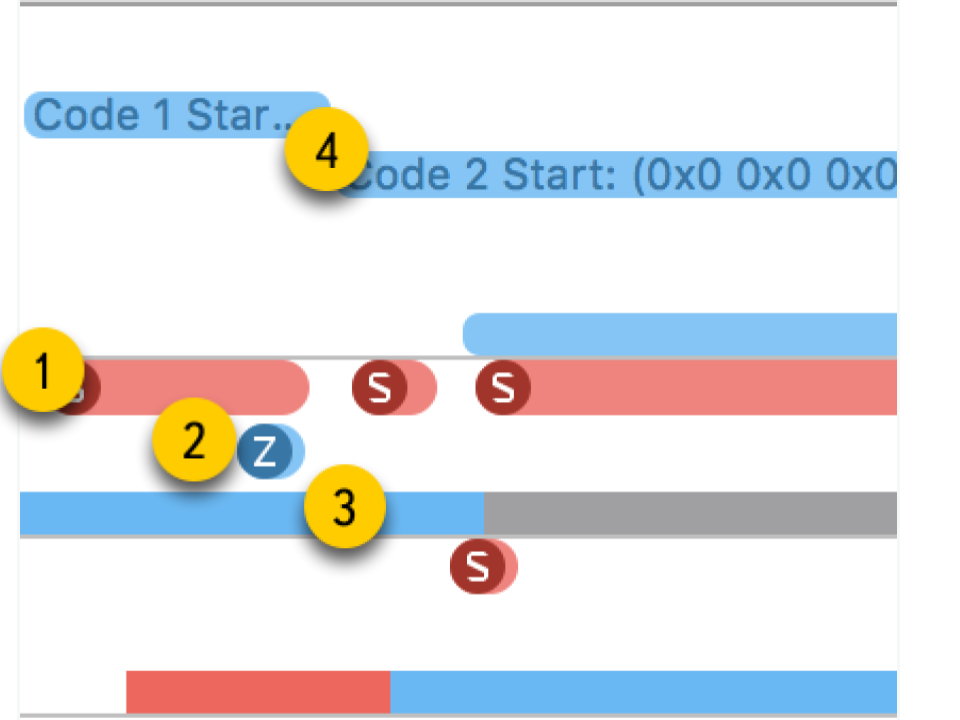
In System Trace you can clearly see how everything really happens:
- Create stream.
- The new thread in which our procedure runs. The red zone at the beginning says that the thread was created, but for some time it could not be executed, since there was no free core.
- The completion of the stream. Interestingly, the thread completion procedure itself is even larger than its creation. Although it seems that deleting is always faster.
- Waiting for the completion of the procedure, which was in the original scheme, and it ends after the stream ends - for a while the method realizes this and, after that, reports. This time is slightly longer than the completion of the stream.
As a result, creating a stream requires quite significant costs: iPhone 5S - 230 microseconds, 6S - 50 microseconds. The completion of the stream takes almost 2 times more time than the creation , join also takes a tangible time. When working with memory, we got hundreds of nanoseconds, which is 100 times less than tens of microseconds.
| overhead | create | end | join | |
| iPhone 5s | 230 μs | 40 μs | 70 μs | 30 μs |
| iPhone 6s Plus | 50 μs | 12 μs | 20 μs | 7 μs |
Semaphore switching time
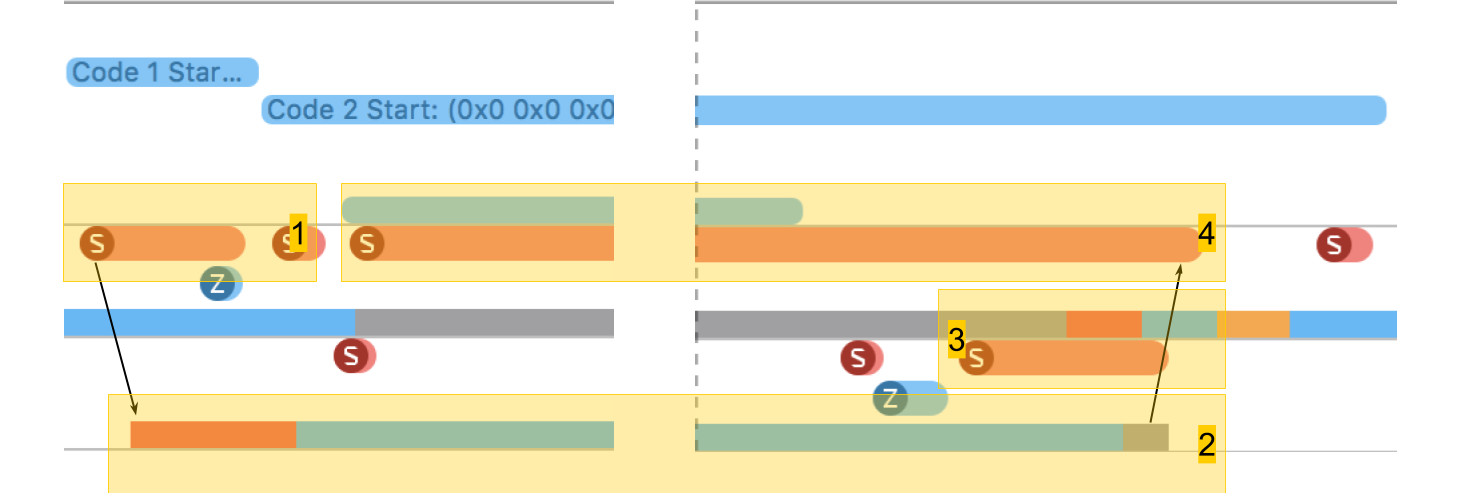
The next test is measurements on the work of the semaphore . We have 2 pre-created threads, and for each of them there is a semaphore. Streams alternately signal the semaphore of the neighbor and wait for their own. Passing signals to each other, streams play ping-pong, revive each other. This double iteration gives double semaphore switching time.
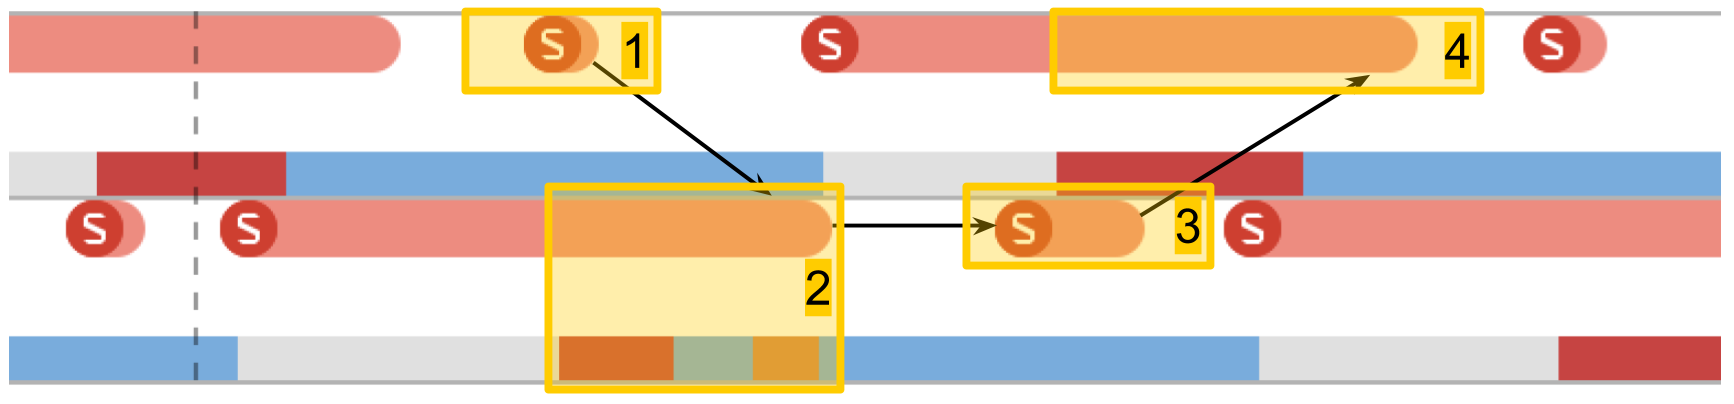
In System Trace, everything looks similar:
- A signal is given for the semaphore of the second stream. It can be seen that this operation is very short.
- The second thread is unlocked, the wait on its semaphore ends.
- A signal is given for the semaphore of the first stream.
- The first thread is unblocked, the wait on its semaphore ends.
The switching time was within 10 microseconds. The difference with creating a thread by 50 times is exactly the reason why thread pools are created, and not a new thread for each procedure.
Losses on system thread context switching
In the previous two tests, the transfer of control between threads was completely controlled - we clearly understood where and where the transition should occur. However, it often happens that the system itself switches from one thread to another. When we run more tasks in parallel than the cores in the device, the operating system must be able to switch itself to provide everyone with processor time.
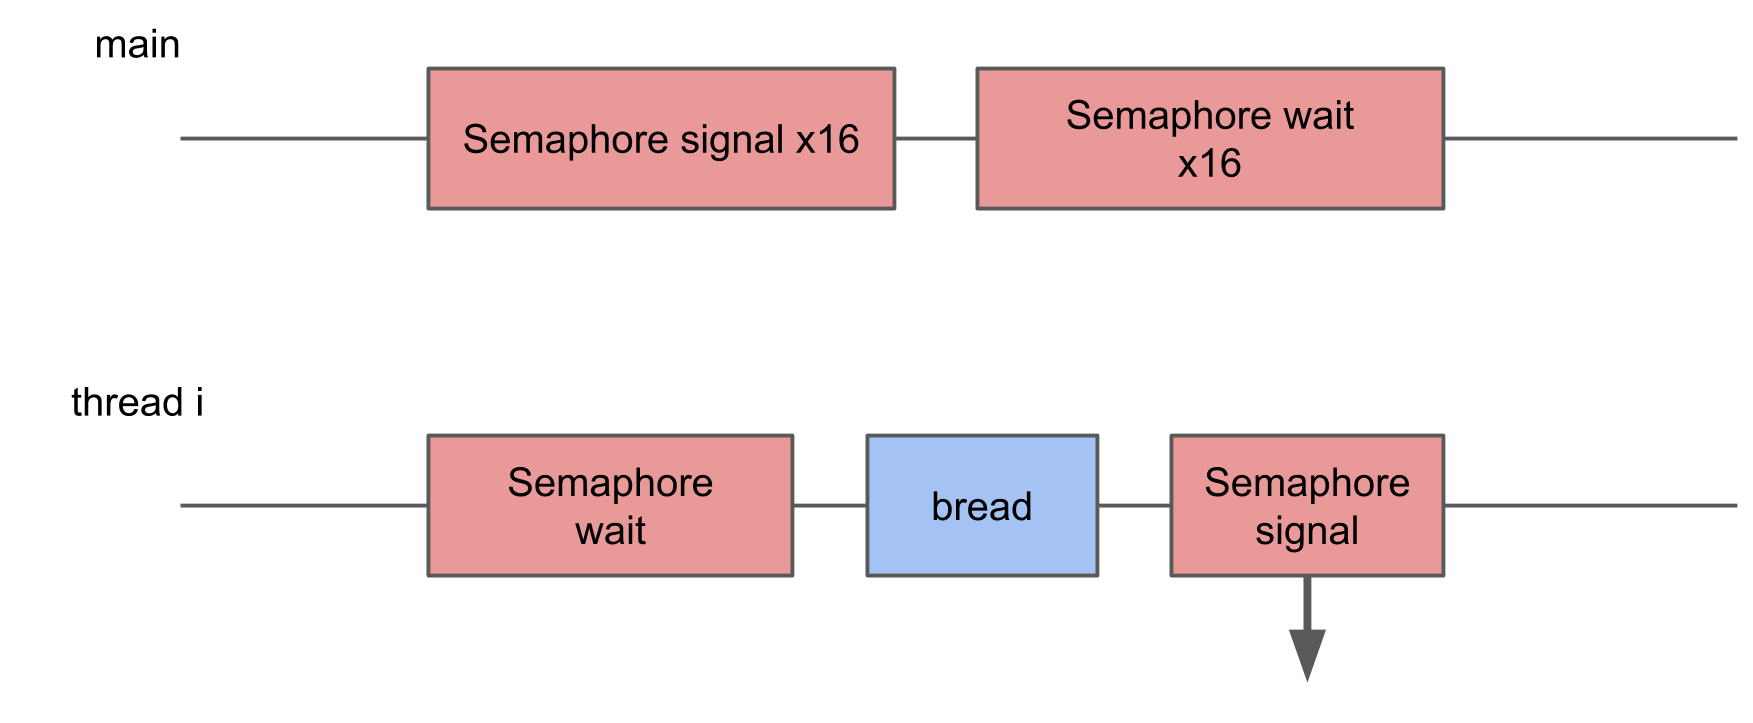
In this test, I wanted to measure the loss of starting too many threads. To do this, a pool of 16 threads is created, each of which waits for a semaphore, and, as soon as it receives a signal, performs a certain procedure and signals the semaphore back. The main thread starts the entire pool, giving 16 signals, and after that it waits 16 signals in response.
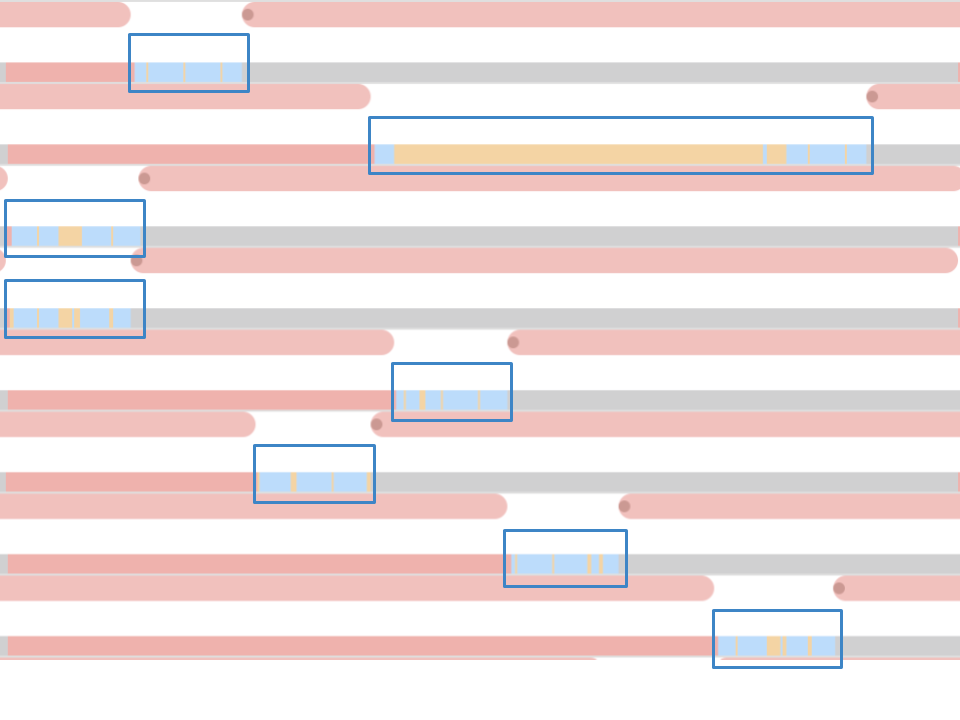
In System Trace you can see that the blocks are scattered randomly, some of them are much longer than the rest. If multiple switching leads to an increase in the execution time of the operation, then the average execution time should increase as a result.
However, with an increase in the number of threads, the average operation time does not increase.
In theory, the average time should be kept as long as the load corresponds to the processing power. That is, the number of tasks corresponds to the number of cores.
If you run many tasks in parallel, then the OS, switching from one task to another, will introduce additional delays. This should be reflected in the result.
In practice, not only our application works on the device, but it still has many parallel and system processes. Even the only thread in our application will be affected by switching, which leads to interruptions and delays. Therefore, in all situations there are delays, and there is no difference whether to build tasks in series or run in parallel.
Below is our Latency Numbers table with data on flows and semaphore.
| L1 | L2 | Memory | Semaphore | |
| Latency numbers | 1 ns | 7 ns | 100 ns | 25 ns |
| iPhone 5s | 7 ns | 30 ns | 240 ns | 8 μs |
| iPhone 6s Plus | 5 ns | 12 ns | 200 ns | 5 μs |
| iPhone X | 2 ns | 12 ns | 146 ns | 3.2 μs |
File Costs
We already have memory and threads - for completeness we only need file system operations.
Read file
The first test is reading speed - how much does it cost to read a file. The test consists of two parts. In the first, we measure the reading speed taking into account the opening, reading, and closing of the file. In the second, we assume that the file is constantly open : we position ourselves somewhere and read as much as we want.
The results are correctly viewed from two points of view. When the file is small, there is some minimal time to read data from a file. Up to one kilobyte is 5.3 microseconds - it doesn’t matter: 1 byte, 2 or 1 KB - for all 5.3 μs. Therefore, you can talk about speed only in the case of large files, when the fixed time can already be neglected. The operation to open and close the file takes approximately the same time for any file size - in the case of 5S, about 50 microseconds.
For reading speed, such graphs are obtained.
For iPhone X and a file of 1 MB, the speed can reach 20 MB / s. Interestingly, reading a 1 MB file is more efficient. With large file sizes, the cache sizes seem to be affected. That is why the speed drops further and evens out in the region of 10 Mb.
Create and delete files
The test consists of the step of creating a file and writing data , and deleting the created files. The result is stepwise: on small sizes, the time is stable - about 7 μs, and further growing. The scale is logarithmic.
I was surprised that the time it takes to delete a large file is commensurate with the time it took to create, as I assumed that deleting is a quick operation. It turns out no, for iPhone, deleting in time is comparable to creating a file. The summary table looks like this.
| L1 | L2 | Memory | Semaphore | Disk | |
| Latency numbers | 1 ns | 7 ns | 100 ns | 25 ns | 150 μs |
| iPhone 5s | 7 ns | 30 ns | 240 ns | 8 μs | 5 μs |
| iPhone 6s Plus | 5 ns | 12 ns | 200 ns | 5 μs | 4 μs |
| iPhone X | 2 ns | 12 ns | 146 ns | 3.2 μs | 1.3 μs |
Conclusion
Based on these measurements, we now have an idea of how much time the basic iOS operations require: accessing memory is nanoseconds, working with files is microseconds, creating a stream is tens of microseconds, and switching is only a few microseconds.
To get a physically noticeable hang in the application, the execution time of the procedure must exceed 15 milliseconds (the time it takes to update the screen at 60fps). This is almost a thousand times larger than most measurements taken in the article. On such a scale, a millisecond is quite a lot, and a second is already "forever."
Tests showed that despite the large difference in the time access to memory and caches, directly using this ratio is quite difficult. Before compiling all your data under L1, you need to make sure that in your case it really will give a result.
According to the tests of operations with threads, we were able to make sure that creating and destroying threads requires a considerable amount of time, but performing a large number of parallel operations does not bring additional costs.
Well, in conclusion, I would like to remind you the most important rule when working on performance - first measurements and only then optimization !
Profile speaker Dmitry Kurkin on GitHub .
The conversion and transformation of AppsConf 2018 reports into articles goes in parallel with the preparation of the all-new 2019 conference . There are only 7 topics in the list of accepted reports so far , but this list will expand all the time so that a cool conference for mobile developers takes place on April 22-23 .
Follow publications, subscribe to the youtube channel and the newsletter and this time will fly by quickly.