Gotta Go Fast: Building for Speed in iOS. Part 2

Sometimes you can find yourself in a situation where your app cannot perform well. So here are some instruments you can use and best practices you can implement to make things better.
This is the second part of the article based on the keynote talk delivered by Luke Parham, an iOS engineer at Fyusion and an author of tutorials for iOS development on RayWenderlich.com, at the International Mobile Developers Conference MBLT DEV in 2017.
Core Animation instrument
If you have done a lot of profiling and you have found all your bottlenecks, sometimes there are still performance problems. This is because of the way UI stuff works in iOS. Anytime you set frames or make UIViews, what actually happens under the hood is you make a CATransaction or the system makes it for you. And these get shipped off to a thing called “the render server”. The rendering server is in charge of doing animations. If you do a UIView animateWith: whatever, that will all happen on the render server which is another thread and it handles all of the app’s animations.
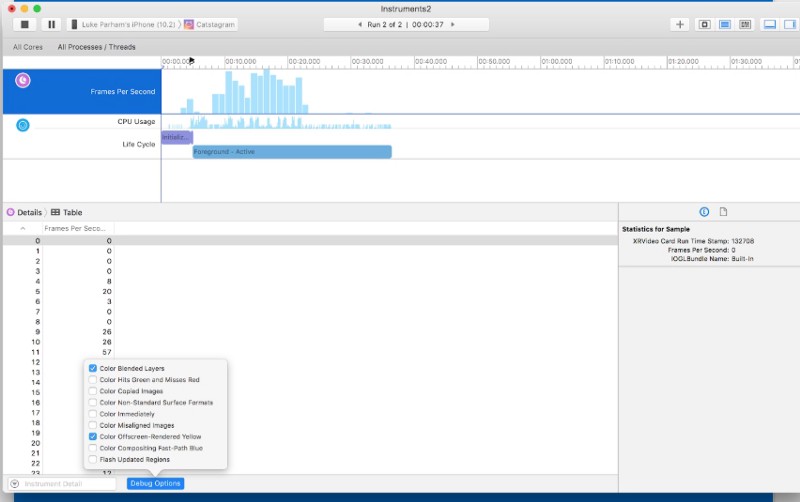
Here is a Time Profiler that has a frame rate gauge up at the top. And at the bottom is the most important part debug options. We are going to tell about the two most important and easiest things to fix.

The first one is color blended layers. This is a really easy one to fix. And this brings us to the first section of performance police. Basically, a lot of apps have problems: even iMessage, beloved Apple app, is doing a lot of not really great stuff. Here we see that there is a lot of red:
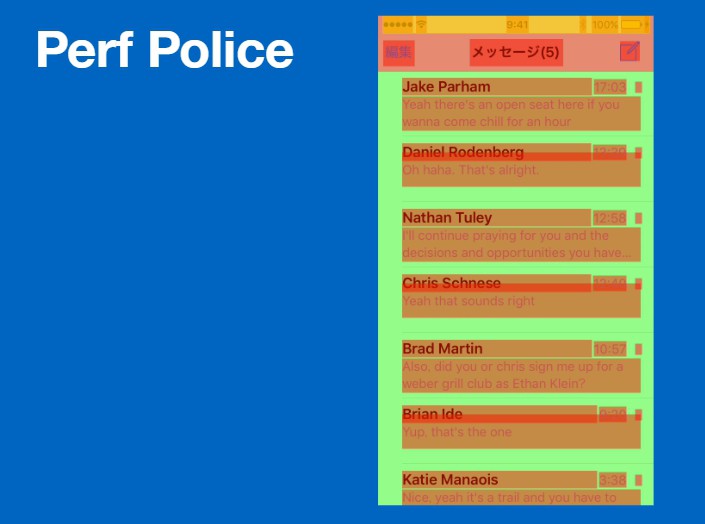
Red means you have labels that have a white background. And then they are on top of another white background and for some reason, they are not set to be opaque. So the blender is blending these colors, white and white and resultantly getting a white color. For every pixel that has red it is doing extra calculations for no benefit, you still get white in the background.
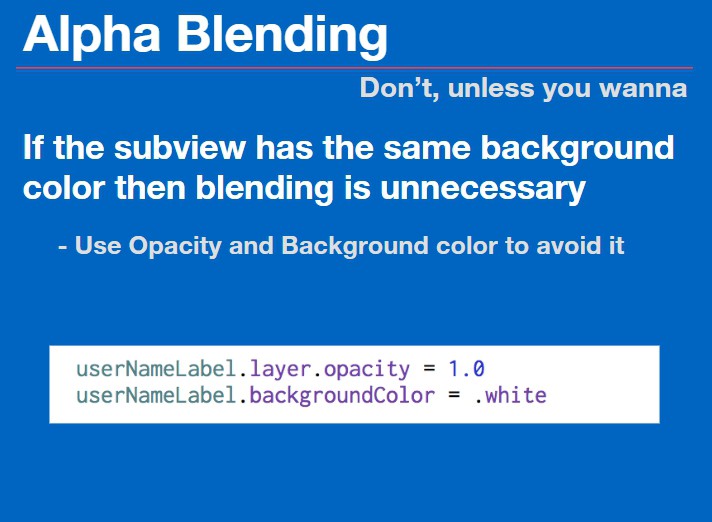
To avoid this you can make layers opaque whenever possible if they are the same color on the same color. If the subview has the same background color blending is unnecessary. All you have to do is to set your layers opacity to 1 and then make sure the background color is set. If your background color is clear, it will always not be opaque.
Offscreen rendering
Offscreen rendered elements will be shown in yellow if you turn this option on. The nice thing about the Core Animation instrument is that you can see other apps. You can turn on these options and then go to any app in your system and you can see what they are doing wrong. In this case, Instagram has these little bubbles up top that show you people’s stories.
As you can see they are all yellow. On iPhone 5 they are aggressively slow. And this is because off-screen rendering is much worse than alpha blending. It stalls the GPU. It ends up having to do extra calculations back and forth between the GPU and CPU, so you get extra stalls that are unnecessary most of the time.
Bezier path instead of view cornering
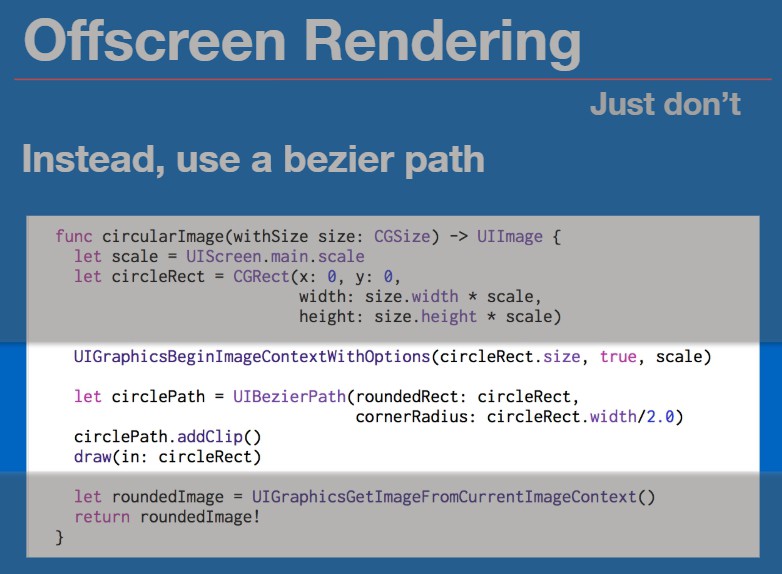
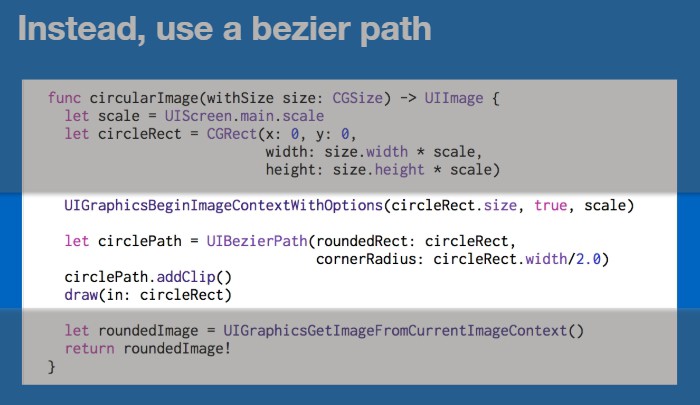
The next rule: do not use the corner radius property. If you have a view and you set view.layer.сornerRadius, then this is always introducing off-screen rendering. Instead, you can use a bezier path and the same kind of CGBitmap stuff from earlier. In this case, a UIGraphics context. This function operates with UIImage it takes in a size, does rounded corners based on that size and uses a bezier path to clip. Then we clip the image and return it from the UIImage context. So this will return a pre-rounded image instead of rounding the view that the image sits inside of.
The last example. Here is Twitter and this is a real-time view of this animation running. It is supposed to open up and show you the information, but all of this text and stuff has been off-screen rendered so it slowed the animation down to a crawl. This is the least performant thing I have ever found in an app that is on the App Store.
So how did this happen? One thing that does cause this to happen is the shouldRasterize property of a CALayer. It’s an option on a layer that allows you to cache textures that have been rendered. There are a lot of weird rules. Like if it has not been used in a certain amount of milliseconds, it will leave the cache. And then, if it leaves the cache, it will be off-screen rendered on every frame. It is not really worth the possible benefits it has. And it is hard to check down if it is actually benefiting you.
Summary
Avoid off-screen rendering and alpha blending if you can. Alpha blending is sometimes necessary. It’s better than off-screen rendering. Off-screen rendering happens for a couple of reasons. It can happen from shadows; it can happen from corner rounding; it can happen from masking.
Make views opaque when possible. Do not use the corner radius property use Bezier paths as much you can. Also, do not use the layer shadow properties if you are doing text shadows. You can use NSShadow instead.
Activity trace
Activity trace is a kind of much lower level version of something that time profiler would do. It gives you a view of all your threads and how they are interacting. And it is pretty complicated. But it has really nice features that you can set up.
System Trace
Use System Trace to track times for specific events. You can set up ways to track specific events and sections of code and see how long they are taking in a real-world application. It allows you to get fine-grained information about what is happening in your system.
- Use “Sign Posts” to signal when something important happens.
- Points are single events when/if you want to see like an animation occurred or something like that.
- Regions have a beginning and an end. For image decoding, you can see when it starts and when it ends so you can estimate how long it took in general.
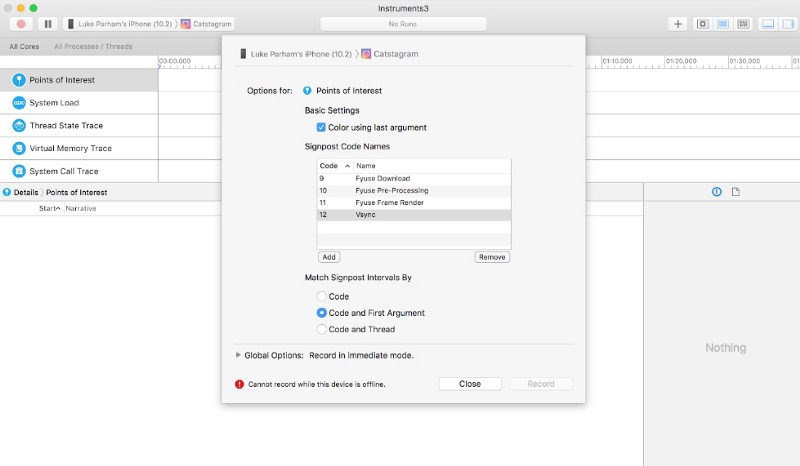
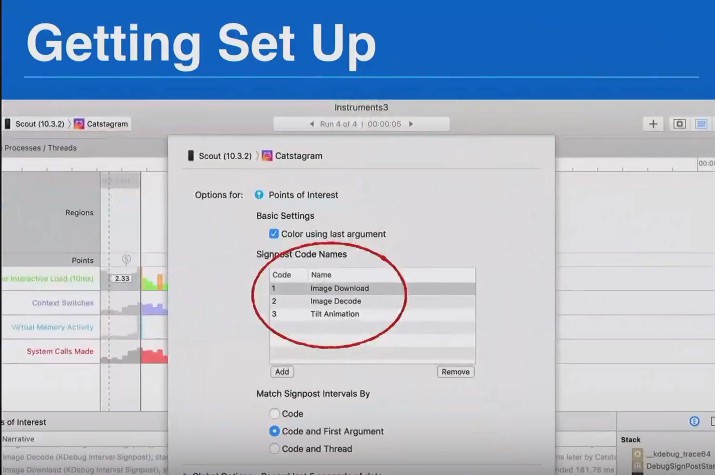
Here is how you set up a system trace template. You make this list of events that can happen. So number one is an image download. Two is an image decoding, and three is this tilt animation I added. Basically, you set up some extra options to see what colors are going to be. Basically, you send it a number like 1 or 2, it will be red or green based on what you send in there.
If you are in Objective-C, you have to import this kdebug_signpost header. In Swift, it is just available for you.

And then you have to call this function, either kdebug_signpost or kdebug_signpost_start and kdebug_ signpost_end. And they work off the code you passed in. So we set up those three events with those numbers. Then you pass in that number here. You pass it an object that is basically the key for this event. And then, the last number is the color. So 2 is like you know red or something.
I have a Swift example project up on GitHub. I kind of simplified things. There are a start and end that are a little more easy to deal with.
This is what it will look like once you have run a trace. It will not show you anything at first. Then, when you kill the app, it will do some calculations and show you stuff here.
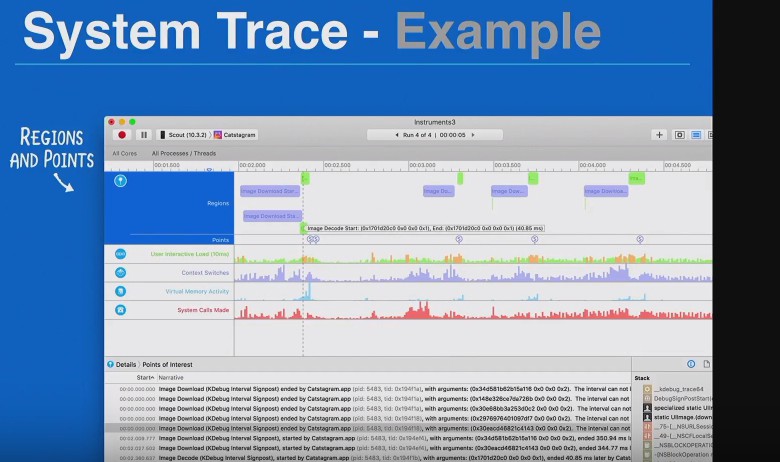
Here we can see our image downloads which took around 200 milliseconds. And then, there is image decoding that took like 40 milliseconds. This is really cool if you have a bunch of crazy stuff going on in your app. You can set up all these events and then just see the readout of how long they are each taking and how they are interacting with each other. That is it for the system trace.
Bonus
Take a look at the example of a camera slowdown where we can see what happens if there are AR things in the app:
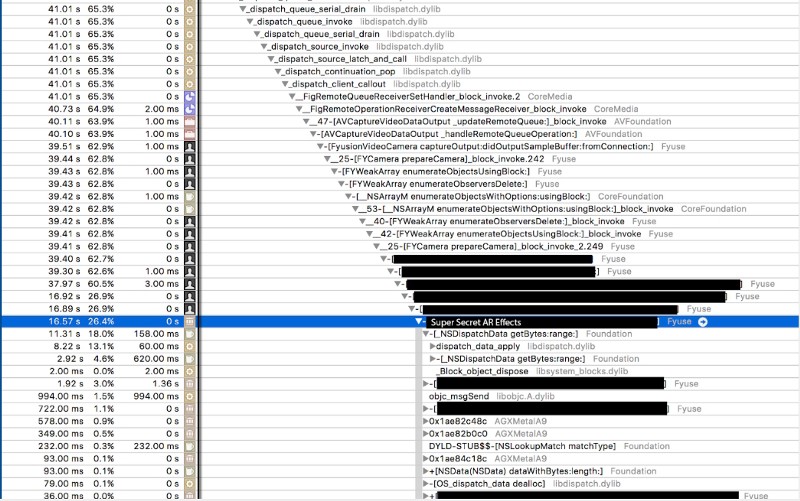
We applied an effect and it was taking up 26.4% of all the calculations on every frame just to calculate one effect. And it was slowing the camera down to something crazy like 10 frames per second.
When I dug in here and looked at this big bottleneck, I saw that the top thing that was doing most of the work was the use of intense NSDispatchData.
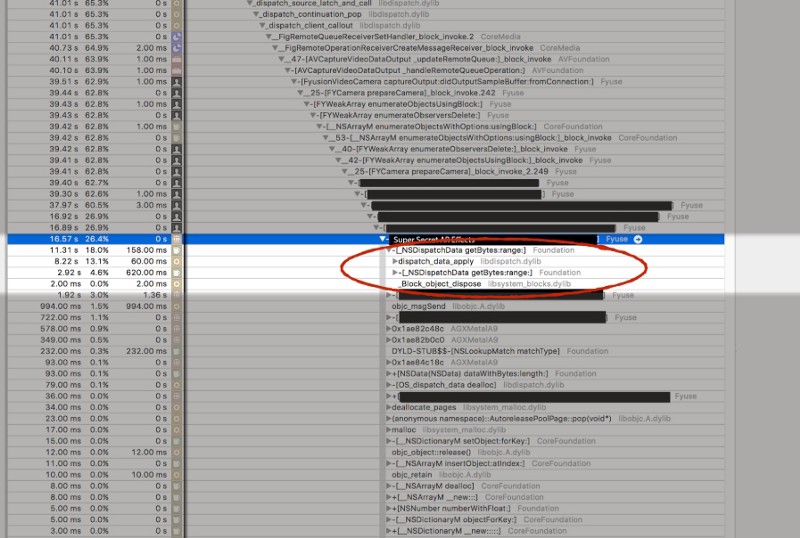
This is a subclass of NSData. And all it is this get bytes with range function. And that is a simple function. All it does is it takes some bytes from a data and puts it somewhere else. It’s not too crazy but, apparently, all the things that it was doing internally was taking up 18% of this 26%.
Rule #1
It is an NSData and it’s getting bytes. That is a simple Objective-C thing but if you run into that and that is a bottleneck, then it is time to switch to using C instead. Since the bottleneck was around one call to grab float values, you can just use memcpy(). With memcpy() you can move a chunk of data somewhere else. Cuts out a quite a lot of overhead.
If you look into like NSData, these classes are like thousands of lines. So there is a lot of stuff going on in there. In this case, we have the original in red.
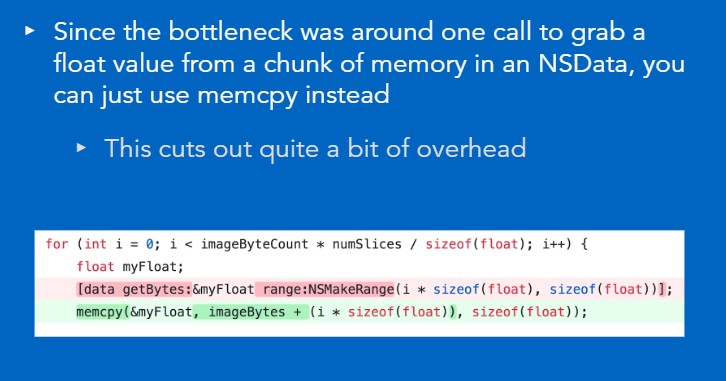
Here you get a range, grab some bytes and copy them into the buffer. The memcpy() version is almost exactly the same thing. It does not look any more complicated and it does aggressively fewer things.
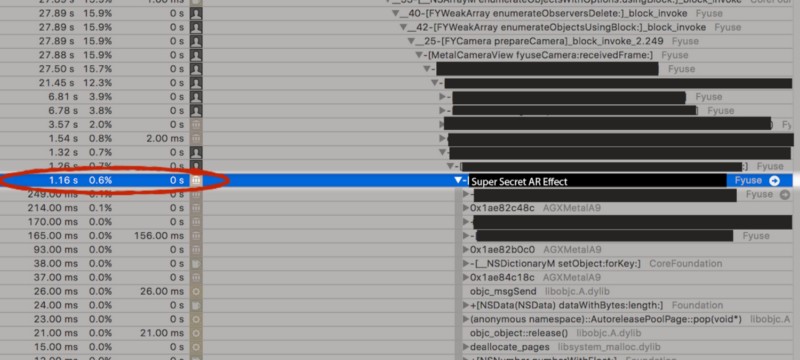
When we change that and we run it again, things went from 26% to 0.6% by changing that one line to memcpy(). And then, frame rate jumped up dramatically.
Rule #2
Avoid overdrawing if you are doing some kind of rendering app or even if you are doing something like a loading bar. A lot of times events will happen more than 60 frames per second. In that case, you can throttle this update of the UI by using a CADisplayLink. It has a property called preferredFramesPerSecond. That is only for iOS 10 or higher. For older ones, you have to do it manually but it is still useful.
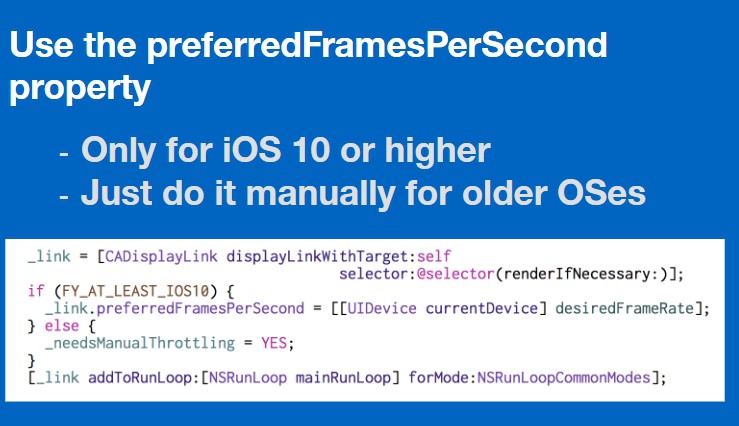
You can set the desired framerate. A lot of times for like loading bars I will set it around 15 frames per second because it doesn’t really matter. It does not have to update 60 frames per second. This can save you much work you actually do if things look the same either way.
Rule #3
Use IMP caching. This is useful for only Objective-C. InObjective-C, when you call a method under the hood, you are actually calling Objective-C message send function (objc_msgSend()). If you are seeing this calls in traces taking up a large chunk of time, this is something you can actually get rid of easily. It is basically the cache table where you look up function pointers by giving it a name of some method. Instead of doing that lookup every single time you can cache the function pointer and just call it directly. It is at least twice as fast usually.

If you do not have cached pointer, you can grab it by calling methodForSelector:. Then we just call this method like a regular function call. You pass in the object the selector and then any arguments come after that.
Rule #4
Do not use ARC. ARC is something that adds a bunch of overhead. In your code, you have all this stuff happening and it sprinkles all with retains and releases. It does as much as it has to, and it does a bunch more. So if you really want to optimize, if you see that you have a bunch of retaining and release calls in your trace and they are taking up a ton of time, you can just switch to not using ARC which is a lot more work.
It is also hard to get your teammates to agree to do this and not to be mad about it.
Do not use Swift if it is especially performance sensitive. Swift is a nice language. It has got some really neat features. But it also uses more boilerplate going on inside to get a high level of functionality. If you want to be fast, you should go as close to the assembly as close to the low-level stuff as you can. And that will be faster because it is less code automatically.
If you are looking into the stuff if you thought it was interesting, there is a really good book called “iOS and MacOS: Performance Tuning” by Marcel Weiher. It goes really in-depth into a lot of this stuff and a lot more past this. I also have a video series. I do videos for RayWenderlich. There is a practical instrument series I did that goes more in-depth and that explains these things a little bit more and has some examples. So if you want to learn more about instruments specifically, you can watch that video series. And then, WWDC videos — there is a ton of them that explain different performance things like this.
Video
Here you can find the first part of an article based on Luke's talk. Watch the full talk here: