Overview of the infrared CO2 sensor MH-Z19
Recently, gadgets showing the level of CO 2 have been popular, as well as articles telling how a CO 2 monitor can be turned into a sensor connected to a computer. I want to show the solution to the problem on the other hand.
Unlike older CO 2 sensors , the MH-Z19 does not require specific voltage or high power and can transmit data via UART and PWM.
It’s not that I didn’t trust PWM, but it’s better to get the data in digital and with a checksum. UART allows you to query CO 2 levels and do two types of calibration. We leave the calibration to Garrus and consider the data request. To do this, at a speed of 9600 (8 bit, stop - 1, parity - none), you need to send the following nine bytes:
• 0xFF - the beginning of any command
• 0x01 - the first sensor (it is only one)
• 0x86 - command
• 0x00, 0x00, 0x00, 0x00, 0x00 - data
• 0x79 - checksum.
Something like this will come back:
• 0xFF - the beginning of any answer
• 0x86 - command
• 0x01, 0xC1 - high and low value (256 * 0x01 + 0xC1 = 449)
• 0x3C, 0x04, 0x3C, 0xC1 - the documentation says that something like 0x47, 0x00, 0x00, 0x00 should come, but in reality it’s not clear what.
• 0x7B - the checksum.
The checksum is calculated as follows: 7 bytes of the response are taken (all except the first and last), added, inverted, increased by 1: 0x86 + 0x01 ... + 0xC1 = 0x85, 0x85 xor 0xFF = 0x7A, 0x7A + 1 = 0x7B.
According to the documentation, the sensor takes about three minutes to enter the operating mode. The first time after turning it on, it will produce either 5000ppm or 400ppm. After a particularly diligent soldering, it may come to several hours.
The sensor responds to a change in the concentration of CO 2with a delay of about a minute. If you exceed a concentration of 5000ppm (for example, you breathed heavily on it for a minute), it will give false data for a while, underestimating the level of CO 2 - this is how I even got 80ppm.
This is not reflected in the documentation, but you should not request UART data more often than every 10 seconds, otherwise the sensor starts to give out something strange.
It's time for pictures. Connect the sensor to the Arduino Uno via Software Serial, TX / RX in A0 / A1, 5V power, ground in Gnd:

Each measurement goes at intervals of 10 seconds. The values stopped jumping when I moved away from the sensor.

Now let's make the sensor mobile. To do this, you need a device with OTG and an application like DroidTerm .
There is a subtlety: in order to establish a connection, you need to restart the Arduino.

After making sure that everything works, we will remove the Arduino, replacing it with the FTDI FT232RL.

The sensor should be powered after connection so that there are no problems with the connection.
I use RealTerm to send binary data via the COM port :

It might be worth adding power management via DTR so that the sensor can be restarted.
Useful links:
MH-Z19 sensor manual Connection
diagram and code for PWM
Comparison with another sensor.
Article on GT about MH-Z19 and ESP8266.
I have only one sensor and I really don’t like to disassemble what I once did, so I suggest you choose.
Unlike older CO 2 sensors , the MH-Z19 does not require specific voltage or high power and can transmit data via UART and PWM.
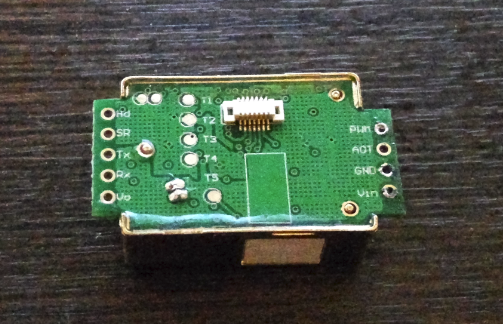
- Hd — Zero calibration will start if LOW is applied to Hd for more than 7 seconds. Calibration is not necessary.
- SR - not used
- Tx - signal level - 3.3V
- Rx - also 3.3V (works with 5V, but I would not recommend it)
- Vo - output voltage 3.3V, no more than 10mA
- PWM, the data is recorded as follows: the cycle length is 1004ms, the first 2ms is always HIGH, the last is always LOW, and the "middle" is proportional to the CO2 concentration in the range 0 - 5000ppm (and not 2000ppm as in the documentation).
C ppm = 5000 * (T high - 2ms) / (T high + T low - 4ms)
I note that PWM is a very moody thing, requiring careful soldering and 3.3V. - AOT - not used
- Gnd - earth
- Vin - supply voltage 3.6 - 5.5V (the sensor works and gives the same values with 3.3V power, but the manufacturer strongly recommends sticking to the framework)
It’s not that I didn’t trust PWM, but it’s better to get the data in digital and with a checksum. UART allows you to query CO 2 levels and do two types of calibration. We leave the calibration to Garrus and consider the data request. To do this, at a speed of 9600 (8 bit, stop - 1, parity - none), you need to send the following nine bytes:
• 0xFF - the beginning of any command
• 0x01 - the first sensor (it is only one)
• 0x86 - command
• 0x00, 0x00, 0x00, 0x00, 0x00 - data
• 0x79 - checksum.
Something like this will come back:
• 0xFF - the beginning of any answer
• 0x86 - command
• 0x01, 0xC1 - high and low value (256 * 0x01 + 0xC1 = 449)
• 0x3C, 0x04, 0x3C, 0xC1 - the documentation says that something like 0x47, 0x00, 0x00, 0x00 should come, but in reality it’s not clear what.
• 0x7B - the checksum.
The checksum is calculated as follows: 7 bytes of the response are taken (all except the first and last), added, inverted, increased by 1: 0x86 + 0x01 ... + 0xC1 = 0x85, 0x85 xor 0xFF = 0x7A, 0x7A + 1 = 0x7B.
According to the documentation, the sensor takes about three minutes to enter the operating mode. The first time after turning it on, it will produce either 5000ppm or 400ppm. After a particularly diligent soldering, it may come to several hours.
The sensor responds to a change in the concentration of CO 2with a delay of about a minute. If you exceed a concentration of 5000ppm (for example, you breathed heavily on it for a minute), it will give false data for a while, underestimating the level of CO 2 - this is how I even got 80ppm.
This is not reflected in the documentation, but you should not request UART data more often than every 10 seconds, otherwise the sensor starts to give out something strange.
It's time for pictures. Connect the sensor to the Arduino Uno via Software Serial, TX / RX in A0 / A1, 5V power, ground in Gnd:
Borrowed sketch in which checksum verification is added
#include ;
SoftwareSerial mySerial(A0, A1); // A0 - к TX сенсора, A1 - к RX
byte cmd[9] = {0xFF,0x01,0x86,0x00,0x00,0x00,0x00,0x00,0x79};
unsigned char response[9];
void setup() {
  Serial.begin(9600);
  mySerial.begin(9600);
}
void loop()
{
  mySerial.write(cmd, 9);
  memset(response, 0, 9);
  mySerial.readBytes(response, 9);
  int i;
  byte crc = 0;
  for (i = 1; i < 8; i++) crc+=response[i];
  crc = 255 - crc;
  crc++;
  if ( !(response[0] == 0xFF && response[1] == 0x86 && response[8] == crc) ) {
    Serial.println("CRC error: " + String(crc) + " / "+ String(response[8]));
  } else {
    unsigned int responseHigh = (unsigned int) response[2];
    unsigned int responseLow = (unsigned int) response[3];
    unsigned int ppm = (256*responseHigh) + responseLow;
    Serial.println(ppm);
  }
  delay(10000);
}
Each measurement goes at intervals of 10 seconds. The values stopped jumping when I moved away from the sensor.
Now let's make the sensor mobile. To do this, you need a device with OTG and an application like DroidTerm .
There is a subtlety: in order to establish a connection, you need to restart the Arduino.
After making sure that everything works, we will remove the Arduino, replacing it with the FTDI FT232RL.
The sensor should be powered after connection so that there are no problems with the connection.
I use RealTerm to send binary data via the COM port :
It might be worth adding power management via DTR so that the sensor can be restarted.
Useful links:
MH-Z19 sensor manual Connection
diagram and code for PWM
Comparison with another sensor.
Article on GT about MH-Z19 and ESP8266.
I have only one sensor and I really don’t like to disassemble what I once did, so I suggest you choose.
Only registered users can participate in the survey. Please come in.
What to do with the sensor?
- 12% Connect to a computer and write a desktop monitoring application 32
- 15.8% Add it to a weather station 42
- 6.7% Make a gadget for a mobile device 18
- 62.6% Add ESP8266 to it, turning it into a minimalistic component for the “smart home” 166
- 2.6% Own option in comment 7