Virtual city: why geoinformation systems have not yet turned the world of architecture upside down
This article is about the city and architecture. Although there will be nothing about beautiful houses. There was a little about them in the previous article, and, alas, it diverted attention from the information component itself and directed the discussion into the discussion of 3D-models of cities - and geographic information systems (GIS), which in one form or another provide this model or make it possible to participate in modeling. So, two- and three-dimensional GIS of various kinds are not numbers. Why, then, geographic information systems still have not led to a revolution in urban planning?
First, let's talk about why architecture and construction should be approached more responsibly than is now accepted. The fact is that, in addition to building design, the architect’s job is to plan people's lives. Every day the city steadily controls you: you drive and walk along the streets traced by someone, live in houses housed with some mysterious calculation, and even someone in the park put a bench in this place for a reason. Architecture all the time imperceptibly forces you to do something in the framework of your usual life, but you can also encode something new, and you will accept it without even noticing. For example, the design of houses with a bathroom in each apartment has changed the lifestyle of tens of millions of people. You would be surprised to see an innovative residential project of the “improved layout” of the 30s, when it was supposed

Typical section of the Moscow City Council, a fragment of the plan, 1925.
Modern life is changing rapidly, and design goes with it. Of course, you will no longer find a culman, tracing paper rolls and a copy table. They were replaced by numerous CAD systems (computer aided design). Instead of jars of carcasses, gouache and watercolors - programs for 3D-modeling and photorealistic rendering. The calculations are carried out not on a slide rule, but in special software systems that extract data from three-dimensional models. Algorithms have become more complex, accuracy and reliability are higher.
But these are all quantitative, not qualitative changes. Yes, they have transformed the process of daily work, but the decision-making mechanism has remained the same. Sometimes no analysis is carried out at all, and the arguments can be at the level of “let’s do it this way” and “it will look beautiful on the map later”. The business case is far-fetched: “Ten years ago, we built a pool of almost that size in the city of N-sk, and it paid off by X percent for Y years, so just index the prices.” To obtain relevant information - to voluntarily bring down an avalanche of incomprehensible calculations on your own head. And the majority of interested parties are satisfied with this situation, although there are simply epic failed projects.
So, master plans of cities are developed by architects from the standpoint of the beauty of the lines, their understanding of the convenience of life and intuition. These projects are evaluated and approved by managers and economists, who value the figures of the balance of territories, expected costs and benefits. And consumers of the environment, residents, usually do not influence this situation in any way, and it doesn’t even occur to them that they could influence it.

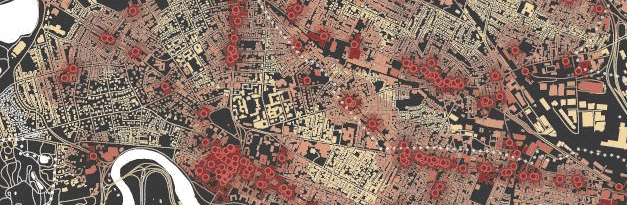
Something like this looks promising general plan. Different colors - this is where what has already been built or what is planned to be built: for example, housing, a park or offices. Then a detailed project is developed with an explanatory note occupying a whole cabinet - in paper form, of course.
In comparison, the constantly updated geographic information model obviously wins. Not just a 3D map, but a true information system. Where you can select a group of houses with a mouse and find out how many people live there. Where on the map are marked all the institutions and institutions with their bandwidth and target audience. Where can I find out the average traffic of cars on any street at any time. Where the measured level of noise or air pollution at some point turns into a public figure on the city plan, and not a piece of paper in a dusty folder that was forgotten that day. Alas, money and labor must be invested right here and now, and the return is expected “somewhere out there”, so GIS in design comes extremely slowly and unevenly.
3D modeling of thousands of unremarkable buildings is also not a very interesting task, but it can only be entrusted to automation with a very conditional value. This is mainly done either by amateurs, then the result is available to everyone, but the quality is not too high, or private developers who are professional in business - but they are in no hurry to share the fruits of their labors.
This is what a private commercial 3D model of San Francisco looks like from a company that can bill half a million American money for a media project, and a private developer - without hesitation, pay this bill.
One way or another, a full-fledged virtual model of the existing material (but, alas, not social) space is gradually being created. While it is quite fragmented, but continuously replenished like an avalanche. Very often, only the city center or individual iconic objects are well developed, while the rest are automatically created or are completely absent, but there are examples of “carpet”, for example, Berlin with its 550,000 simulated buildings. But this is precisely a “three-dimensional map”, and not an information system. With the rest, not so noticeable and attractive to fans, the flow of information is worse so far.

A Berlin model that can be downloaded in pieces for local work. I would have so much wealth in my student days!
Smaller in size, but more technologically advanced and versatile projects were launched in Helsinki and Montreal based on the Bentley MicroStation and Bentley Map systems. The city model covers underground and ground infrastructure and is being developed using laser scanning technology. Aerial lidar imaging is used to measure ground infrastructure facilities, and ground lidar imaging for tunnels. With the received model, all possible municipal documentation and real estate correspondence are synchronized. It also provides the allocation of land for construction. This GIS proved its effectiveness in engineering projects related to the complex high-density infrastructure of the city center. Alas, the design tools from “Bentley Systems” and stand like a Bentley, so I did not have to see them even with one eye.read in the article .
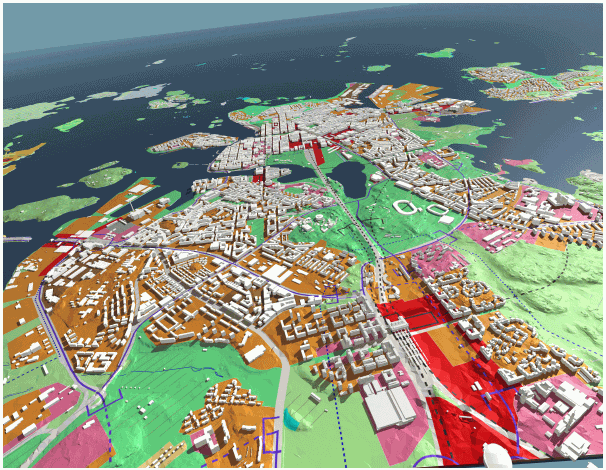
City of Helsinki, Finland, City Survey Division - 3D Municipal Information System. A sufficiently multidisciplinary GIS, as far as one can judge from open sources.
In the post-Soviet space, all development is subject to state regulation, which means that the GIS must be consecrated by Bureaucratic Procedures. Everything that requires government support and organization usually works very slowly, but gradually individual projects appear in Russia. For example, the creation of a unified (two-dimensional) geographic information system of the Tyumen region , which was recognized as the best regional IT project of 2015 at the Global CIO contest. In addition, it enables external developers to create their own commercial GIS services based on the concept of open data. Another example: recently an electronic map of Khabarovsk underground engineering networks was completed, which was created by several organizations for as long as 10 years (in words: ten years). It is likely that the “digitization” has been going on for so long because updating the information of the Soviet period when reality may differ from the existing plan by tens of meters is hellish work. Illustration from personal practice: once I met an undocumented Soviet cable (supposedly connected) with a diameter of 15 centimeters, passing right through the basement of the building and going through the opposite wall towards a white spot on a topographic survey with the modest inscription “special construction”.
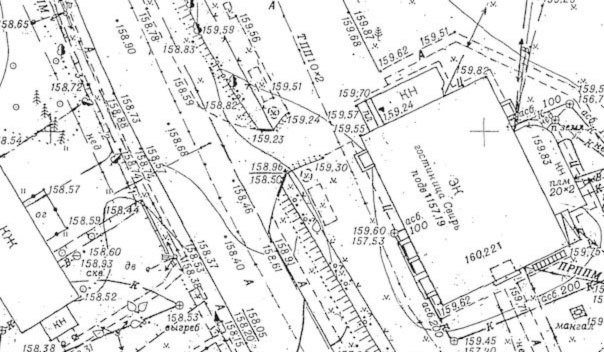
A paper topographic survey, a small piece, just to make you imagine the scale of the tragedy. All these lines indicate something very important and mostly invisible.
The problem of even the few integrated GISs existing in Russia and the CIS is that they are used formally, simply as a replacement for paper maps, layouts and folders with reports, and not for modeling and analyzing variant branches and optimizing the result. In reality, the only version of the plan that is usually proposed and adopted is the quality of which depends on the talent, experience, competence and credibility of the developers. In addition, all the countless deviations “only as an exception” are usually undertaken locally without the consent of the authors, are not reflected in the draft, and it is less and less correlated with reality. GIS, even two-dimensional, potentially solves this problem.
But what are these “branches”, and why are they needed if everything works without them? Back in the 60s, the Pole Boleslav Malisz came up with a threshold analysis method. In short: when the development of the city along the old path becomes clearly irrational, too expensive, or rests against an obstacle like a river or railway, it is necessary to change not tactics, but strategy. To “cross the threshold”, large resources are needed at one time, and returns are not expected immediately, so you cannot make a mistake at this stage. Several possible fundamentally different new development paths are selected, a forecast for costs and profits for a dozen or two years ahead is built for them, and the most advantageous path at the moment is chosen, along which development continues until the next moment of stagnation. GIS is an ideal option for implementing this method. But it should be a much more mathematical system than those which are now, and the analysis tools should be different. Ideally, a virtual city should have its own AI (or call it an active expert system) that can both offer and evaluate seemingly incomparable options.
I managed to find information on the application of mathematical modeling of territorial development in Russia of the 21st century only for Tolyatti (2001) and Yakutsk (2003) using the “LandUse” system of the Central Research Institute for Urban Planning, which has been gradually developed since the mid-70s.

The result looks like a grid map of the existing and planned use of the territory based on the value of each square of the earth calculated from many parameters. The mathematical model requires grid maps of stats of miles of different data types to enter, and the number and types of parameters and the step of the necessary grid are calculated individually each time.Of course, the software package is not compatible with conventional GIS.UPD: The Habrauser who participated in the development of this system explained that in fact it is able to receive data from other GIS, it simply is not always available, and then manual input is really used.
So, the problems of urban development of modern GIS are that there are separately two-dimensional wide-profile models, separately three-dimensional weakly informational ones, they are all created in a large number of competing and not always compatible programs and formats, while most of them are not an “official document” and cannot be openly used by designers. These systems do not support the time component, which means that they do not allow for a retrospective analysis of the territory, to model probable future conditions and to compare them. The number of “information sections” of a virtual city is still insufficient for quantitative changes to become qualitative. But progress does not stand still
First, let's talk about why architecture and construction should be approached more responsibly than is now accepted. The fact is that, in addition to building design, the architect’s job is to plan people's lives. Every day the city steadily controls you: you drive and walk along the streets traced by someone, live in houses housed with some mysterious calculation, and even someone in the park put a bench in this place for a reason. Architecture all the time imperceptibly forces you to do something in the framework of your usual life, but you can also encode something new, and you will accept it without even noticing. For example, the design of houses with a bathroom in each apartment has changed the lifestyle of tens of millions of people. You would be surprised to see an innovative residential project of the “improved layout” of the 30s, when it was supposed
Typical section of the Moscow City Council, a fragment of the plan, 1925.
Modern life is changing rapidly, and design goes with it. Of course, you will no longer find a culman, tracing paper rolls and a copy table. They were replaced by numerous CAD systems (computer aided design). Instead of jars of carcasses, gouache and watercolors - programs for 3D-modeling and photorealistic rendering. The calculations are carried out not on a slide rule, but in special software systems that extract data from three-dimensional models. Algorithms have become more complex, accuracy and reliability are higher.
But these are all quantitative, not qualitative changes. Yes, they have transformed the process of daily work, but the decision-making mechanism has remained the same. Sometimes no analysis is carried out at all, and the arguments can be at the level of “let’s do it this way” and “it will look beautiful on the map later”. The business case is far-fetched: “Ten years ago, we built a pool of almost that size in the city of N-sk, and it paid off by X percent for Y years, so just index the prices.” To obtain relevant information - to voluntarily bring down an avalanche of incomprehensible calculations on your own head. And the majority of interested parties are satisfied with this situation, although there are simply epic failed projects.
So, master plans of cities are developed by architects from the standpoint of the beauty of the lines, their understanding of the convenience of life and intuition. These projects are evaluated and approved by managers and economists, who value the figures of the balance of territories, expected costs and benefits. And consumers of the environment, residents, usually do not influence this situation in any way, and it doesn’t even occur to them that they could influence it.
Something like this looks promising general plan. Different colors - this is where what has already been built or what is planned to be built: for example, housing, a park or offices. Then a detailed project is developed with an explanatory note occupying a whole cabinet - in paper form, of course.
In comparison, the constantly updated geographic information model obviously wins. Not just a 3D map, but a true information system. Where you can select a group of houses with a mouse and find out how many people live there. Where on the map are marked all the institutions and institutions with their bandwidth and target audience. Where can I find out the average traffic of cars on any street at any time. Where the measured level of noise or air pollution at some point turns into a public figure on the city plan, and not a piece of paper in a dusty folder that was forgotten that day. Alas, money and labor must be invested right here and now, and the return is expected “somewhere out there”, so GIS in design comes extremely slowly and unevenly.
3D modeling of thousands of unremarkable buildings is also not a very interesting task, but it can only be entrusted to automation with a very conditional value. This is mainly done either by amateurs, then the result is available to everyone, but the quality is not too high, or private developers who are professional in business - but they are in no hurry to share the fruits of their labors.
This is what a private commercial 3D model of San Francisco looks like from a company that can bill half a million American money for a media project, and a private developer - without hesitation, pay this bill.
One way or another, a full-fledged virtual model of the existing material (but, alas, not social) space is gradually being created. While it is quite fragmented, but continuously replenished like an avalanche. Very often, only the city center or individual iconic objects are well developed, while the rest are automatically created or are completely absent, but there are examples of “carpet”, for example, Berlin with its 550,000 simulated buildings. But this is precisely a “three-dimensional map”, and not an information system. With the rest, not so noticeable and attractive to fans, the flow of information is worse so far.
A Berlin model that can be downloaded in pieces for local work. I would have so much wealth in my student days!
Smaller in size, but more technologically advanced and versatile projects were launched in Helsinki and Montreal based on the Bentley MicroStation and Bentley Map systems. The city model covers underground and ground infrastructure and is being developed using laser scanning technology. Aerial lidar imaging is used to measure ground infrastructure facilities, and ground lidar imaging for tunnels. With the received model, all possible municipal documentation and real estate correspondence are synchronized. It also provides the allocation of land for construction. This GIS proved its effectiveness in engineering projects related to the complex high-density infrastructure of the city center. Alas, the design tools from “Bentley Systems” and stand like a Bentley, so I did not have to see them even with one eye.read in the article .
City of Helsinki, Finland, City Survey Division - 3D Municipal Information System. A sufficiently multidisciplinary GIS, as far as one can judge from open sources.
In the post-Soviet space, all development is subject to state regulation, which means that the GIS must be consecrated by Bureaucratic Procedures. Everything that requires government support and organization usually works very slowly, but gradually individual projects appear in Russia. For example, the creation of a unified (two-dimensional) geographic information system of the Tyumen region , which was recognized as the best regional IT project of 2015 at the Global CIO contest. In addition, it enables external developers to create their own commercial GIS services based on the concept of open data. Another example: recently an electronic map of Khabarovsk underground engineering networks was completed, which was created by several organizations for as long as 10 years (in words: ten years). It is likely that the “digitization” has been going on for so long because updating the information of the Soviet period when reality may differ from the existing plan by tens of meters is hellish work. Illustration from personal practice: once I met an undocumented Soviet cable (supposedly connected) with a diameter of 15 centimeters, passing right through the basement of the building and going through the opposite wall towards a white spot on a topographic survey with the modest inscription “special construction”.
A paper topographic survey, a small piece, just to make you imagine the scale of the tragedy. All these lines indicate something very important and mostly invisible.
The problem of even the few integrated GISs existing in Russia and the CIS is that they are used formally, simply as a replacement for paper maps, layouts and folders with reports, and not for modeling and analyzing variant branches and optimizing the result. In reality, the only version of the plan that is usually proposed and adopted is the quality of which depends on the talent, experience, competence and credibility of the developers. In addition, all the countless deviations “only as an exception” are usually undertaken locally without the consent of the authors, are not reflected in the draft, and it is less and less correlated with reality. GIS, even two-dimensional, potentially solves this problem.
But what are these “branches”, and why are they needed if everything works without them? Back in the 60s, the Pole Boleslav Malisz came up with a threshold analysis method. In short: when the development of the city along the old path becomes clearly irrational, too expensive, or rests against an obstacle like a river or railway, it is necessary to change not tactics, but strategy. To “cross the threshold”, large resources are needed at one time, and returns are not expected immediately, so you cannot make a mistake at this stage. Several possible fundamentally different new development paths are selected, a forecast for costs and profits for a dozen or two years ahead is built for them, and the most advantageous path at the moment is chosen, along which development continues until the next moment of stagnation. GIS is an ideal option for implementing this method. But it should be a much more mathematical system than those which are now, and the analysis tools should be different. Ideally, a virtual city should have its own AI (or call it an active expert system) that can both offer and evaluate seemingly incomparable options.
I managed to find information on the application of mathematical modeling of territorial development in Russia of the 21st century only for Tolyatti (2001) and Yakutsk (2003) using the “LandUse” system of the Central Research Institute for Urban Planning, which has been gradually developed since the mid-70s.
The result looks like a grid map of the existing and planned use of the territory based on the value of each square of the earth calculated from many parameters. The mathematical model requires grid maps of stats of miles of different data types to enter, and the number and types of parameters and the step of the necessary grid are calculated individually each time.
So, the problems of urban development of modern GIS are that there are separately two-dimensional wide-profile models, separately three-dimensional weakly informational ones, they are all created in a large number of competing and not always compatible programs and formats, while most of them are not an “official document” and cannot be openly used by designers. These systems do not support the time component, which means that they do not allow for a retrospective analysis of the territory, to model probable future conditions and to compare them. The number of “information sections” of a virtual city is still insufficient for quantitative changes to become qualitative. But progress does not stand still