The chromatic number of the plane is not less than 5
The problem of the chromatic number of a plane is formulated as follows: what is the smallest number of colors that can be used to color a plane so that any two points at distance 1 are painted in different colors?
This task was formulated by Hugo Hadwiger and Pal Erdös in the forties of the XX century. Independently of them, at about the same time, Edward Nelson and J. R. Isbell were engaged in this task. After Hadwiger's 1961 work on problems open at that time, the chromatic number of the plane began to be actively studied.
It was immediately shown that in 3 colors the plane cannot be painted in the required manner, however 7 colors are enough. Indeed, it is easy to select several points on the plane so that some of them are at a distance of exactly 1 (such a design of points is called the unit distance graph), and then iterate over to show that it is impossible to color these points in 3 colors. Examples of such graphs - the Moser spindle and Count Golomba are shown in the picture below. To show that 7 colors are enough, tile the plane with regular hexagons with side 0.4 and paint them according to a specific pattern, as in the picture below. Then, as you can easily see, the ends of any segment of length 1 will lie in different hexagons of different colors.
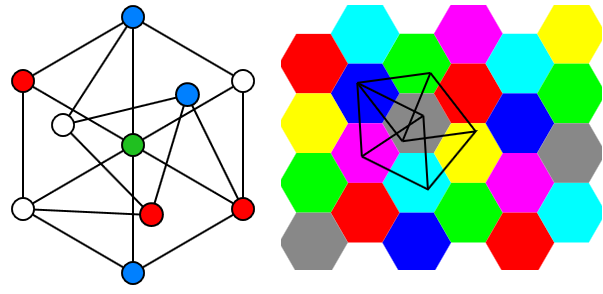
However, since then no one has been able to clarify either the upper or lower bounds. The task was called the Nelson – Erdös – Hadwiger Problem . 60 years passed, and now, in April 2018, the amateur mathematician Aubrey de Gray presented a graph of unit distances, which cannot be painted in 4 colors.
 Aubrey David Nicholas Jasper di Gray - British gerontologist, explores various aspects of human aging. He is the developer of the SENS concept - “strategies for engineered negligible senescence”. Chairman and Director of Science, SENS Foundation, Editor-in-Chief of the academic journal Rejuvenation Research. He is the author of the popular science book “Ending Aging”, which details the issue of the complete victory over aging by means of medicine over the next few decades. (info from the wiki)
As it turned out, this venerable bearded uncle is also interested in mathematics in his free time. On April 8, 2018, he posted an article on arXiv, which describes a method for constructing a graph of unit distances, for painting which you need at least 5 colors.
Let's take a closer look at what kind of graph this is.
It all starts with a simple graph H consisting of 7 vertices and 12 edges:

Let's try to color it in no more than 4 colors in every possible way. It turns out that there are 4 different ways to do this (accurate to rotations, reflections, and color order):

Note that in the upper two variants we have triples of monochromatic vertices, which are located at the vertices of a regular triangle, but in the lower two - not. We call the coloring of the graph H bad if there is such a one-color triple, otherwise the coloring H is good. Total, we have 2 bad coloring and 2 good.
Ok, let's move on. Consider a graph J glued from 13 graphs H (find them all!):
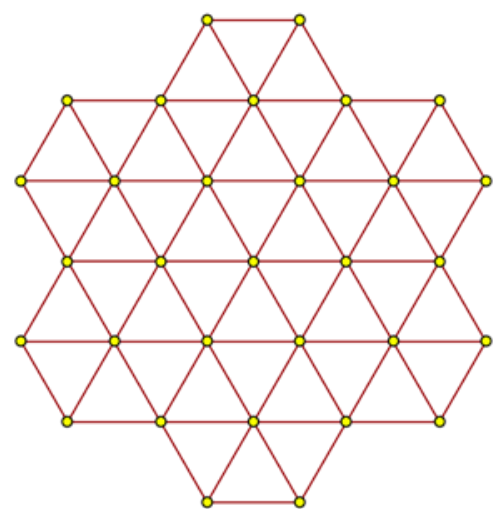
Let's try to color the graph J so that the colors of all the subgraphs H included in it are good. A little patience, and we get 6 different options (again, accurate to all equivalent transformations mentioned above; plus the colors of the vertices marked in black):

Black peaks can be painted in several ways, but painting them is not particularly important to us. Nevertheless, it is undesirable to throw them out of column J - then “extra” paint options appear. Which, in addition, spoils all further construction. Therefore, let the black peaks remain.
Now let's take a close look at the resulting options. Namely, to the central vertex and to 6 vertices remote from the central one by a distance of 2 (sort of graph H, doubled). We see that there are always used no more than two colors. Moreover, all options can be divided into 3 cases:
Let us remember these observations and move on to the graph K, which is composed of two copies of the graph J as follows: we superimpose one copy of J onto the other so that the central vertices coincide, and then twist them relative to each other so that each of the 6 vertices that we considered a little higher, one graph moved away from the corresponding vertex of another graph to a distance of exactly 1 (I marked these distances a little lower in blue). And here he is Count K:

Already getting a little complicated, isn't it?
Now let's meditate again on the resulting design. Namely, let's understand what types of coloring for each copy of column J could be one of those three that were listed above. Type a) there is no coloring, because no matter what type the second copy has, we get two vertices of the same color at a distance of 1. Type b) is not there either: if the second copy also has type b), then there are some 2 vertices the colors of the center “interfere” with each other; if the second copy has type c), then at least one vertex at the ends of the same-color diagonal will correspond to one of the four vertices of the first copy. Therefore, both copies of graph J have a painting type of c)! And such painting is possible, since 4 vertices that are painted in a color different from the central one, although they have the same color, in each of the copies this color may be different.
Now, since two copies of the graph J in the graph K have type c), then the pairs of opposite vertices (of the 6 we consider in each copy) have the same color. We will use this observation and take one more step. Namely, we construct the graph L from two copies of the graph K:
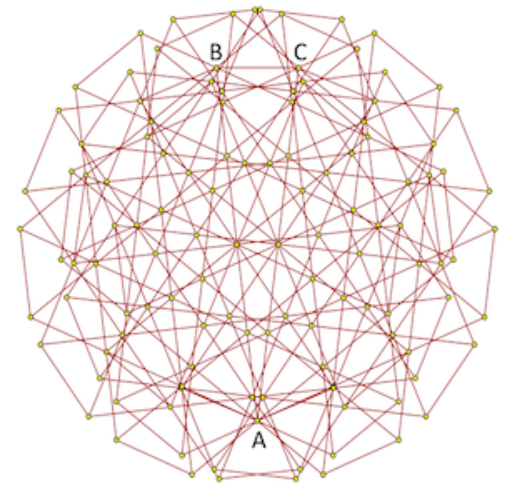
We superimpose the graphs K on top of each other as follows: we take in each of them a pair of opposite vertices and combine the first vertices in each pair (in the picture above it is marked with the letter A), and the second ones we place at a distance of exactly 1 (they are marked with the letters B and C) . This technique is called graph overlay (from the English spindling, where the spindle is a spindle). For example, the Moser spindle is the overlap of a rhombic graph made up of two triangles. According to the observation just above, the vertices A, B and C must be of the same color, B and C at a distance of 1, which means that the graph L cannot be colored.
So, what, have we proved everything? Well, no, we only proved that the graph L cannot be painted in 4 colors so that the coloring of all copies of the graph H (and there are already 52 pieces!) Were good. Therefore, in any coloring of the graph Lpainting at least one graph H will be bad !
Unfortunately, this part cannot be dealt with without the help of a computer. Therefore, we will analyze briefly the further part of the constructions; for details, you can refer to the original article, or follow the links to Polymath a bit below. Pictures taken from the original article are not of very high quality, but they allow you to roughly understand what is happening.
So, first we build graph V at 31 vertices, which consists of 5 graphs H, which are aligned by centers and rotated at tricky angles relative to each other:

Next, we construct graph W as follows: make 31 copies of graph V and place the center of each copy at each vertex of another graph V (this operation is called the Minkowski sum of two unit distance graphs, i.e., we do ), after which we delete all the vertices that are removed from the center by a distance greater
  . So now we have a graph W at 301 vertices:

Now take the graph H and replace each of its vertices with a copy of the graph W (i.e., do ) As a result, we get a graph M with 1345 vertices:

The resulting graph M is essentially the union of a large heap of Moser spindles in various positions. And, if we color three vertices in pairs at the same distanceof the original graph H, which we fluffed to M, thereby making the coloring of H bad, then the rest of the graph M cannot be painted in 4 colors. This fact is checked by computer brute force.
And, finally, the last step: we now take this tin M for 1345 vertices and copy over each of 52 copies of the graph H in the column L. As a result, we get the full tin for 20425 vertices, which is called the graph N. And this graph cannot be colored in 4 colors: when painting the skeleton L, painting at least one of the subgraphs H will turn out to be poor, and for this subgraph H the corresponding copy of M cannot be completely repainted.
Q.E.D.
A graph with 20,425 vertices is a rather large graph. Is it possible to build a smaller example? Can! Even in the original article, de Gray reduced the example to 1,581 peaks with various cutoffs.
After the publication of the article, the mathematical community organized the Polymath16 project (as it was, for example, with the problem of twins primes ) in order to collectively reduce the graph obtained by de Gray, generalize the result to large dimensions (for three-dimensional space, four-dimensional, and so further), or even improve the lower bound of the chromatic number for the plane to 6.
By the way, they also independently checked with the help of SAT-solvers that de Gray's example for the 1581 vertex can really be colored only in 5 colors, and also that its graph is a graph of unit distances. So there is no doubt about the correctness of the result.
Earl de Gray is slowly being reduced. For example, graph L by 121 vertices and 52 copies of graph H can be slightly reduced to graph L 'by 97 vertices and 40 copies of graph H. Graph M with 1345 vertices has been reduced to graph M' with only 278 vertices.
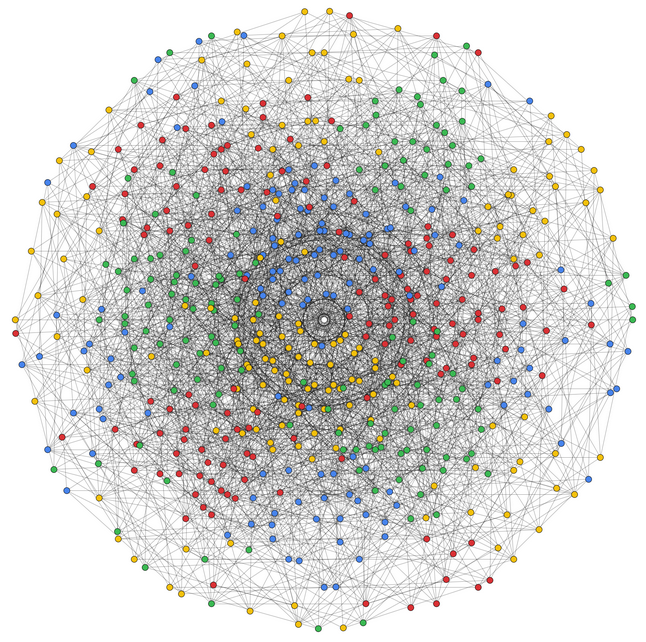
After replacing all the subgraphs H with M 'in the graph L', the result can be improved further. At the time of this writing, the smallest unit graph found, which cannot be colored 4 colors, has 610 vertices. Here is his picture (clickable):
Work continues. Maybe in the near future it will be possible to construct a graph of unit distances, which cannot be painted in 5 colors. And then - at 6, and then the problem of the chromatic number of the plane will be completely solved.
This task was formulated by Hugo Hadwiger and Pal Erdös in the forties of the XX century. Independently of them, at about the same time, Edward Nelson and J. R. Isbell were engaged in this task. After Hadwiger's 1961 work on problems open at that time, the chromatic number of the plane began to be actively studied.
It was immediately shown that in 3 colors the plane cannot be painted in the required manner, however 7 colors are enough. Indeed, it is easy to select several points on the plane so that some of them are at a distance of exactly 1 (such a design of points is called the unit distance graph), and then iterate over to show that it is impossible to color these points in 3 colors. Examples of such graphs - the Moser spindle and Count Golomba are shown in the picture below. To show that 7 colors are enough, tile the plane with regular hexagons with side 0.4 and paint them according to a specific pattern, as in the picture below. Then, as you can easily see, the ends of any segment of length 1 will lie in different hexagons of different colors.
However, since then no one has been able to clarify either the upper or lower bounds. The task was called the Nelson – Erdös – Hadwiger Problem . 60 years passed, and now, in April 2018, the amateur mathematician Aubrey de Gray presented a graph of unit distances, which cannot be painted in 4 colors.
Gerontology and mathematics
Aubrey David Nicholas Jasper di Gray - British gerontologist, explores various aspects of human aging. He is the developer of the SENS concept - “strategies for engineered negligible senescence”. Chairman and Director of Science, SENS Foundation, Editor-in-Chief of the academic journal Rejuvenation Research. He is the author of the popular science book “Ending Aging”, which details the issue of the complete victory over aging by means of medicine over the next few decades. (info from the wiki) As it turned out, this venerable bearded uncle is also interested in mathematics in his free time. On April 8, 2018, he posted an article on arXiv, which describes a method for constructing a graph of unit distances, for painting which you need at least 5 colors.
Let's take a closer look at what kind of graph this is.
Earl who built Jack
It all starts with a simple graph H consisting of 7 vertices and 12 edges:
Let's try to color it in no more than 4 colors in every possible way. It turns out that there are 4 different ways to do this (accurate to rotations, reflections, and color order):
Note that in the upper two variants we have triples of monochromatic vertices, which are located at the vertices of a regular triangle, but in the lower two - not. We call the coloring of the graph H bad if there is such a one-color triple, otherwise the coloring H is good. Total, we have 2 bad coloring and 2 good.
Ok, let's move on. Consider a graph J glued from 13 graphs H (find them all!):
Let's try to color the graph J so that the colors of all the subgraphs H included in it are good. A little patience, and we get 6 different options (again, accurate to all equivalent transformations mentioned above; plus the colors of the vertices marked in black):
Black peaks can be painted in several ways, but painting them is not particularly important to us. Nevertheless, it is undesirable to throw them out of column J - then “extra” paint options appear. Which, in addition, spoils all further construction. Therefore, let the black peaks remain.
Now let's take a close look at the resulting options. Namely, to the central vertex and to 6 vertices remote from the central one by a distance of 2 (sort of graph H, doubled). We see that there are always used no more than two colors. Moreover, all options can be divided into 3 cases:
- a). All 7 vertices are the same color.
- b) 4 vertices of 6 along the edges of the same color as the central one, and they go in a row to go around clockwise or counterclockwise. The remaining 2 vertices are in a different color.
- c) 2 vertices of 6 along the edges of the same color as the central one, and they are located diagonally relative to each other. The remaining 4 vertices are in a different color.
Let us remember these observations and move on to the graph K, which is composed of two copies of the graph J as follows: we superimpose one copy of J onto the other so that the central vertices coincide, and then twist them relative to each other so that each of the 6 vertices that we considered a little higher, one graph moved away from the corresponding vertex of another graph to a distance of exactly 1 (I marked these distances a little lower in blue). And here he is Count K:
Already getting a little complicated, isn't it?
Now let's meditate again on the resulting design. Namely, let's understand what types of coloring for each copy of column J could be one of those three that were listed above. Type a) there is no coloring, because no matter what type the second copy has, we get two vertices of the same color at a distance of 1. Type b) is not there either: if the second copy also has type b), then there are some 2 vertices the colors of the center “interfere” with each other; if the second copy has type c), then at least one vertex at the ends of the same-color diagonal will correspond to one of the four vertices of the first copy. Therefore, both copies of graph J have a painting type of c)! And such painting is possible, since 4 vertices that are painted in a color different from the central one, although they have the same color, in each of the copies this color may be different.
Now, since two copies of the graph J in the graph K have type c), then the pairs of opposite vertices (of the 6 we consider in each copy) have the same color. We will use this observation and take one more step. Namely, we construct the graph L from two copies of the graph K:
We superimpose the graphs K on top of each other as follows: we take in each of them a pair of opposite vertices and combine the first vertices in each pair (in the picture above it is marked with the letter A), and the second ones we place at a distance of exactly 1 (they are marked with the letters B and C) . This technique is called graph overlay (from the English spindling, where the spindle is a spindle). For example, the Moser spindle is the overlap of a rhombic graph made up of two triangles. According to the observation just above, the vertices A, B and C must be of the same color, B and C at a distance of 1, which means that the graph L cannot be colored.
So, what, have we proved everything? Well, no, we only proved that the graph L cannot be painted in 4 colors so that the coloring of all copies of the graph H (and there are already 52 pieces!) Were good. Therefore, in any coloring of the graph Lpainting at least one graph H will be bad !
Bad colors of graph H
Unfortunately, this part cannot be dealt with without the help of a computer. Therefore, we will analyze briefly the further part of the constructions; for details, you can refer to the original article, or follow the links to Polymath a bit below. Pictures taken from the original article are not of very high quality, but they allow you to roughly understand what is happening.
So, first we build graph V at 31 vertices, which consists of 5 graphs H, which are aligned by centers and rotated at tricky angles relative to each other:
Next, we construct graph W as follows: make 31 copies of graph V and place the center of each copy at each vertex of another graph V (this operation is called the Minkowski sum of two unit distance graphs, i.e., we do
), after which we delete all the vertices that are removed from the center by a distance greater . So now we have a graph W at 301 vertices:Now take the graph H and replace each of its vertices with a copy of the graph W (i.e., do
) As a result, we get a graph M with 1345 vertices:The resulting graph M is essentially the union of a large heap of Moser spindles in various positions. And, if we color three vertices in pairs at the same distance
of the original graph H, which we fluffed to M, thereby making the coloring of H bad, then the rest of the graph M cannot be painted in 4 colors. This fact is checked by computer brute force. And, finally, the last step: we now take this tin M for 1345 vertices and copy over each of 52 copies of the graph H in the column L. As a result, we get the full tin for 20425 vertices, which is called the graph N. And this graph cannot be colored in 4 colors: when painting the skeleton L, painting at least one of the subgraphs H will turn out to be poor, and for this subgraph H the corresponding copy of M cannot be completely repainted.
Q.E.D.
Reduced Count
A graph with 20,425 vertices is a rather large graph. Is it possible to build a smaller example? Can! Even in the original article, de Gray reduced the example to 1,581 peaks with various cutoffs.
After the publication of the article, the mathematical community organized the Polymath16 project (as it was, for example, with the problem of twins primes ) in order to collectively reduce the graph obtained by de Gray, generalize the result to large dimensions (for three-dimensional space, four-dimensional, and so further), or even improve the lower bound of the chromatic number for the plane to 6.
By the way, they also independently checked with the help of SAT-solvers that de Gray's example for the 1581 vertex can really be colored only in 5 colors, and also that its graph is a graph of unit distances. So there is no doubt about the correctness of the result.
Earl de Gray is slowly being reduced. For example, graph L by 121 vertices and 52 copies of graph H can be slightly reduced to graph L 'by 97 vertices and 40 copies of graph H. Graph M with 1345 vertices has been reduced to graph M' with only 278 vertices.
After replacing all the subgraphs H with M 'in the graph L', the result can be improved further. At the time of this writing, the smallest unit graph found, which cannot be colored 4 colors, has 610 vertices. Here is his picture (clickable):
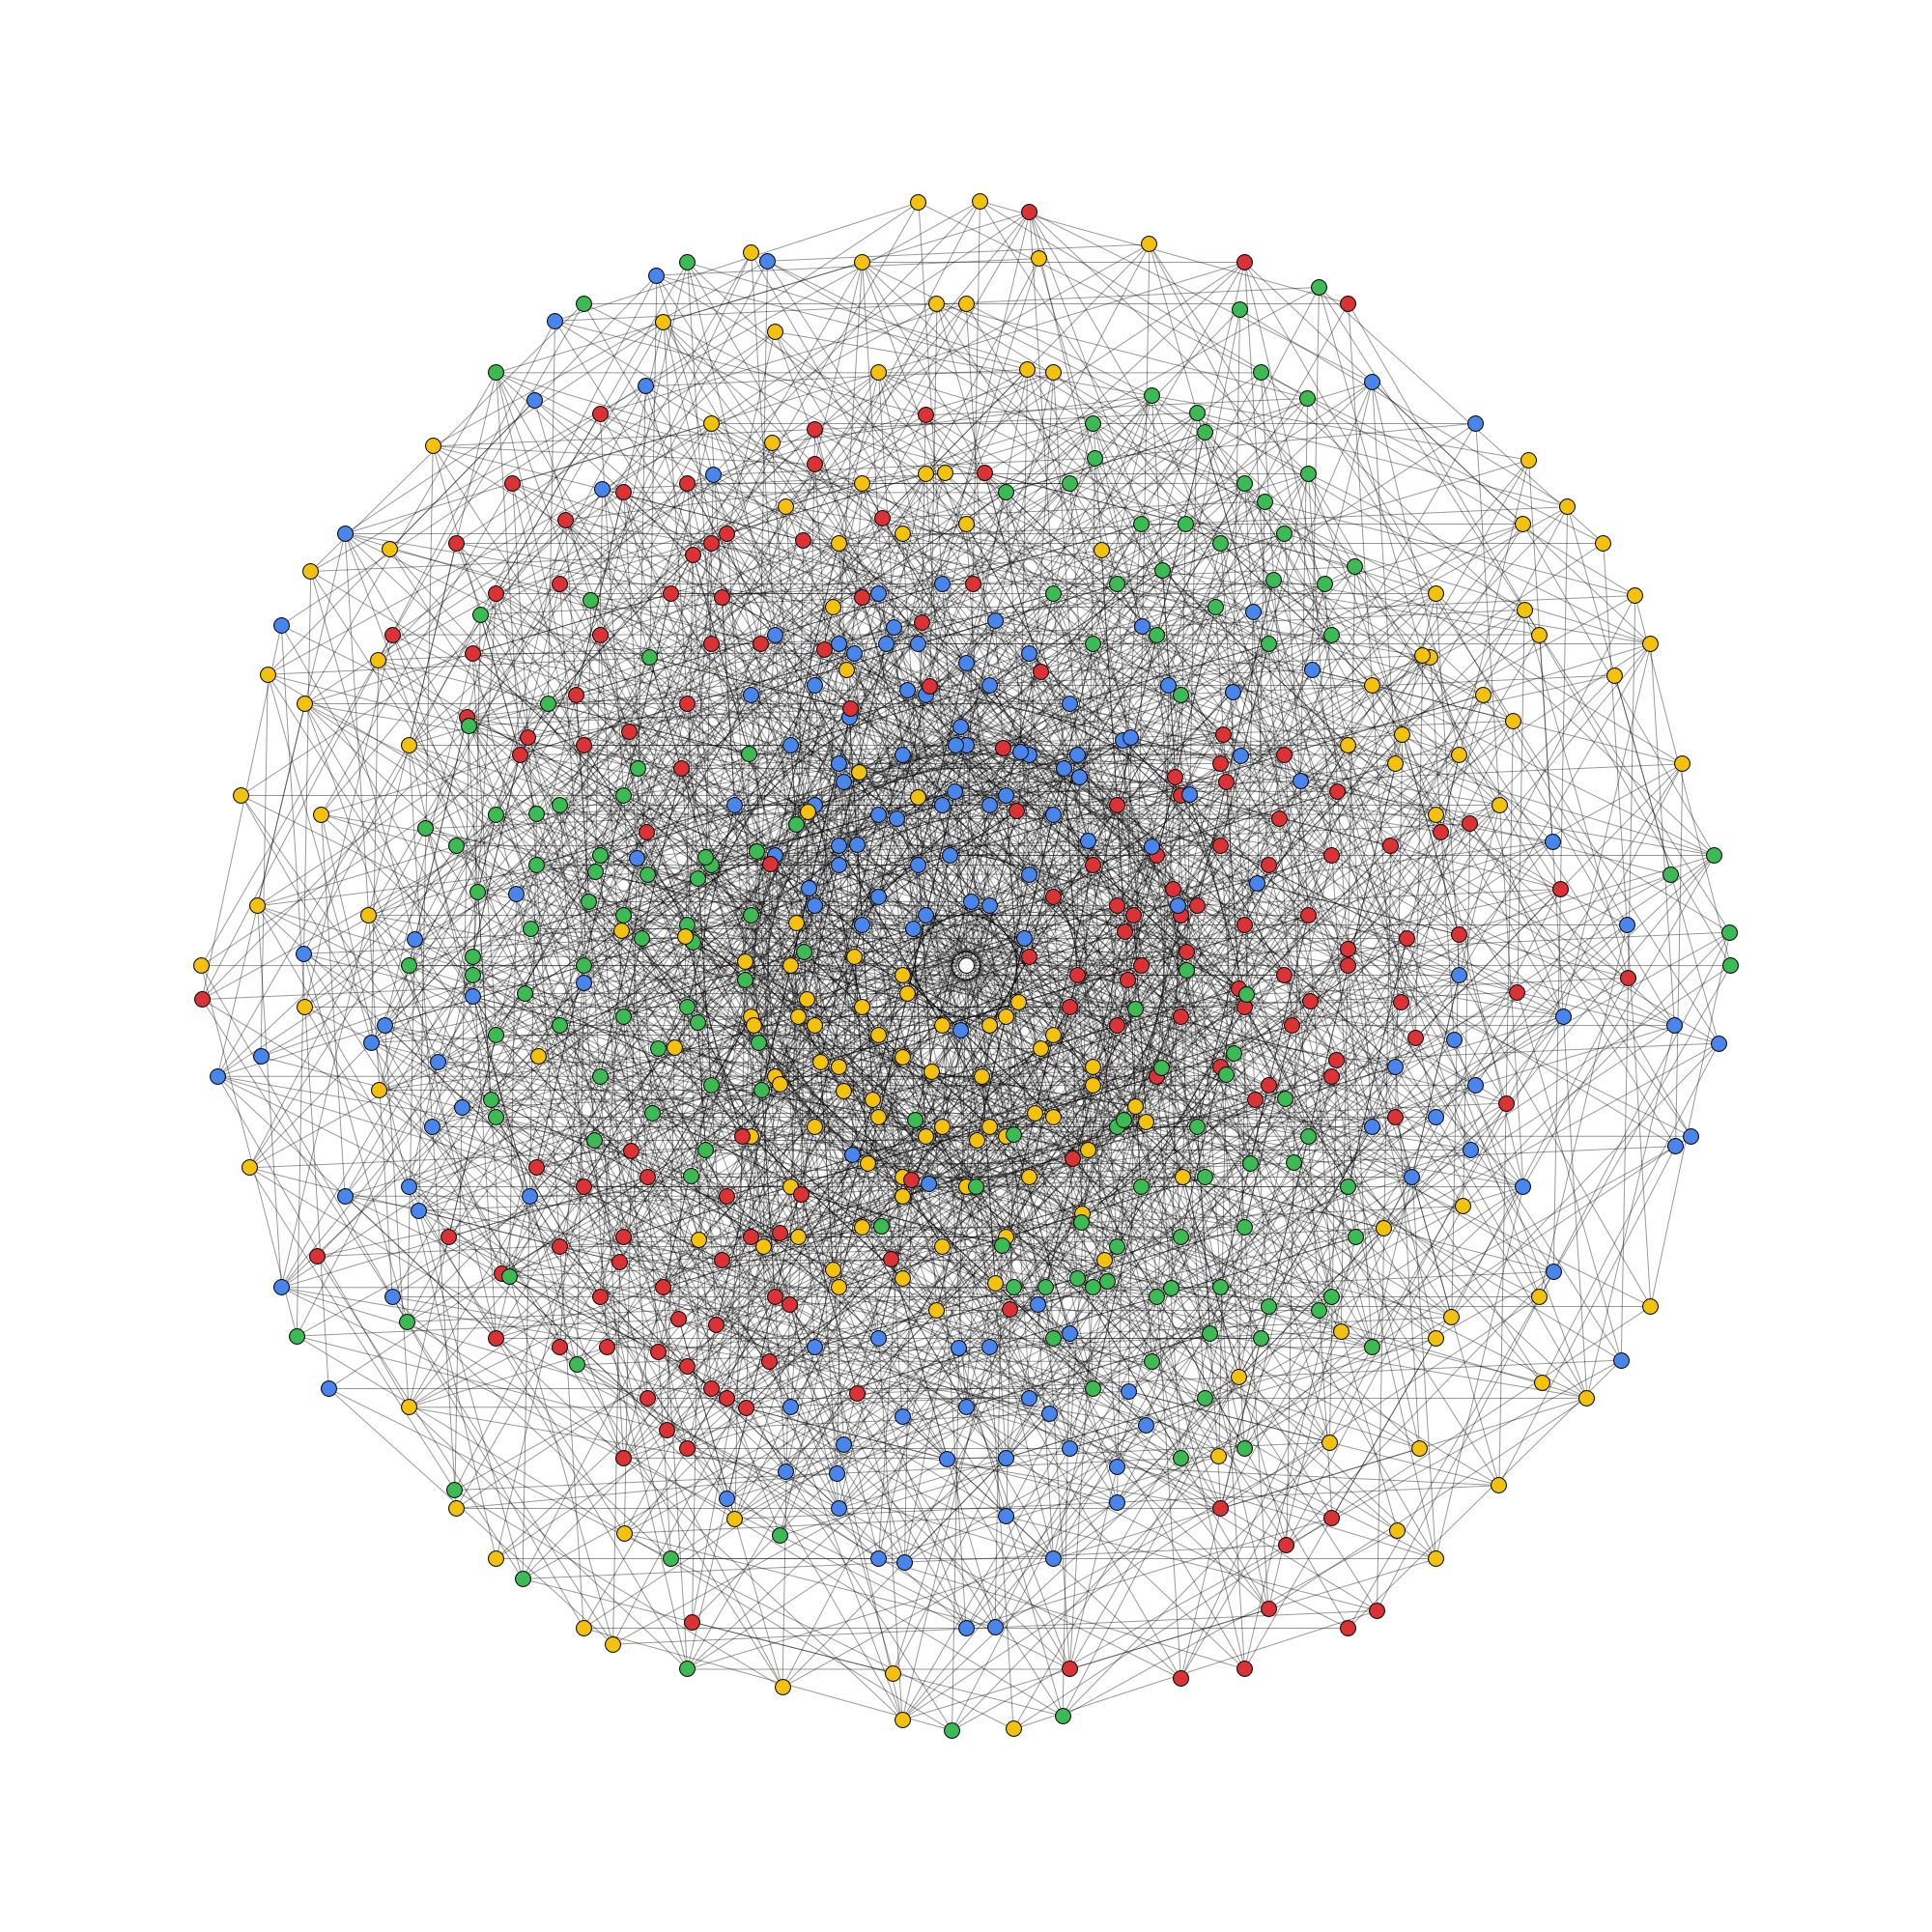
Work continues. Maybe in the near future it will be possible to construct a graph of unit distances, which cannot be painted in 5 colors. And then - at 6, and then the problem of the chromatic number of the plane will be completely solved.