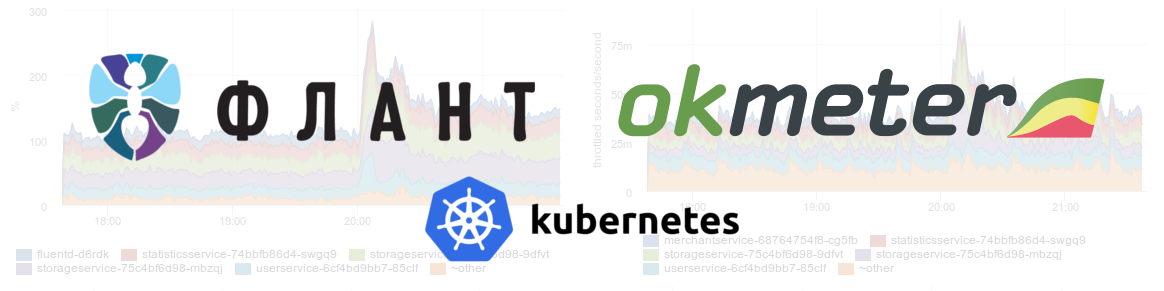
Flant and Okmeter: symbiosis for monitoring
Having passed a long way of system administration of Linux-servers, we managed to try different implementation options as basic tools for collecting statistics and monitoring. Self-written scripts (and even web applications), Cacti, Zabbix are the most well-established options at one time or another, which have been replaced by Okmeter and Prometheus in recent years. In this article, we have collected and combined: a) Okmeter's impressions of working with us, b) feedback from team leaders and Flant engineers on using Okmeter in numerous and varied projects that we serve (from small to large, from fairly trivial web installations hosting to Kubernetes clusters).
Why is Okmeter at all?
Choosing a Third-Party Solution - Okmeter- instead of the usual Zabbix self-hosted installations, supplemented by centralized monitoring of specific services (the correct functioning of web applications, executing backups, working cron tasks ...), it did not happen right away. In order for us to agree to “give into the wrong hands” such an important part of the operation process - collecting statistics and notifying the main part of the monitoring - we had to eat a lot of cacti. However, the accumulated thorns led to the understanding that there are two ways to completely close this issue: either do your development, or trust a ready-made solution, which, to our sincere regret, is not an Open Source product at all and to which really serious requirements are put forward (like at least the penalties recorded in the SLA depend on its quality,
Despite the fact that we have a small system development department, creating our own on the scale of a full-fledged monitoring system (and keeping it up to date) is not our priority activity (to put it simply, it’s long and expensive). Therefore, a year ago, the second path was chosen, and we do not regret the decision made. Why specifically Okmeter? There is no simple answer, but speaking in general, we liked the opportunities offered and the level of reliability, adequate financial conditions and prospects for cooperation (in particular, the possibility of finishing work on our requests).
How did this choice help in practice? If it is customary to meet people by clothes, then admins meet their tools for the convenience of configuration and further maintenance. And in the case of Okmeter, our engineers describe it like this:
“Metrics (and graphs) are really easy to add - just prepare JSON for Okmeter. Simplification of life is that we stopped installing and maintaining Zabbix, we do not waste time setting it up, we forgot that some graphics stopped drawing suddenly (although more often crooked hands were to blame). Basic alerts are automatically added when software is detected - this is very convenient, do not forget to add monitoring. ”
“In Zabbix, I had to screw on the templates myself, collect from different templates what we really needed, and here - op! - and immediately drawn. "
“Fortunately, one Okmeter installation can be connected to any database in the project. I even stuck RDS in AWS there. "
“For us and for clients, database metrics and nginx are very indicative and often used. We have a must have. Because in Zabbix you’ll draw such a fig. ”
Interaction
Despite the importance of these technical amenities, they were not the only determining factor. The fundamental importance of our cooperation was brought by the opportunities for mutually beneficial exchange of the results of core activities.
From the Flant side it looks like this:
- In some of the projects there was a non-standard problem.
- We could not identify it or (quite exhaustively / systemically) understand it on the basis of these graphs.
- We analyzed what additional monitoring capabilities (what data, where, in what form) would help improve the situation (i.e. our actions and understanding) next time, and passed this information to Okmeter.
- Received improvements that have spread to all of our projects.
Events unfolded in this way more than once and made it possible to make additions to monitoring the operation of such services as, for example, Sphinx, php-fpm, Postfix ...
There were other interaction scenarios - for example, on the tip of our engineers, some triggers for MySQL proved to be useless, as well as dozens of bugs were found and fixed in plugins for the same MySQL, Linux cgroups and others.
All this has obvious benefits for Okmeter: service developers are actively expanding their knowledge base thanks to a large number of different clients and thanks to consultations on specific issues. But back to the technical side: how exactly do we use Okmeter and what do we particularly value?
Exploitation
1. General diagnostics
The first and most obvious application is the daily maintenance of Linux servers, for which we are especially actively using features such as:
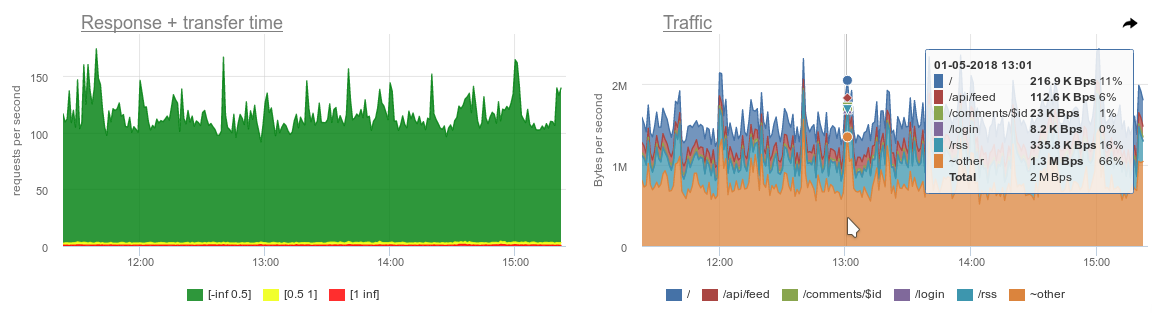
- graphs of the load on system resources (processor, disk, memory) by processes, as well as top by requests (the latter is very important for investigating accidents after the fact - it is clearly visible, for example, that some process ate all the memory an hour ago);
- nginx charts, server response time charts, request charts for different URLs (grouped without GET parameters);
- statistics of connections by ports and addresses;
- top queries in the database, which, as one of our engineers put it, is "divine."
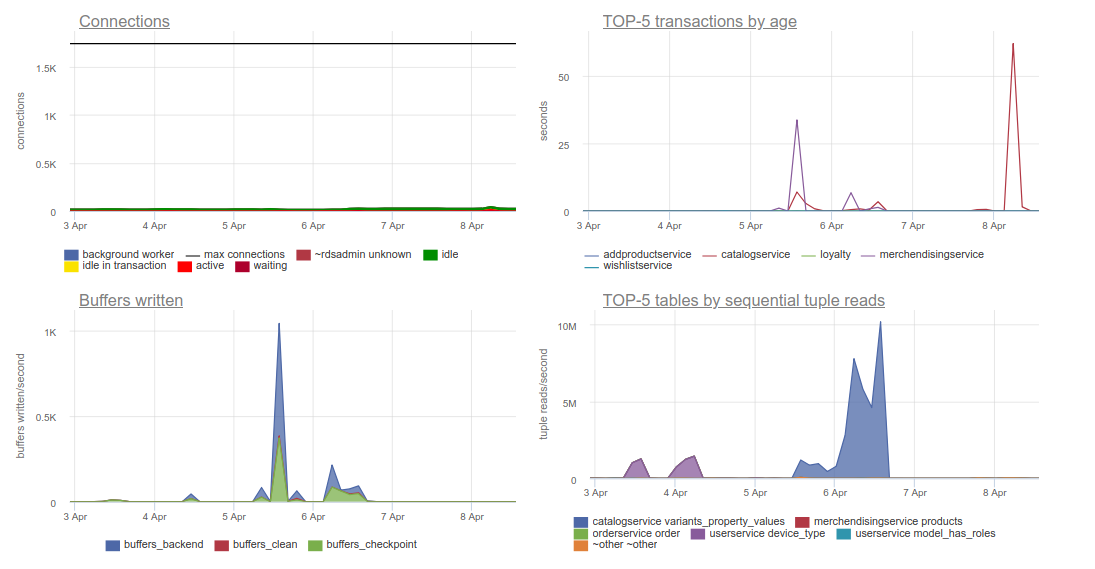
The surge in age (transaction duration) in the chart at the top right is a result of restoring a database without an index
2. Audit
Another common use of Okmeter with us is the audit of new projects. Having not yet started the service and only having signed the preliminary NDA, we issue the client a command to execute on all servers. Result - we see many metrics obtained using automatic service discovery.
Thus, statistics are quickly added even to a large number of servers, and the resulting standard graphs allow you to immediately see a number of indicators that help to understand the state of the infrastructure and form the first goals for its optimization / development:
- what processes are on the servers and how much resources are consumed;
- DBMS and web server loads
- database sizes (relevant for Elasticsearch);
- … etc.
3. Containers
In the context of the specific operation of Kubernetes clusters, Okmeter does not have so many things. Nevertheless, the graphs of resource consumption by container (or will give Kubernetes) are already familiar to us must have, especially relevant because of the problematic output
docker statsin cases of a large number of containers deployed in K8s. 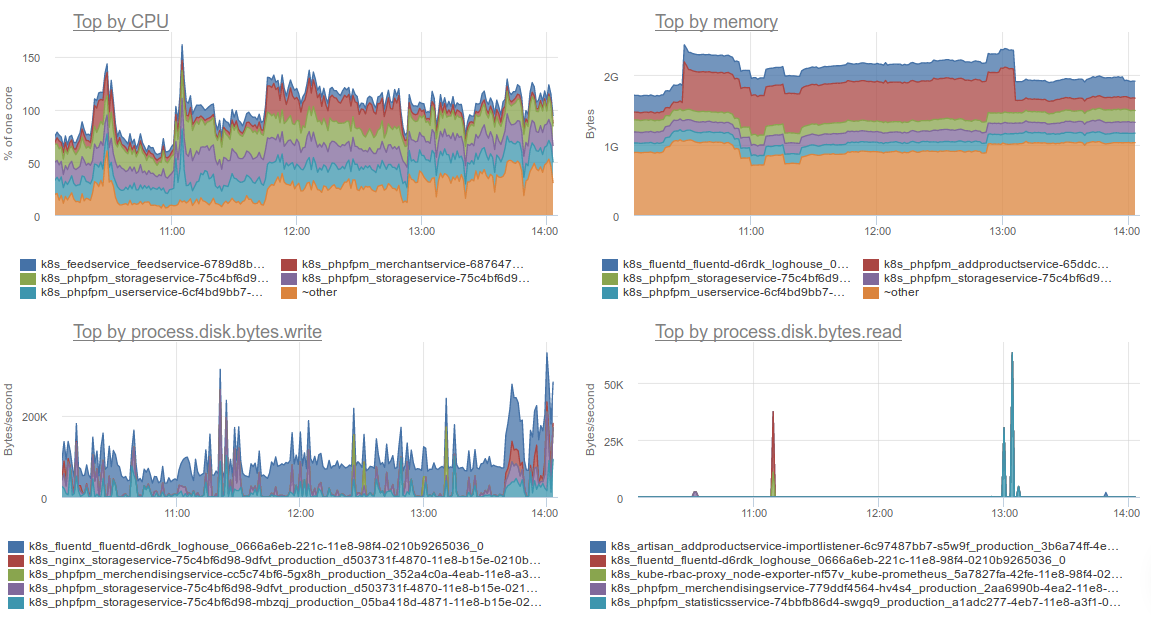
a) Consumption of resources by container
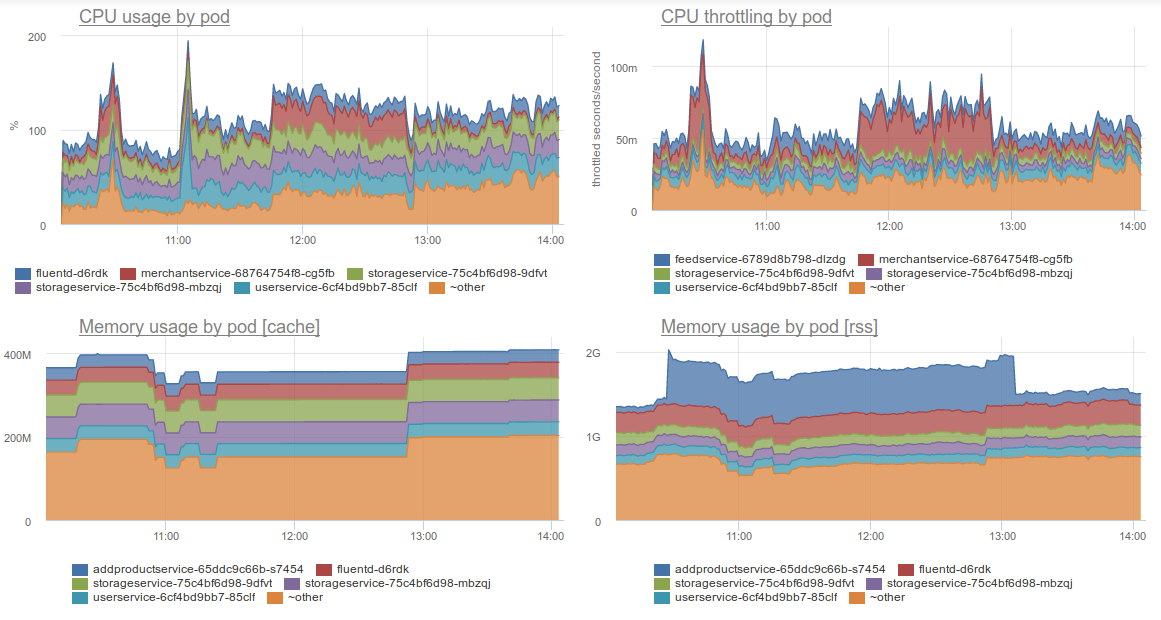
b) Consumption of resources by pod
Full support for Kubernetes has just begun to appear, so we now use Prometheus more to monitor K8s-specific indicators . But it is also known about the prospects of Okmeter in this direction ...
Okmeter and Kubernetes
Talking about the interaction of Flant and Okmeter as a whole (see above) , we deliberately omitted one specific and most intense area of joint interests - Kubernetes. Okmeter engineers use our Kubernetes knowledge and experience to develop K8s monitoring in their service.
First of all, these are live clients, that is, clusters with K8s used in production. Each such installation is a useful data source for Okmeter, allowing you to see how Kubernetes functions in real life, what are the specifics and problems of its application, which is really important for its users.
Secondly, we (as such calls arise) talk about how Kubernetes is structured, how it is deployed by specific users, and also “how it explodes” (which problems exist and what to look at first).
All this allowed Okmeter not only to improve his knowledge of Kubernetes, but also to make sure that this system is promising on the market as a whole. The presence of experts “within walking distance” also led to the rapid implementation of K8s for their own needs, which corresponds to the dogfooding approach used by the company , and also contributed to the work on supporting Kubernetes in the service itself.
What promise in this very support?
- Distribution of cluster resources between the services launched in K8s. All metrics can be viewed in the context of any K8s entities: from Deployment to a specific container in a specific hearth.
- Automatic triggers to exhaust the service resource limit.
- Problems in the work of services: restarting containers, inability to start the required number of instances, etc.
- Capacity planning: how many resources are already “reserved”, how many are left.
- Status of K8s components: etcd, dns, apiserver, etc.
The main idea is a constant audit of Kubernetes basic settings, created on the basis of recommendations from Flanta engineers. And of course, there will be an Okmeter agent deployment in the form of DaemonSet .
The described features are already starting to appear in beta testing mode (it is better to contact NikolaySivko for details ) , and their full release is expected by September.
Summary
The available results of the cooperation between Okmeter and Flant are symbiosis and synergy: we got a ready-made tool that plays an important role in our business (but is not rational enough for internal development), with the possibility of improving it according to emerging needs, and the service is a vast ground for replenishment of their knowledge and professional assistance on specific technical issues. At the same time, during the cooperation, there is a trend in operation from "ordinary" projects to Kubernetes clusters, and the development of Okmeter in the corresponding direction.
PS
Read also in our blog:
- “ The device and mechanism of operation of the Prometheus Operator in Kubernetes ”;
- “ Monitoring with Prometheus in Kubernetes in 15 minutes ”;
- “ 10 obvious steps to prepare the infrastructure of the online store for Black Friday ”;
- “ Our experience with Kubernetes in small projects ” (video report, which includes an introduction to the technical device of Kubernetes) ;
- “ Infrastructure with Kubernetes as an affordable service .”