April 26, 2018 at 23:00
Quest to eliminate cardiac arrhythmias
Hello, Habr! Today we offer to go on an exciting journey into the very heart of the human body (in the literal sense of the word) to find out how the sources of arrhythmia are found and neutralized.
Physiology
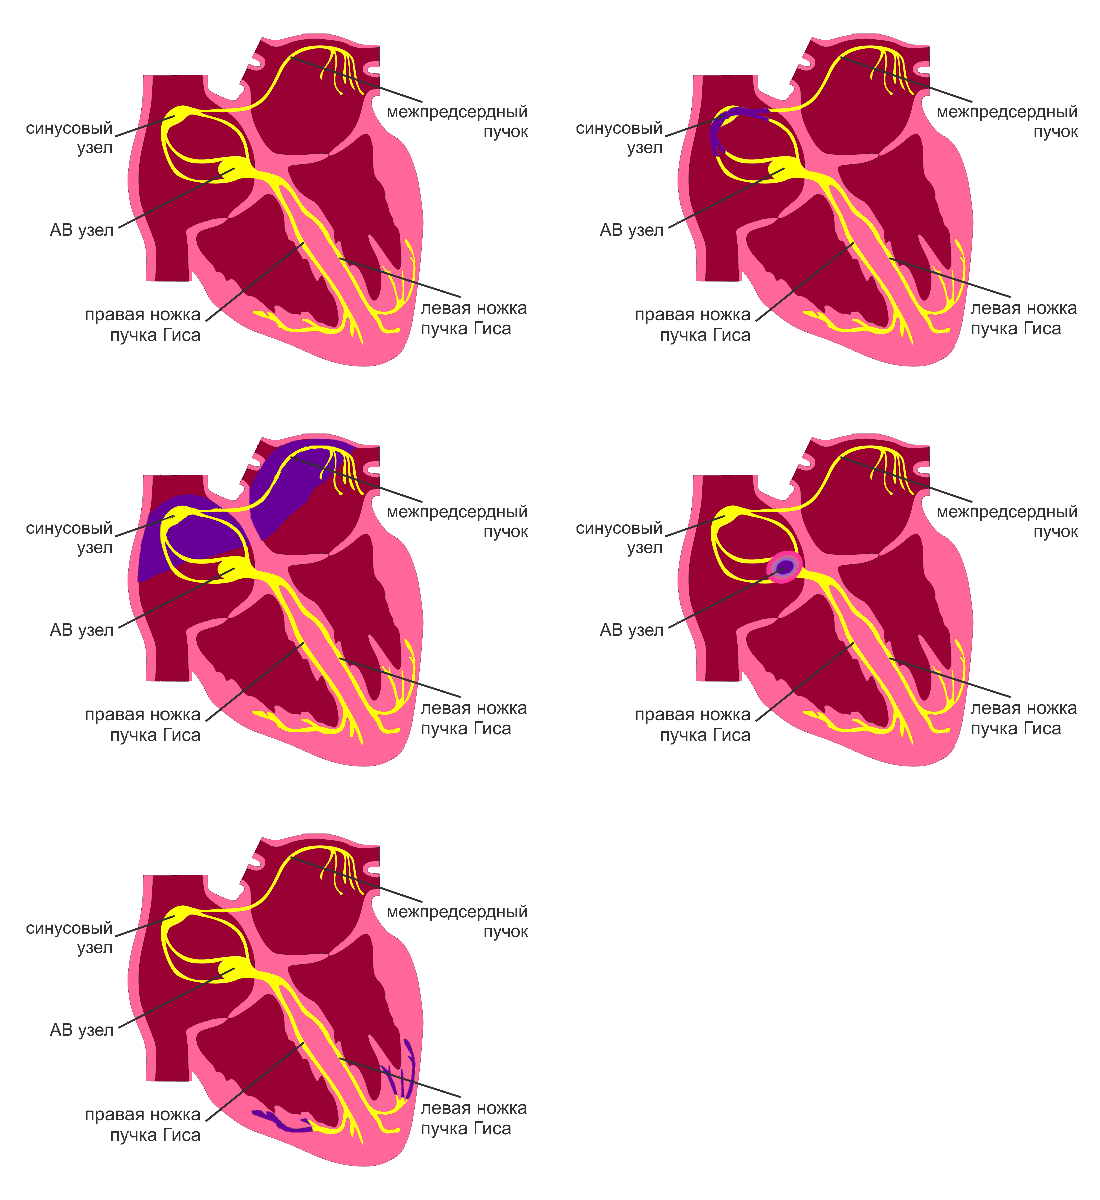
Before you talk about the operation itself and the methods of its implementation, you need to understand physiology. The heart has an automatic function, i.e. capable of generating electrical impulses independently. Only the cells of the sinus node and the conduction system of the atria and ventricles possess the function of automatism. The heart also has a conduction function - this is the ability to conduct excitement. Due to the generation of electrical impulses and their conduction, the heart contracts. Normally, the only pacemaker is the sinus node, which suppresses the automatic activity of the rest of the pathogens. This node is located in the wall of the right atrium. The figure below shows the normal distribution of excitation.
Getting to the operation
For various reasons, some heart cells can impose their rhythm. In this case, there is a violation of the frequency, sequence of excitation and contraction of the heart. This is a type of arrhythmia. The result can be a number of serious complications. However, the cells of the intruders can be neutralized with the help of so-called catheter ablation. This is a minimally invasive intervention, during which special catheters are inserted into the heart cavity.
The catheters used are thin flexible tubes with several electrodes (poles) at the end. Poles are capable of both conducting impulses in and from the heart. Catheters vary in shape and number of poles.
Catheters can be inserted in the inguinal region, on the arm, shoulder or neck. The place depends on which part of the heart is planned to operate. Local anesthesia is sufficient for the operation. A small incision is made on the skin and a blood vessel is punctured with a needle. Then, one or more catheters are inserted into the incision. Catheters are carried through blood vessels into the desired chamber of the heart.
There are types of arrhythmias when a cardiologist can determine the location of problem areas before surgery. But this is not always possible. In such cases, operations are technically complex and time consuming. Without special support, most of the time the doctor has to act "blindly." Usually, doctors use x-ray equipment to navigate. But this approach allows you to see only a flat picture and does not give an understanding of the spatial position of the catheter. In addition, the patient and staff are exposed to radiation.
Let's consider how using modern technologies we can simplify the task and find an undesirable source. As an example, let's take one of the types of arrhythmia - ventricular extrasystole.
Positioning
Let's start with the navigation. There are options to programmatically calculate the position of the catheters. Let us dwell here on a method based on measuring the potential difference between the electrodes. The main advantage of this approach is that standard catheters can be used.
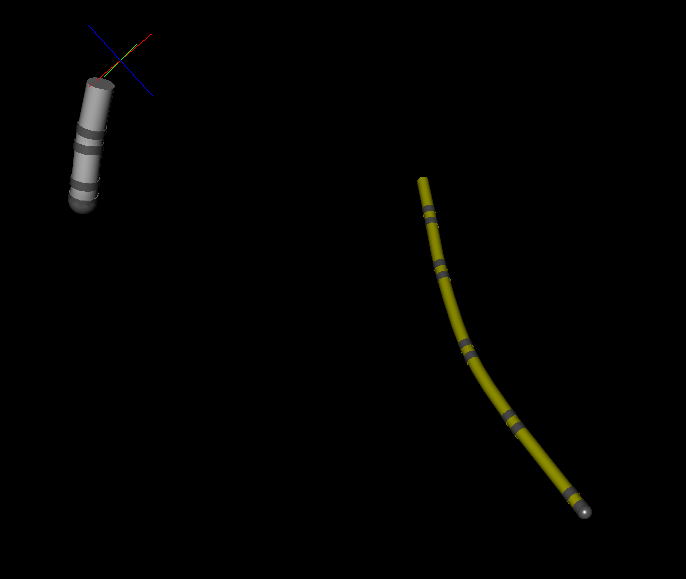
To ensure maximum accuracy, at least two catheters are required. At the first catheter, a support pole is selected, with respect to which all calculations will be performed. It was found that such a pole is more convenient to place in the coronary sinus (a blood vessel flowing into the right atrium). Firstly, this point is the least mobile during the work of the heart, which minimizes navigation errors. Secondly, from this point you can catch the impulse from any part of the heart, which will be important when building a map. Throughout the operation, the position of the support pole should not change. The second catheter is called a mapping. It is this catheter that will move in the cavity of the heart and be used to locate rhythm disturbers. To determine its position relative to the reference on the surface of the patient’s body, three pairs of electrodes are installed. Electrodes from one pair are located on different sides of the body, and the pairs are mutually orthogonal (chest - back, left - right side, neck - thigh). Between the electrodes of one pair, an alternating current is introduced. To avoid overlapping frequencies, a separate frequency is set for each pair.

Throughout the operation, the potential difference between the poles of the mapping catheter and the reference is calculated. Moreover, we get the potential difference along three orthogonal axes. In the heart, the potential change linearly depends on the distance of the catheter from the current sources. This allows, multiplying volts by a certain coefficient, to proceed to the determination of coordinates in millimeters. Thus, without any magic, it is possible to determine the relative position of conventional electrodes. In the image, gray is a mapping catheter, yellow is a reference catheter.
Building a heart model
While the movement of the catheter relative to the reference point for the surgeon does not carry important information. But thanks to this, it became possible to build a 3D model of the heart. Before constructing the surface mesh, the program defines the reconstruction area. This is the area within which the operated heart is located. To do this, place the mapping catheter in the center of the heart. It is also necessary to indicate the size of the reconstruction area. Usually a radius of 10 cm is enough for mapping. Next, the resulting cube is divided into voxels with a given size. A voxel is an element of a three-dimensional image, a kind of three-dimensional analogue of a pixel. Each voxel may contain a specific value. In our case, 0 and 1 will be used as the value. A value of 0 means that the voxel is outside the heart. 1 - value is set, voxel inside the model. Initially, all voxels are not installed.
After the initial data are indicated, you can begin to build a model of the heart. When moving the catheter, its coordinates are compared with the coordinates of the voxel. If the coordinates of the voxel coincide with the coordinates of the catheter, then this voxel is set to 1. During the construction of the model, the doctor gradually brings the catheter to the walls of the heart. Thus, a voxel model of the entire cavity of the operated department is gradually built.
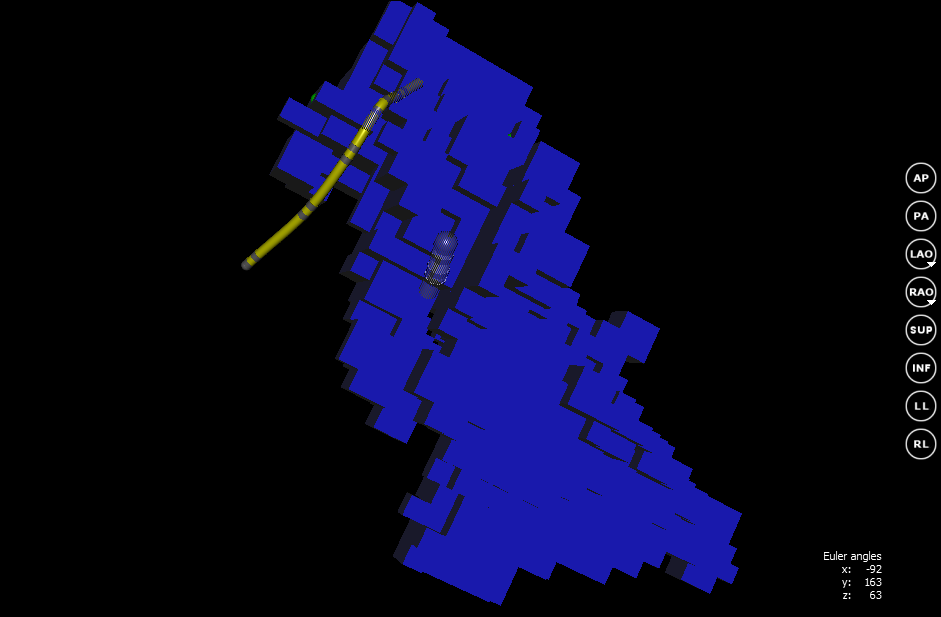
We are primarily interested in the inner surface. To do this, based on the voxel model, a grid is constructed using the Marching cubes algorithm . The essence of this algorithm is that for each voxel, based on its neighboring ones, a certain part of the surface is specified. The result is a closed surface “covering” the voxel model.
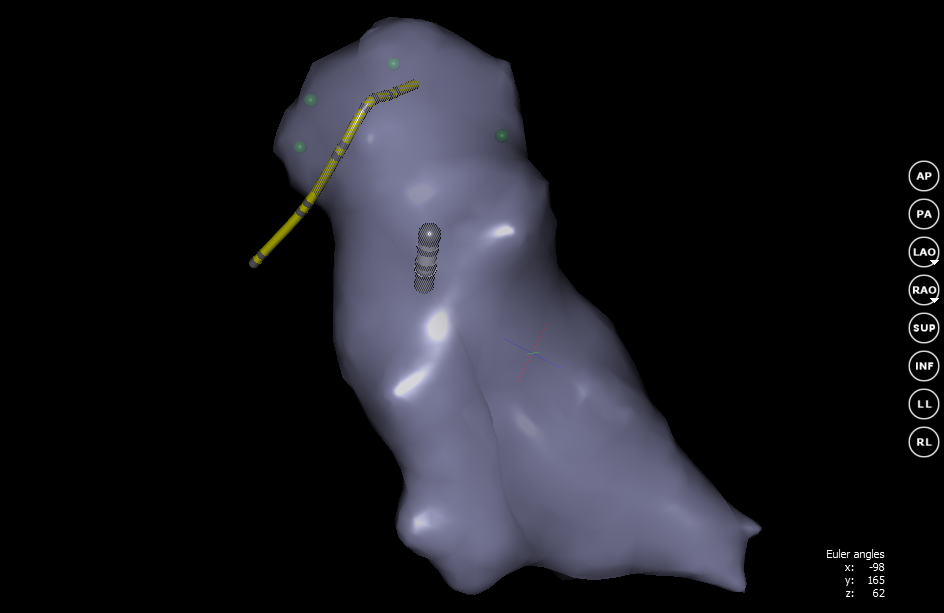
The rebuilding of the grid occurs constantly in the process of changing the voxel model. The screen immediately displays a surface without a voxel model. When the grid is fully ready, the 3D model creation mode is turned off. Further changes in the position of the catheters do not affect the geometry of the mesh.
In our case, to better match the real picture, you can cut out part of the grid, thereby designating the valve of the right atrium.
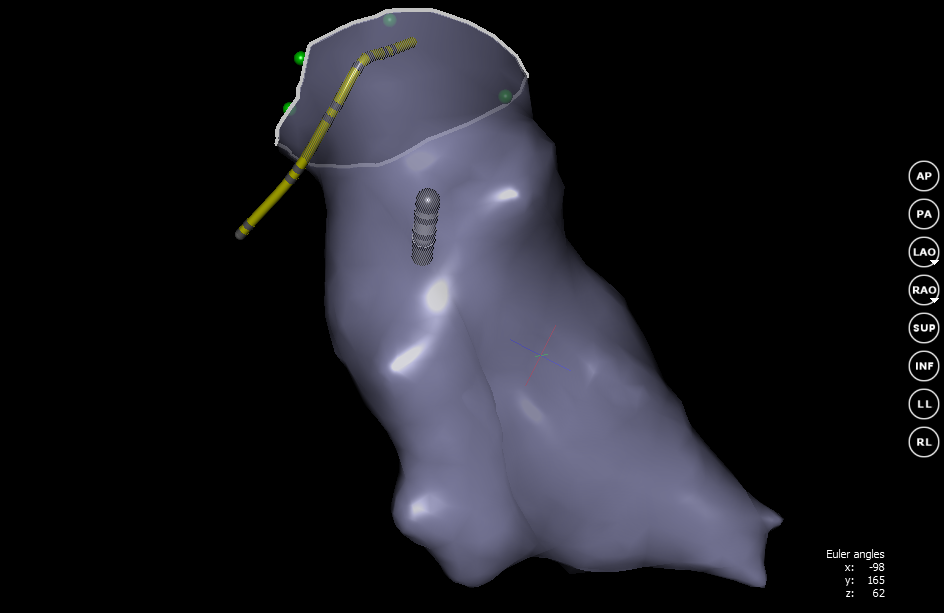
The result is the inner surface of the desired department. Now the doctor sees the movement of the catheter relative to the walls of the heart. Thanks to this, it becomes much easier to control the catheter and you can begin to search for rhythm violators.
Map building
The next stage is the study of the spread of excitation through the myocardium. It is worth noting that during the entire operation from the connected catheters and standard leads, ECGs are recorded in the same timeline.
The study is as follows. The doctor leads the mapping catheter to the wall of the heart and takes data. One of the main indicators is the activation (excitation) time at this point. The moment of excitation can be determined by the electrocardiogram from the pole of the mapping catheter. During activation, an ECG will have a tooth. The activation moment on the schedule can be set either by the doctor manually, or determined automatically.
Then the lag time is calculated. This is the time difference between activation at the test point and activation recorded on one of the leads. Such leads can be either the poles of the supporting catheter or chest leads. In our case, we will use the standard lead III. Thus, we compare the moment of excitement at a particular point with the average value of excitation in the whole heart. In the example below, the red dot marks the moment of activation from lead III, green from the mapping catheter.

The cardiologist may, at his discretion, decide which data should be considered and which not. Let's see why this is important. For the type of arrhythmia under consideration, sources of unwanted excitation manifest themselves with a certain interval (often unstable). In the intervals between an extraordinary contraction of the heart, an excitation pulse propagates in the usual way, and the ECG from standard leads has a normal appearance. The spread of normal arousal has been well studied and is not of interest during surgery. The doctor is interested in the spread of excitement from the rhythm violator. You can determine the occurrence of an unwanted pulse (extrasystole) by ECG from standard leads. The ECG at this moment has a deviation from the normal form. This is the time to take readings from the surface of the heart.
Sometimes extrasystoles appear too rarely during surgery. In such cases, the surgeon can artificially provoke arrhythmia using electrical impulses transmitted from the catheter. Under the control of specialists in the operating room, such stimulation is quite safe.
If the data of interest is obtained, the doctor records the results and they are saved. On the 3D model of the heart, a point is set in the place where the catheter was located. Now you can begin to study a new point. So, alternately moving the catheter from one point to another, readings are taken from the inner surface of the mapped section. In general, it takes from several tens to hundreds of points in complex cases. Based on the lag time using interpolation, an isochronous map of myocardial activation is constructed.
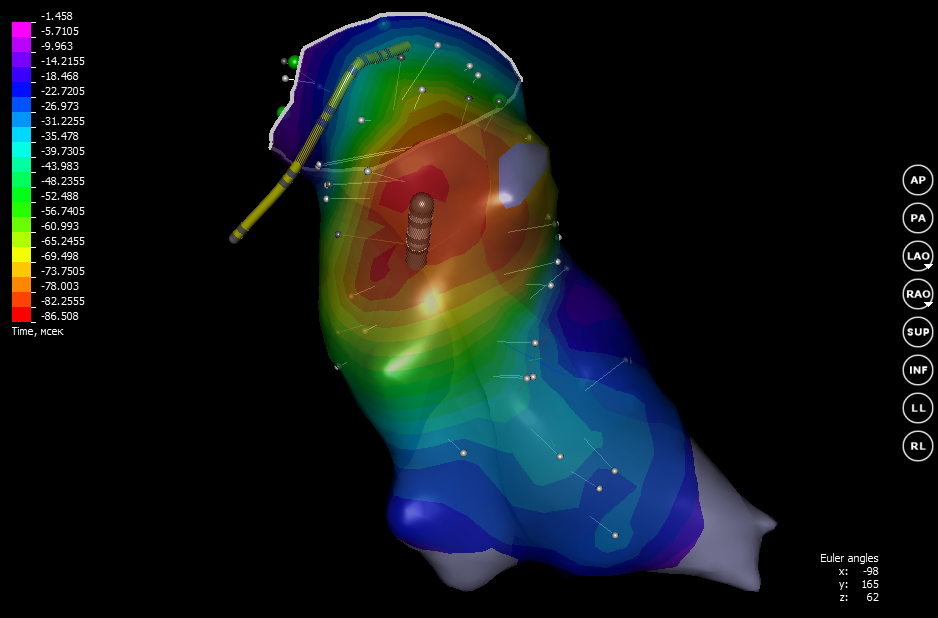
On such a map, the color indicates the activation time. Excitation spreads from red to purple. The isochronous map can be displayed in a slightly different form: to show the picture not as a whole, but to display the distribution of excitation only at a certain point in time. Such a card is called an activation card.
Eliminate unwanted source
On the maps constructed in this way, the propagation of excitation along the myocardium and, most importantly, the sources of excitation themselves are clearly visible. As a result, the doctor knows exactly where it is necessary to act to eliminate arrhythmia. The process of neutralization of arrhythmogenic zones is as follows:
- Relying on the constructed map, the doctor presses the pole of the catheter to a point on the heart that generates unwanted impulses
- A high-frequency current is delivered through the catheter. Electric energy is converted into heat. Due to the high conductivity of the pole, it is not the pole itself that is heated, but the tissue surrounding this electrode. Heating is adjusted to 45 degrees Celsius. As a result, a small area of cardiac tissue in which the pathological pathway passes is destroyed. Important: the catheter with which the operation is performed must have temperature sensors. This is due to the fact that you need to constantly monitor the heat, because at higher temperatures it is possible to cause serious damage to the heart cells.
- After all unwanted lesions have been eliminated, pulse propagation measurements are again performed to evaluate the effectiveness of the operation.
Instead of a conclusion
There are other ways to program navigation with its pros and cons. So, for example, positioning based on magnetic fields has higher accuracy, but special expensive catheters are required for such systems.
This article showed a basic example of an operation in a simplified form. In the framework of one article it is impossible to describe all the details and types of operations.
Thank you for your attention and be healthy!