Trace JS ↔ DOM, or There and back
- Transfer
Searching for memory leaks in Chrome 66 has become much more convenient. DevTools can now trace, make snapshots of DOM objects from C ++, display all available DOM objects from JavaScript, along with links to them. The appearance of these features was the result of a new C ++ tracing mechanism in the V8 garbage collector.
Let me remind you that stable Chrome now (03/20/2018) has version 65, so in order to marvel at the feature, you will have to install one of the unstable assemblies (for example, Beta has version 66, and Dev and Canary - 67).
The basics
Memory leaks in garbage collection occur when an object that is no longer needed is not collected due to unintentionally added links from other objects. Memory leaks in web pages often occur when JS objects and DOM elements interact.
Let's look at a toy example showing a leak that occurs when a programmer forgets to remove an event handler. The handler refers to objects, and they can no longer be deleted. In particular, an iframe is leaking.
// Main window:
const iframe = document.createElement('iframe');
iframe.src = 'iframe.html';
document.body.appendChild(iframe);
iframe.addEventListener('load', function() {
  const local_variable = iframe.contentWindow;
  function leakingListener() {
    // Do something with `local_variable`.
    if (local_variable) {}
  }
  document.body.addEventListener('my-debug-event', leakingListener);
  document.body.removeChild(iframe);
  // BUG: forgot to unregister `leakingListener`.
});
Even worse, a leaked iframe keeps all of its JS objects alive.
// iframe.html:
class Leak {};
window.global_variable = new Leak();
To find the cause of a leak, it is important to understand the concept of a retaining path. A suspended path is a chain of objects that interfere with the assembly of a leaking object. The chain starts from some kind of root object, like the global object of the main window. The chain ends with a leaking object. All intermediate objects have a direct link to the next object in the chain. For example, the suspended path of an object in Leakthis iframe looks as follows:
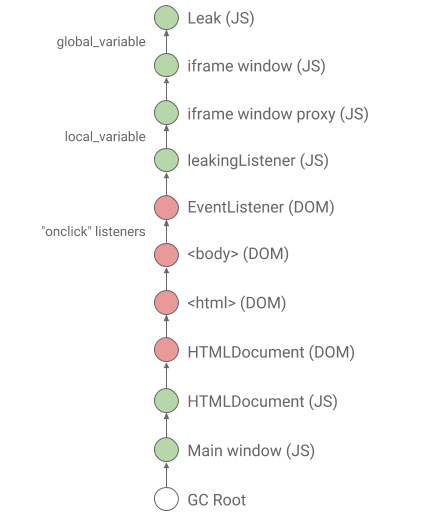
Notice that the suspended path goes through the border between JavaScript and the DOM (they are marked in green and red, respectively) as much as two times. JS objects live on the V8 heap, and DOM objects are C ++ objects in Chrome.
DevTools heap snapshot
Now we can explore the suspended path of any selected object using a heap snapshot. In this case, all objects located in the V8 heap will be saved exactly. More recently, only very approximate data about C ++ DOM objects was stored there. For example, Chrome 65 shows an incomplete suspended path for an object Leakfrom a previous toy example:
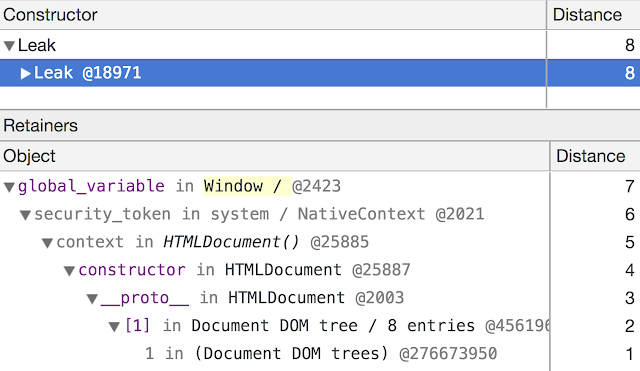
Only the first line is accurate enough: the object is Leakreally stored global_variablein the iframe window. All other lines try to approximate the real path, and this makes debugging a memory leak very difficult.
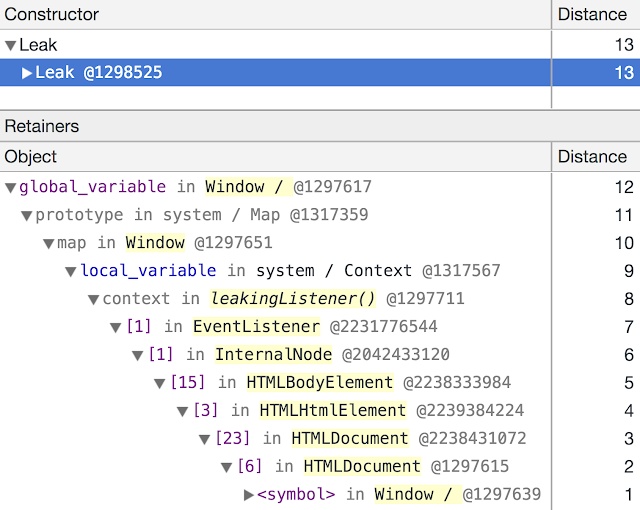
Starting with Chrome 66, DevTools traces C ++ DOM objects, and accurately captures objects and links between them. This feature is based on a new powerful mechanism for tracing C ++ objects, which was created for cross-component garbage collection. As a result, the paths in DevTools have become correct!
Guide to action
File for experiments: https://ulan.github.io/misc/leak.html
Under the hood: cross-component tracing
DOM objects are managed using Blink, the rendering engine used by Chrome, which translates the DOM into real text and images on the screen. Blink and its internal DOM implementation are written in C ++ - and this means that the DOM cannot be directly reflected in JavaScript. Instead, objects in the DOM seem to be divided into two parts: a wrapper accessible from JS, and C ++ - an object that is a representation of a node from the DOM. These objects contain direct links to each other. Determining the lifetime and ownership of components that cross the boundaries of several systems, in this case, Blink and V8, is a rather difficult task, because it involves parties who need to agree in advance which components are still alive and which should be disposed of.
In Chrome 56 and older (for example, until March 2017), Chrome used a mechanism called object grouping. Objects are linked into one group if they belong to the same document. The group, and all its objects, are kept alive as long as there is at least one living object at the end of another suspended path. This makes sense in the context of DOM nodes, which are always associated with the documents containing them, forming the so-called DOM trees. But this abstraction loses all the real suspended paths, which previously made debugging very difficult. As soon as objects ceased to fit the above scenario (for example, JavaScript closures used as event handlers), implementing this approach became difficult and led to bugs in which JS wrappers were assembled ahead of time,
Starting with Chrome 57, this approach has been replaced by "cross-component tracing" - a mechanism that determines the liveness of objects, tracing them from JavaScript to the C ++ implementation in the DOM, and along the same path back. On the C ++ side, incremental tracing is implemented, which creates write barriers so as not to slip into stop-the-world. Cross-component testing not only improves latency, but also better approximates the liveliness of objects at the boundary of components, and repairs several frequently occurring scenarios that previously led to leaks. In addition, thanks to this, DevTools got the opportunity to make snapshots that really reflect the state of the DOM.
Minute of advertising. As you probably know, we are doing conferences. The next JavaScript conference is HolyJS 2018 Piter , which will be held May 19-20, 2018 in St. Petersburg. You can come there, listen to reports (what reports are there - described in the conference program ), live chat with practicing experts from JavaScript and front-end, developers of various cutting-edge technologies. In short, come in, we are waiting for you!