February 15, 2018 at 13:29
Comparison of the top 4 popular BI platforms. Which one to choose?
- Transfer
Today, there are a huge number of BI platforms and data visualization tools that make data speak, and all analytics can be visually displayed on the screen and shared with customers. In this article, we compare the most popular and widely used BI systems and analyze their advantages and disadvantages so that you can choose one or more of them for your company, because today it is almost impossible to do without high-quality business intelligence.
Trying to evaluate various BI platforms, it is often difficult to understand where the myth is and where it is true, since each vendor positions its product as “the best on the market”, citing hundreds of subjective reviews that have flooded the Internet as an argument. If you want to figure out which tool is right for your company without scrolling through hundreds of pages of “honest” opinions, then what you need is below.
We will look at the most popular platforms, such as QlikView, Klipfolio, Tableau and Power BI, and compare their key parameters: usability, price, ease of installation, support, work with various data types and much more. So go ahead!

QlikView is a platform that focuses on the user as the recipient of the data. It allows him to research his data on the same principles as the developer who is engaged in their processing. At the same time, in order to maintain flexibility in its approach to the study and visualization of data, the system preserves the relationship between the data. This allows the user, along with the piece of data that he wanted to find, get other relevant information, which will also be useful.
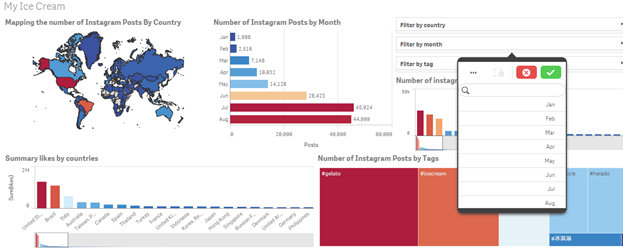
In general, the flexibility of QlikView deserves special praise, because you can change and twist any particle of any object in it, which opens up great opportunities for fine tuning charts and dashboards for a specific task. In addition to this, QlikView also has a built-in ETL, which means that basic cleaning and data processing operations can also be performed in it. On the other hand, it can be quite expensive.
Many competitors of QlikView recognize its uniqueness and try to recreate many of its functions, most often unsuccessfully. The reason is that QlikView implements the world's first, unique associative data model, that is, the software manages the relationships between data at the level of internal platform tools, and not at the application level. This means that QlikView stores data tables in RAM, and any value from one table is associated with all values from other tables.
QlikView has an infinite number of useful features that help you create advanced dashboards based on data from a wide variety of sources.
Firstly, one of these functions is the ability of the tool to automatically recognize the relationship between data without any preliminary configuration from the user, which greatly speeds up the process of creating reports and dashboards.
Secondly, another remarkable property of QlikView is the storage of data in the server’s RAM, which significantly speeds up the execution of queries and, consequently, data analysis. Moreover, the platform can aggregate data on the fly, and this is also faster than doing it in two steps: first aggregate, and then get the data.
Of course, storing data in RAM may seem like an inefficient approach, but QlikView copes with this problem very well due to the incredible degree of data compression, minimizing the space they occupy up to 10% of the original. This became possible due to the skillful use of data dictionaries and the preservation of only the most necessary for analysis.
Even a novice user can easily figure out QlikView reports and dashboards, but at the same time it’s quite difficult to create them, because it requires advanced development skills, SQL skills and some practice in working with the native language built into QlikView.
It is believed that QlikView is one of the most expensive BI platforms on the market (more information about the price can be found here ). Also, its pricing policy is quite confusing. Many newcomers fall into the trap after reading only the company's license agreement, in which everything is described rather vaguely. They don’t realize that in fact the tool will cost them twice as much, because the contract says the price for one “document” (.tde file), which for many is an unpleasant surprise. For competitors, the prices of their products are very transparent and easily identifiable.
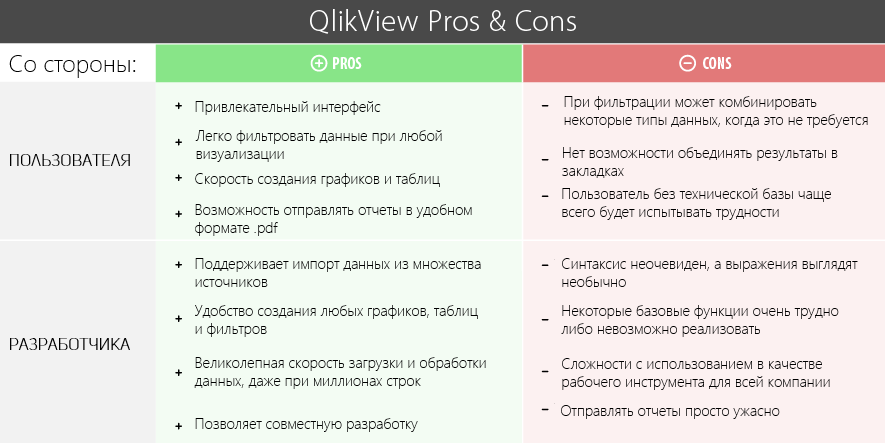
When working with QlikView, the main thing is to understand well what exactly you need and how, in your opinion, the final result should look like. If you still haven’t formed a clear image, you can spend a lot of time trying to combine several data sheets that you don’t need in the end. This system allows you to do really amazing things, if you do not deviate from the chosen course throughout the work.
Thus, QlikView is the right solution if you are not afraid of programming, and you are ready to invest a little more effort in creating excellent reports and dashboards.
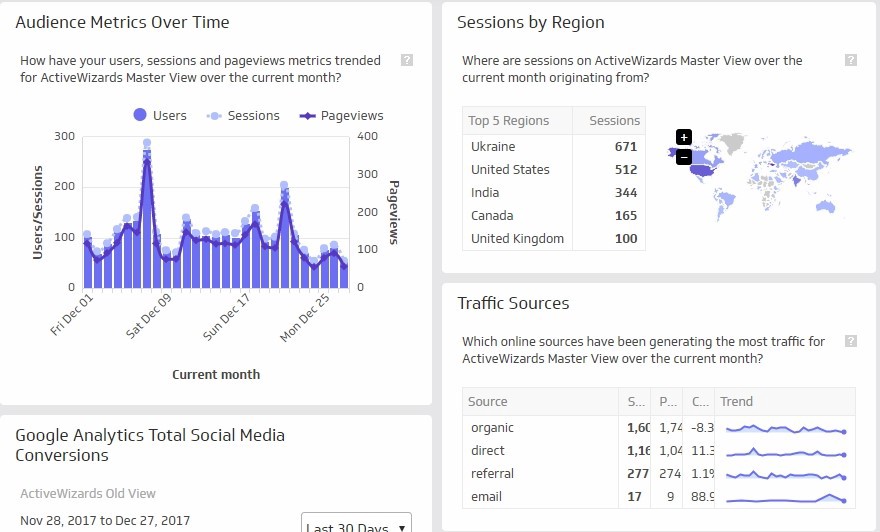
Klipfolio is a BI platform that is 100% located in the cloud, as a result of which data processing is efficient, and you can visualize data with real-time changes. The system is notable for its simplicity, and the interface is intuitive.
Klipfolio supports data from various sources, both online (Google Sheets, relational databases, etc.) and offline (MS Excel, CSV, XML, JSON, etc.). Moreover, you can connect many other tools to the platform, from Google Analytics to Trello and Twitter. You can find complete information about the possibilities of their integration here . Klipfolio also allows you to use any of your own data sources through the RESTful API .
All this, together or separately, opens up great opportunities for analyzing various metrics, creating and customizing unique visualizations, in order to ultimately extract useful information for a business from any data.
Also, the platform focused on compatibility with various devices, from smartphones and tablets to Smart TV in conference rooms.
Klipfolio is best suited for real-time monitoring and control of continuous data streams when their dynamics are important and important decisions need to be made quickly.
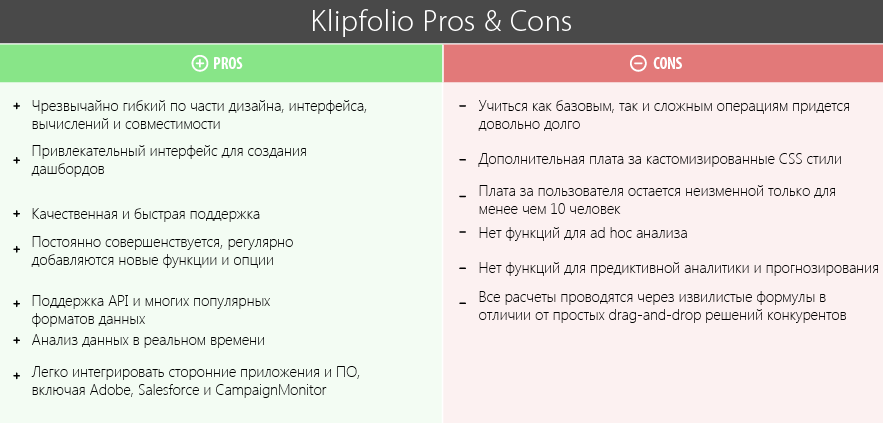
In Klipfolio, you can build dozens of different types of graphs, including pie, bar, area, and many more combinations. Also, a user who knows HTML and CSS can create their own, unique visualizations, superimposing all the necessary components on the dashboard through the WYSIWYG editor, and more complex graphic elements can be added using various formulas and functions. Thus, using Klipfolio you can present information in almost any form, but first you need to think about how to prepare the data.
As one of the oldest players in the BI industry with vast experience, today Klipfolio relies on its cloud solutions. Klipfolio Dashboard (as SaaS) is priced per user starting (with some variations) starting at $ 19 / month. This plan can be customized and add additional options. A 14-day trial period is also possible.
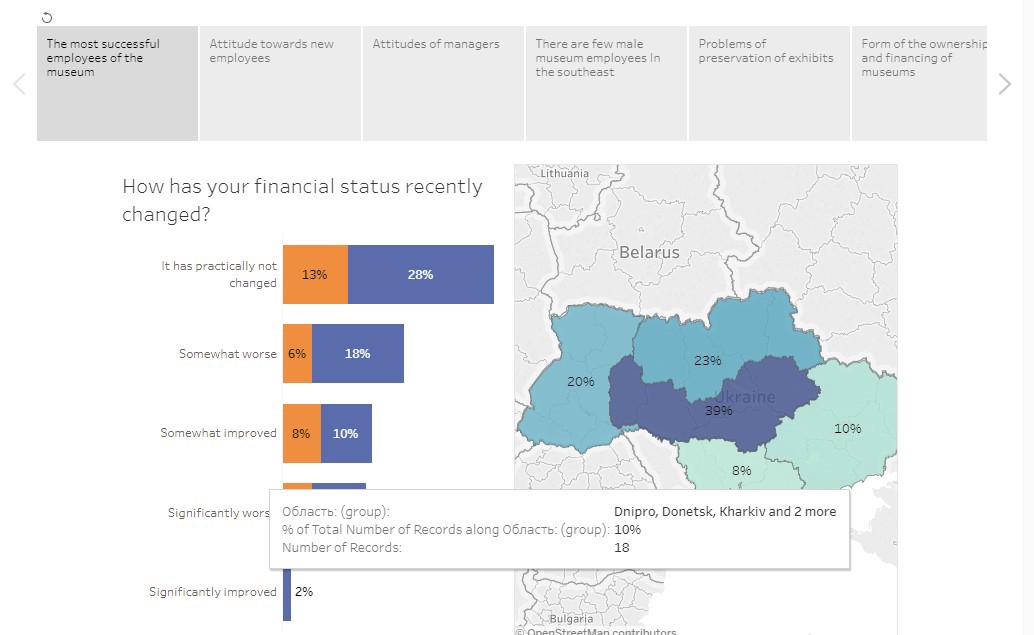
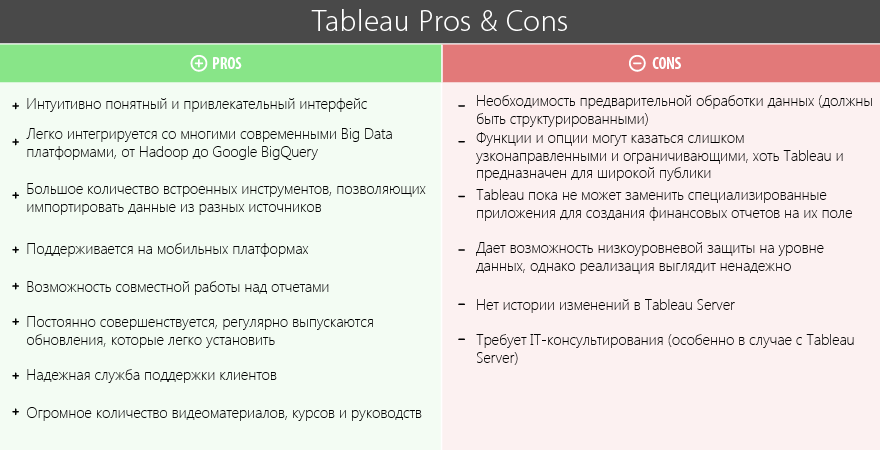
Another major platform is Tableau . Like most BI tools, Tableau specializes in analyzing data through its visualization. It is easy to create interactive dashboards in it, which allow you to study the dynamics, trends and data structure using convenient and simple, but no less effective graphs.
Like many other services, Tableau supports many different data sources organized in file format (CSV, JSON, XML, MS Excel, etc.), relational and non-relational databases (PostgreSQL, MySQL, SQL Server, MongoDB, etc.) and cloud systems (AWS, Oracle Cloud, Google BigQuery, Microsoft Azure).
The key difference between Tableau and its competitors is its special function - mixing data - combining data from different databases and sources. Tableau also allows multiple users to simultaneously work on a report in real time. Still, the platform implements several ways of how to share reports: 1) by publishing them on the Tableau server; 2) via e-mail Tableau Reader; 3) through access by reference. This variety adds flexibility and removes many limitations.
Tableau has the broadest visualization capabilities: the platform’s rich library includes word clouds, bubble and tree diagrams that allow you to achieve a higher level of understanding of your data and their context.
As already mentioned, Tableau dashboards are extremely flexible. The main functions of the service allow you to incredibly place elements on a dashboard and combine and superimpose them on each other in any way, which is very useful in the era of ergonomics of the workplace.
Tableau is quite friendly for novice users, the platform is aimed at those who have not yet gone into the technical details of the visualization process. This goal is achieved through an intuitive interface: everything you need is most often achieved in no more than 2 mouse clicks, filters are easy to find, and all operations are clearly documented.
It is easy to work with Tableau not only from the point of view of designing and creating reports, but also from the end-user side - management. Additional filters, the creation of new parameters, simple and clear data interactivity - all this greatly speeds up decision making and makes them more efficient.

Stunning usability is the main reason why Tableau is considered one of the easiest BI services to learn, and it is best when analyzing structured information. Importing data, building beautiful graphs, sharing them and publishing them in the public domain - no other platform can provide users with so many opportunities with such simplicity. Moreover, a huge number of different guides and guides practically nullifies the probability of encountering any difficulties.
Tableau has 3 different products with three different prices: Tableau Desktop, Tableau Online and Tableau Server. Detailed information can be found here .
Tableau Desktop is designed for individuals and costs $ 999 per year per person and $ 1.999 for corporate use, including support. In the first case, it is supposed to connect up to 6 data sources, and in the second - up to 44.
Tableau Online is a cloud platform with a web interface that can be used for free, but provided that all solutions are stored on a shared server and will be published in an open access. The private version costs $ 500 per year for one user.
Finally, Tableau Server is a monolithic business tool for companies that manage their servers and want to have full control over data flows and their security. However, such a pleasure will cost $ 10,000 per year for 10 users, and support will cost an additional 25% of this amount.

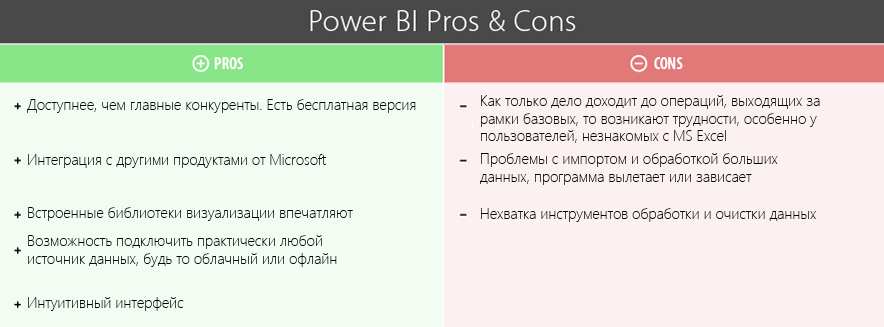
Power BI is an online service developed by Microsoft for business intelligence with the ability to connect various data sources and third-party applications. The platform has a web interface that allows you to create customized visualizations, and using the desktop application you can standardize and clean up data. Interestingly, there is also a mobile version of Power BI, available on various operating systems, to make decisions on the go.
Power BI is simple and minimalistic, but at the same time it has power and stability. Like any other software, it has both pros and cons.
What sets Power BI apart from other solutions?
Firstly, this is a Microsoft product, which means it follows a philosophy, principles and architecture that are similar to other products of the IT giant. The program interface will be familiar to Windows users.
Secondly, belonging to Microsoft provides another advantage: Power BI is closely connected with the company's main products, such as MS Excel, Azure Cloud Service and SQL Server.
Generally speaking, Power BI was created with the aim of expanding the functionality of MS Excel and pumping it to a new level and using it to solve problems in which it was not previously involved.
The interface is simple and understandable to anyone familiar with Windows (that is, almost everyone), so working with Power BI is usually nice. Many buttons and functions look similar to MS Excel and other MS Office products.
Visualizations are created by the good old drag-and-drop method. All you need to create a chart is to click on the necessary element and drag it to an empty place in the report. The same principle works when choosing which data needs to be visualized - just select a piece of data and place it in the place where the graph is located.
Microsoft Power BI is considered a high-quality business intelligence tool, many are also attracted by a fairly affordable pricing policy. It includes two options: a free version of the service with limited capabilities and a Power BI Pro Volume License with a full range of features.
The free version is available for any individual user and has the following characteristics: 1 GB memory limit, 10,000 lines / hour of streaming data processing along with restrictions on updating and collaboration on reports.
Power BI Pro costs $ 9.99 per user per month and increases the memory limit to 10 GB per person, along with a speed of 1 million lines / hour. There is also the possibility of accessing data sources directly, linking them to company data through the Data Connectivity Gateway. Finally, advanced collaboration tools such as Office 365 Groups, Active Directory groups, and the data directory are available.
Now, to structure everything that was said above, we give a comparative table of all the platforms considered:
Trying to evaluate various BI platforms, it is often difficult to understand where the myth is and where it is true, since each vendor positions its product as “the best on the market”, citing hundreds of subjective reviews that have flooded the Internet as an argument. If you want to figure out which tool is right for your company without scrolling through hundreds of pages of “honest” opinions, then what you need is below.
We will look at the most popular platforms, such as QlikView, Klipfolio, Tableau and Power BI, and compare their key parameters: usability, price, ease of installation, support, work with various data types and much more. So go ahead!
QlikView
QlikView is a platform that focuses on the user as the recipient of the data. It allows him to research his data on the same principles as the developer who is engaged in their processing. At the same time, in order to maintain flexibility in its approach to the study and visualization of data, the system preserves the relationship between the data. This allows the user, along with the piece of data that he wanted to find, get other relevant information, which will also be useful.
In general, the flexibility of QlikView deserves special praise, because you can change and twist any particle of any object in it, which opens up great opportunities for fine tuning charts and dashboards for a specific task. In addition to this, QlikView also has a built-in ETL, which means that basic cleaning and data processing operations can also be performed in it. On the other hand, it can be quite expensive.
Features
Many competitors of QlikView recognize its uniqueness and try to recreate many of its functions, most often unsuccessfully. The reason is that QlikView implements the world's first, unique associative data model, that is, the software manages the relationships between data at the level of internal platform tools, and not at the application level. This means that QlikView stores data tables in RAM, and any value from one table is associated with all values from other tables.
Key Features
QlikView has an infinite number of useful features that help you create advanced dashboards based on data from a wide variety of sources.
Firstly, one of these functions is the ability of the tool to automatically recognize the relationship between data without any preliminary configuration from the user, which greatly speeds up the process of creating reports and dashboards.
Secondly, another remarkable property of QlikView is the storage of data in the server’s RAM, which significantly speeds up the execution of queries and, consequently, data analysis. Moreover, the platform can aggregate data on the fly, and this is also faster than doing it in two steps: first aggregate, and then get the data.
Of course, storing data in RAM may seem like an inefficient approach, but QlikView copes with this problem very well due to the incredible degree of data compression, minimizing the space they occupy up to 10% of the original. This became possible due to the skillful use of data dictionaries and the preservation of only the most necessary for analysis.
Ease of use
Even a novice user can easily figure out QlikView reports and dashboards, but at the same time it’s quite difficult to create them, because it requires advanced development skills, SQL skills and some practice in working with the native language built into QlikView.
Price
It is believed that QlikView is one of the most expensive BI platforms on the market (more information about the price can be found here ). Also, its pricing policy is quite confusing. Many newcomers fall into the trap after reading only the company's license agreement, in which everything is described rather vaguely. They don’t realize that in fact the tool will cost them twice as much, because the contract says the price for one “document” (.tde file), which for many is an unpleasant surprise. For competitors, the prices of their products are very transparent and easily identifiable.
When working with QlikView, the main thing is to understand well what exactly you need and how, in your opinion, the final result should look like. If you still haven’t formed a clear image, you can spend a lot of time trying to combine several data sheets that you don’t need in the end. This system allows you to do really amazing things, if you do not deviate from the chosen course throughout the work.
Thus, QlikView is the right solution if you are not afraid of programming, and you are ready to invest a little more effort in creating excellent reports and dashboards.
Klipfolio
Klipfolio is a BI platform that is 100% located in the cloud, as a result of which data processing is efficient, and you can visualize data with real-time changes. The system is notable for its simplicity, and the interface is intuitive.
Klipfolio supports data from various sources, both online (Google Sheets, relational databases, etc.) and offline (MS Excel, CSV, XML, JSON, etc.). Moreover, you can connect many other tools to the platform, from Google Analytics to Trello and Twitter. You can find complete information about the possibilities of their integration here . Klipfolio also allows you to use any of your own data sources through the RESTful API .
All this, together or separately, opens up great opportunities for analyzing various metrics, creating and customizing unique visualizations, in order to ultimately extract useful information for a business from any data.
Also, the platform focused on compatibility with various devices, from smartphones and tablets to Smart TV in conference rooms.
Features
Klipfolio is best suited for real-time monitoring and control of continuous data streams when their dynamics are important and important decisions need to be made quickly.
Key Features
- Integration of various data sources into one report.
- Unlimited number of potentially connected users.
- Manage rights and restrictions on access to important information.
- Availability on mobile OS (iOS, Android, BlackBerry, Windows).
- Flexible REST connector for connecting special data sources.
- Support for Excel, CSV, JSON, XML, etc.
- Ability to add convenient annotations to reports that will be visible to end users.
- Automatic KPI configuration system.
- Ability to easily add threshold indicators to charts.
Ease of use
In Klipfolio, you can build dozens of different types of graphs, including pie, bar, area, and many more combinations. Also, a user who knows HTML and CSS can create their own, unique visualizations, superimposing all the necessary components on the dashboard through the WYSIWYG editor, and more complex graphic elements can be added using various formulas and functions. Thus, using Klipfolio you can present information in almost any form, but first you need to think about how to prepare the data.
Price
As one of the oldest players in the BI industry with vast experience, today Klipfolio relies on its cloud solutions. Klipfolio Dashboard (as SaaS) is priced per user starting (with some variations) starting at $ 19 / month. This plan can be customized and add additional options. A 14-day trial period is also possible.
Tableau
Another major platform is Tableau . Like most BI tools, Tableau specializes in analyzing data through its visualization. It is easy to create interactive dashboards in it, which allow you to study the dynamics, trends and data structure using convenient and simple, but no less effective graphs.
Like many other services, Tableau supports many different data sources organized in file format (CSV, JSON, XML, MS Excel, etc.), relational and non-relational databases (PostgreSQL, MySQL, SQL Server, MongoDB, etc.) and cloud systems (AWS, Oracle Cloud, Google BigQuery, Microsoft Azure).
The key difference between Tableau and its competitors is its special function - mixing data - combining data from different databases and sources. Tableau also allows multiple users to simultaneously work on a report in real time. Still, the platform implements several ways of how to share reports: 1) by publishing them on the Tableau server; 2) via e-mail Tableau Reader; 3) through access by reference. This variety adds flexibility and removes many limitations.
Distinctive features
Tableau has the broadest visualization capabilities: the platform’s rich library includes word clouds, bubble and tree diagrams that allow you to achieve a higher level of understanding of your data and their context.
As already mentioned, Tableau dashboards are extremely flexible. The main functions of the service allow you to incredibly place elements on a dashboard and combine and superimpose them on each other in any way, which is very useful in the era of ergonomics of the workplace.
Tableau is quite friendly for novice users, the platform is aimed at those who have not yet gone into the technical details of the visualization process. This goal is achieved through an intuitive interface: everything you need is most often achieved in no more than 2 mouse clicks, filters are easy to find, and all operations are clearly documented.
It is easy to work with Tableau not only from the point of view of designing and creating reports, but also from the end-user side - management. Additional filters, the creation of new parameters, simple and clear data interactivity - all this greatly speeds up decision making and makes them more efficient.
Key Features
- Great opportunities to distribute reports and dashboards.
- Support for more than 30 data types.
- Mixing data from different sources.
- Integration with R.
- The most active community of users who create thousands of educational videos, blogs and forums.
Ease of use
Stunning usability is the main reason why Tableau is considered one of the easiest BI services to learn, and it is best when analyzing structured information. Importing data, building beautiful graphs, sharing them and publishing them in the public domain - no other platform can provide users with so many opportunities with such simplicity. Moreover, a huge number of different guides and guides practically nullifies the probability of encountering any difficulties.
Price
Tableau has 3 different products with three different prices: Tableau Desktop, Tableau Online and Tableau Server. Detailed information can be found here .
Tableau Desktop is designed for individuals and costs $ 999 per year per person and $ 1.999 for corporate use, including support. In the first case, it is supposed to connect up to 6 data sources, and in the second - up to 44.
Tableau Online is a cloud platform with a web interface that can be used for free, but provided that all solutions are stored on a shared server and will be published in an open access. The private version costs $ 500 per year for one user.
Finally, Tableau Server is a monolithic business tool for companies that manage their servers and want to have full control over data flows and their security. However, such a pleasure will cost $ 10,000 per year for 10 users, and support will cost an additional 25% of this amount.
Power BI
Power BI is an online service developed by Microsoft for business intelligence with the ability to connect various data sources and third-party applications. The platform has a web interface that allows you to create customized visualizations, and using the desktop application you can standardize and clean up data. Interestingly, there is also a mobile version of Power BI, available on various operating systems, to make decisions on the go.
Power BI is simple and minimalistic, but at the same time it has power and stability. Like any other software, it has both pros and cons.
Distinctive features
What sets Power BI apart from other solutions?
Firstly, this is a Microsoft product, which means it follows a philosophy, principles and architecture that are similar to other products of the IT giant. The program interface will be familiar to Windows users.
Secondly, belonging to Microsoft provides another advantage: Power BI is closely connected with the company's main products, such as MS Excel, Azure Cloud Service and SQL Server.
Generally speaking, Power BI was created with the aim of expanding the functionality of MS Excel and pumping it to a new level and using it to solve problems in which it was not previously involved.
Key Features
- There is a free basic version that allows you to first try to work with Power BI.
- It supports many ways to import data (streaming data, cloud services, Excel workbooks and third-party applications).
- Interactive dashboards with real-time data changes.
- A simple API to integrate Power BI into your applications.
- There are several different ways to share reports and dashboards.
- Support for multiple platforms (Web, desktop or mobile application).
Ease of use
The interface is simple and understandable to anyone familiar with Windows (that is, almost everyone), so working with Power BI is usually nice. Many buttons and functions look similar to MS Excel and other MS Office products.
Visualizations are created by the good old drag-and-drop method. All you need to create a chart is to click on the necessary element and drag it to an empty place in the report. The same principle works when choosing which data needs to be visualized - just select a piece of data and place it in the place where the graph is located.
Price
Microsoft Power BI is considered a high-quality business intelligence tool, many are also attracted by a fairly affordable pricing policy. It includes two options: a free version of the service with limited capabilities and a Power BI Pro Volume License with a full range of features.
The free version is available for any individual user and has the following characteristics: 1 GB memory limit, 10,000 lines / hour of streaming data processing along with restrictions on updating and collaboration on reports.
Power BI Pro costs $ 9.99 per user per month and increases the memory limit to 10 GB per person, along with a speed of 1 million lines / hour. There is also the possibility of accessing data sources directly, linking them to company data through the Data Connectivity Gateway. Finally, advanced collaboration tools such as Office 365 Groups, Active Directory groups, and the data directory are available.
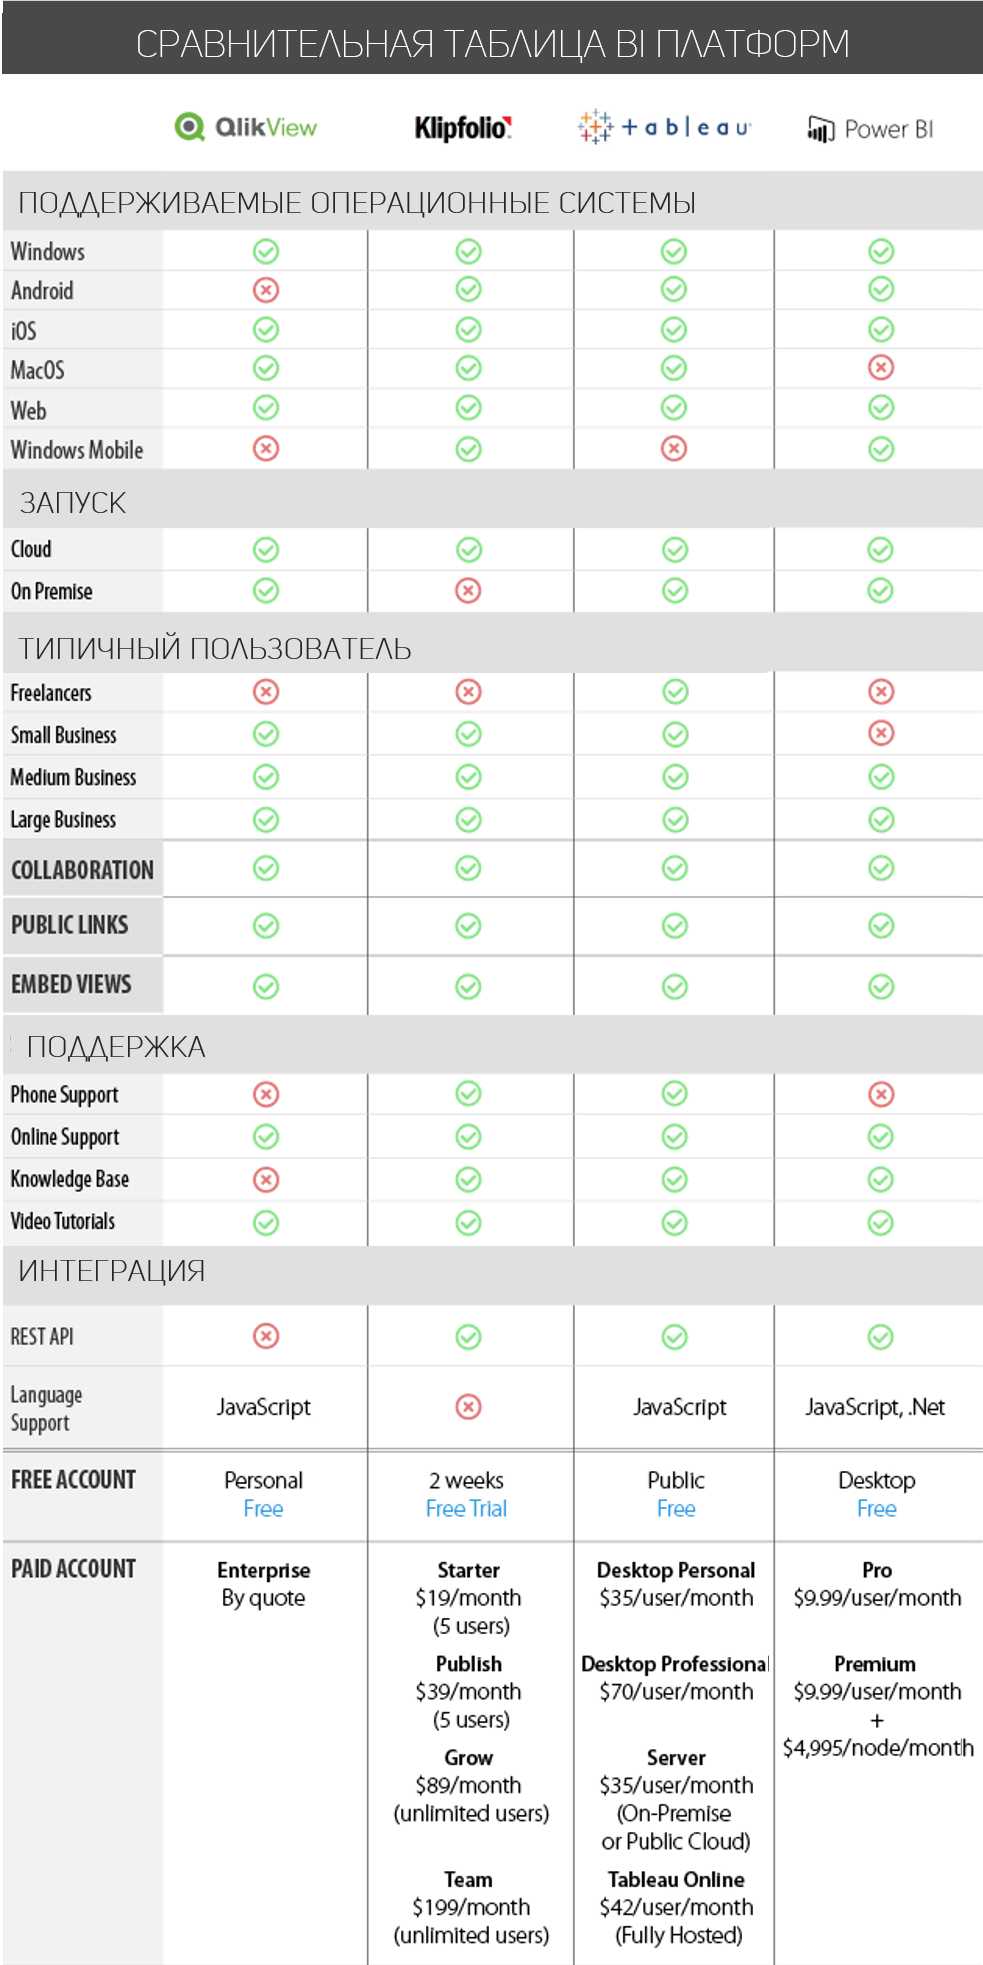
Now, to structure everything that was said above, we give a comparative table of all the platforms considered: