IntelliJ IDEA 2017.3. What's new and interesting?
If anyone else is not up to date, IntelliJ IDEA 2017.3 is today . Continuing the tradition, I talk about what new and interesting was added or changed in the release: smart tips, refactoring, navigation, tools for working with Git , databases, support for frameworks, and much more.

Go!
Type casting for call chains in Smart Completion
In the previous release (IntelliJ IDEA 2017.2), method call chains began to appear on the first call of Smart Completion (before that they were available only on the second call). In this release, these chains also allow for automatic type conversion based on context:

Analysis of code execution flow
A couple of years ago, IntelliJ IDEA learned how to automatically output Nullable and NotNull annotations for parameters and return values of library class methods. This conclusion was made on the basis of the analysis of the flow of execution inside the methods. In version 2017.3, the output of annotations for parameters works not only for library class methods, but also for private or final class methods inside a project.
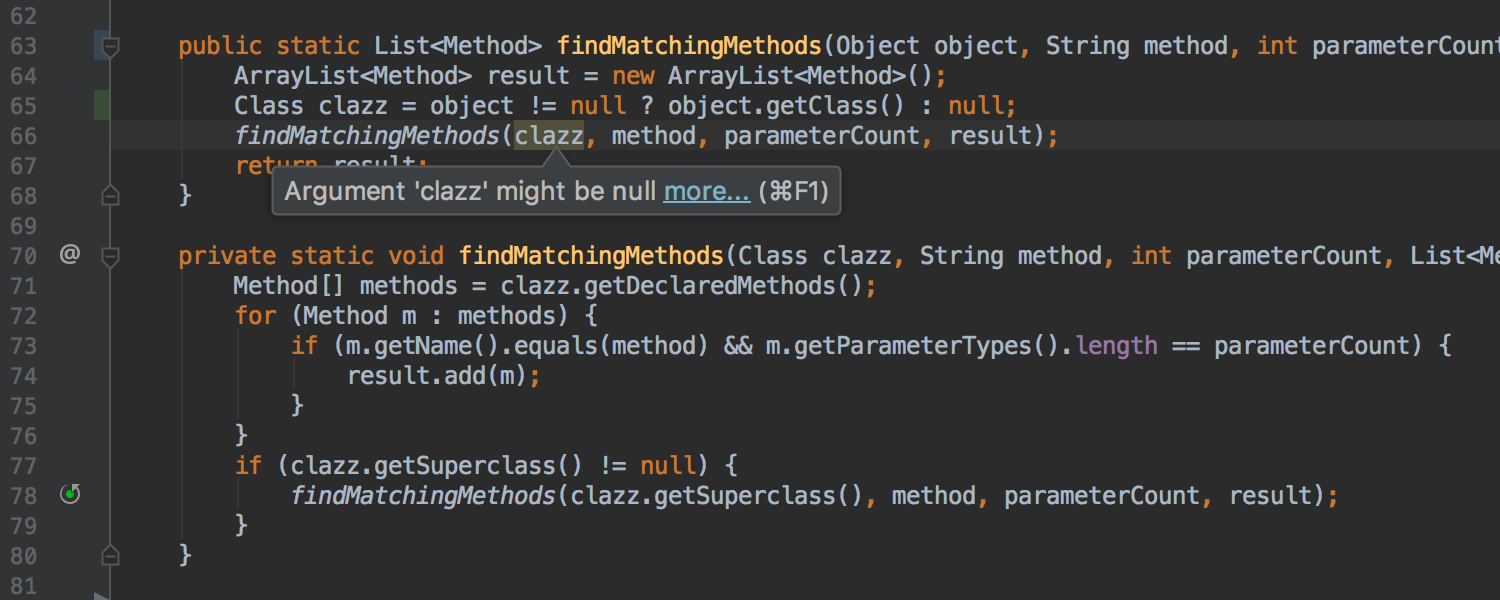
In case of annotation output in a similar method, the IDE offers quick-fix for explicit declaration of annotation:

Also, the IDE learned to detect potential Nullability problems inside Stream API method calls. If a potential problem is detected, the IDE reports this and, where possible, offers to automatically make changes to the code in order to avoid errors during execution:
Transforming a for loop into a Stream API call chain for
loops , the result of which is adding lines to StringBuilder , now you can automatically transform into a chain of Stream API calls using Stream.collect and Collectors.joining : Inverting the logic of boolean methods using quick-fix Invert Boolean refactoring is now available as quick-fix for methods (previously quick-fix was only available in
batch mode , as well as for variables, constants and fields of the class):
Separate method calls on collections and Stream API call chains
Where it makes sense, now the IDE suggests replacing individual sort and toArray calls on collections with the corresponding methods on the Stream API call chain :
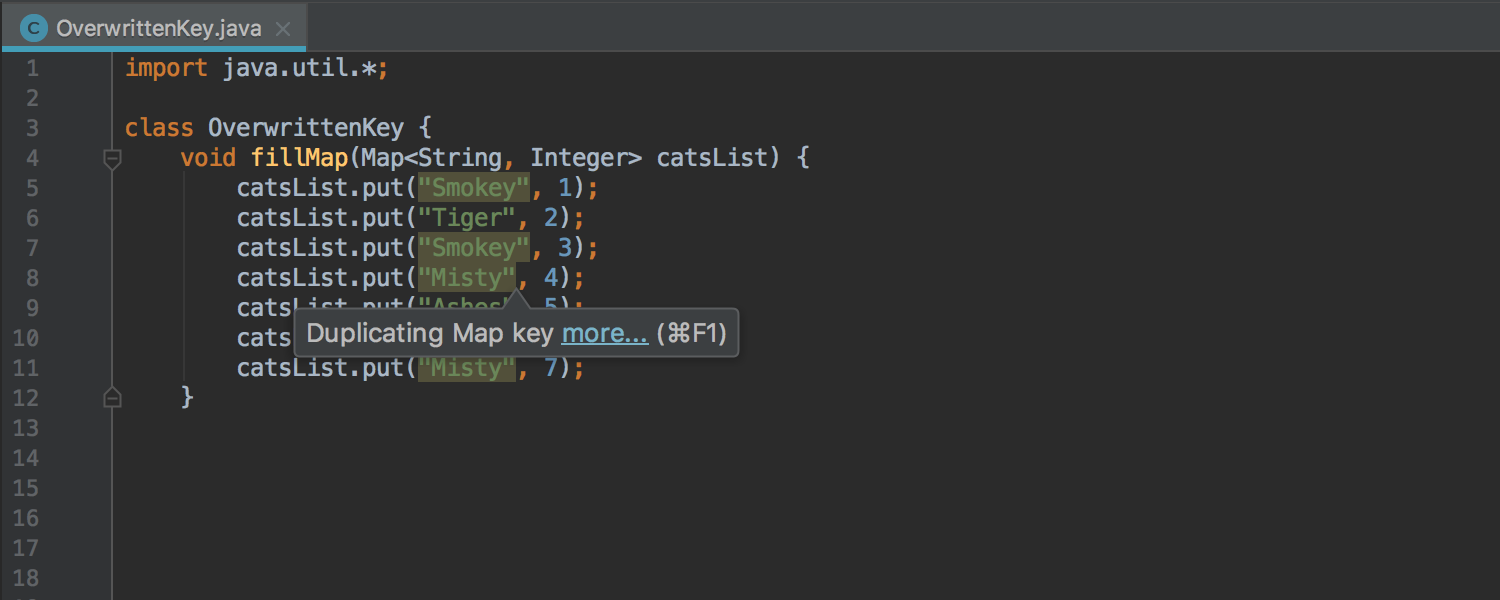
Detecting duplicate keys in Map and Set initialization
If you accidentally specify a value for the same key two or more times or try to add the same element to Set , the IDE will now warn you of a possible error:
Detection of excessive exception
declarations fishing redundant exception declarations previously worked only forfinal and private methods. Now detection works for any methods:
This particular inspection can be disabled for so-called entry points, for example for tests.
Migrating deprecated methods
When an explicit alternative is specified for the deprecated method, the IDE offers a quick-fix for auto-replace:
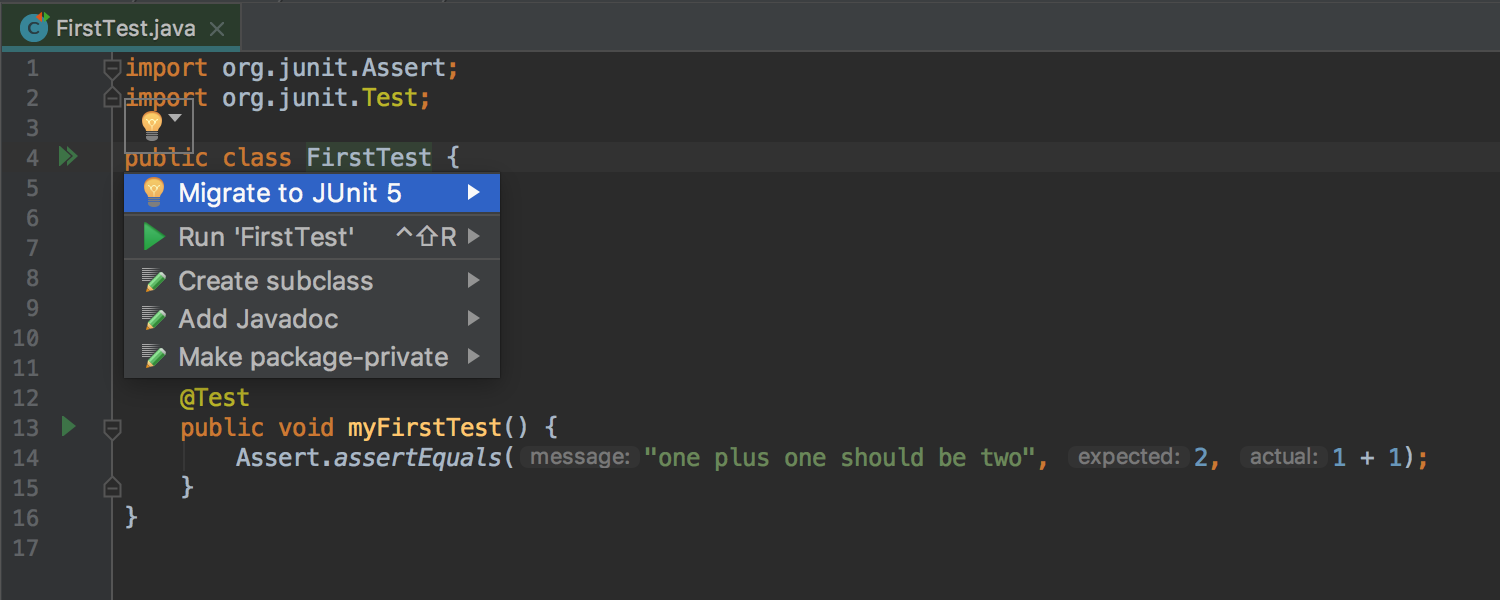
Migrating from JUnit 4 to JUnit 5
If both JUnit 4 and JUnit 5 are present in the module , the IDE offers quick-fix for automatic migration from JUnit 4 on JUnit 5 :
Run Dashboard for all types of Run Configuration
Run DashboardIt was previously available only for Spring Boot applications, and now can be used for any type of Run Configuration . To do this, open the Edit Run Configurations dialog , select Defaults and add the appropriate configuration types to the Run Dashboard Types list :
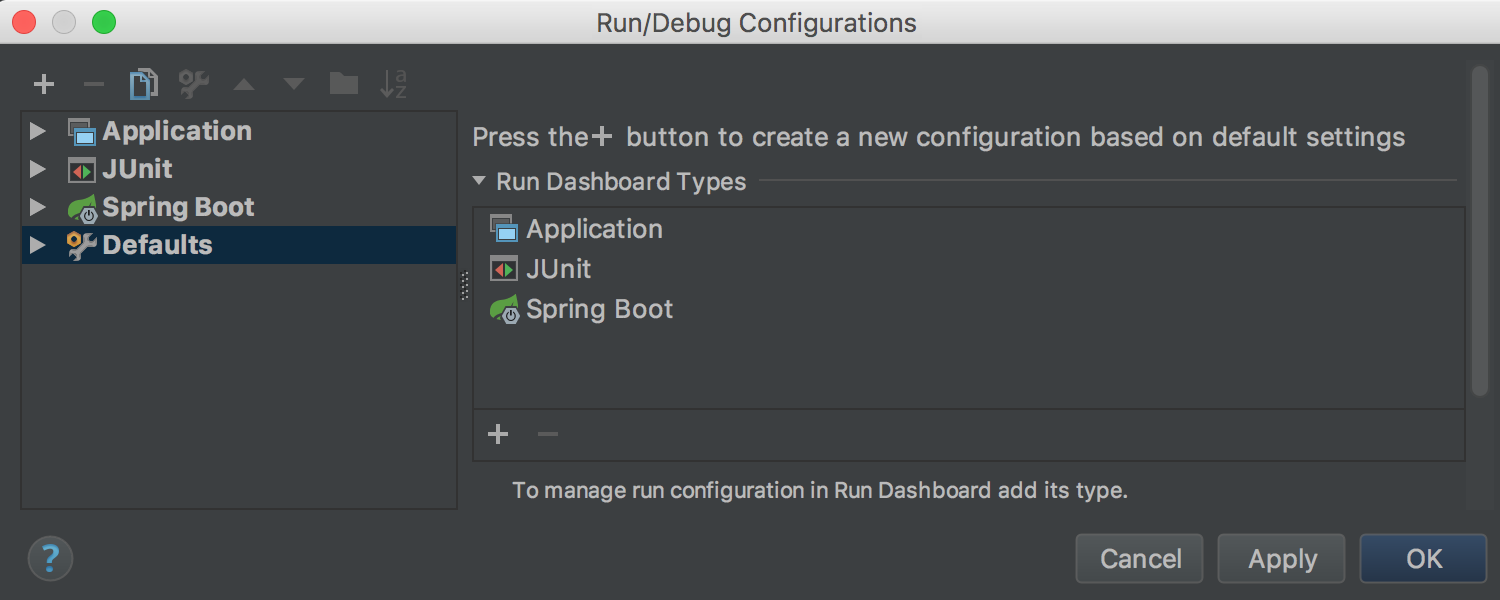
Run Dashboard offers a convenient interface for launching and managing several Run Configurations :

Debugger for JVM
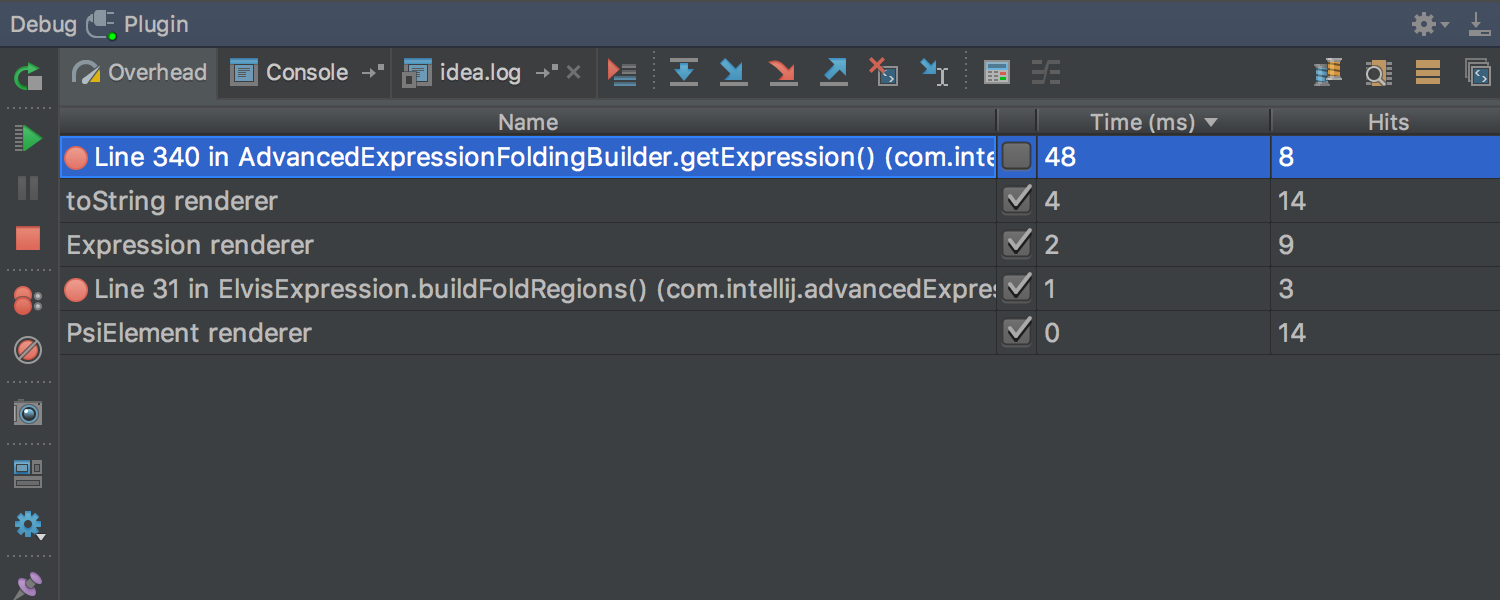
In this release, more attention was paid to accounting and optimization of computational costs the resources ( overhead ) that Debugger introduces into the starting process due to the processing of breakpoints (breakpoints ) and value displays (using Data Renderers ) in the Variables , Watches , Evaluate Expression , Inspect, and other tabs .
To account for these resource costs , a new Overhead tab has been added to the Debug tool window . This tab displays the cumulative number of calls to Breakpoints and Data Renderers (given the option Enable 'toString ()' object view , used by default if a specific Data Renderer is not specified ): In addition, any Data Renderer can be marked as
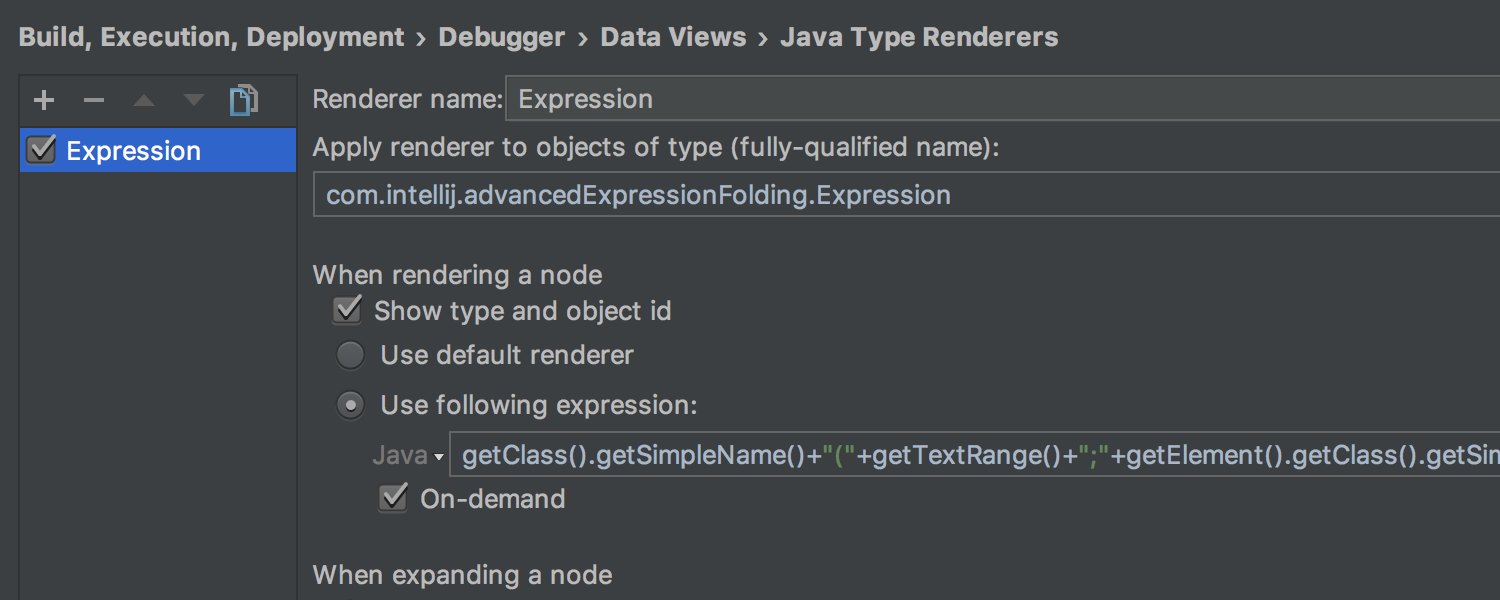
On-demand . This will mean that the value will be calculated and displayed only if necessary (by clicking): You can
mark Data Renderer as On-demand in the Java Type Renderers settings :
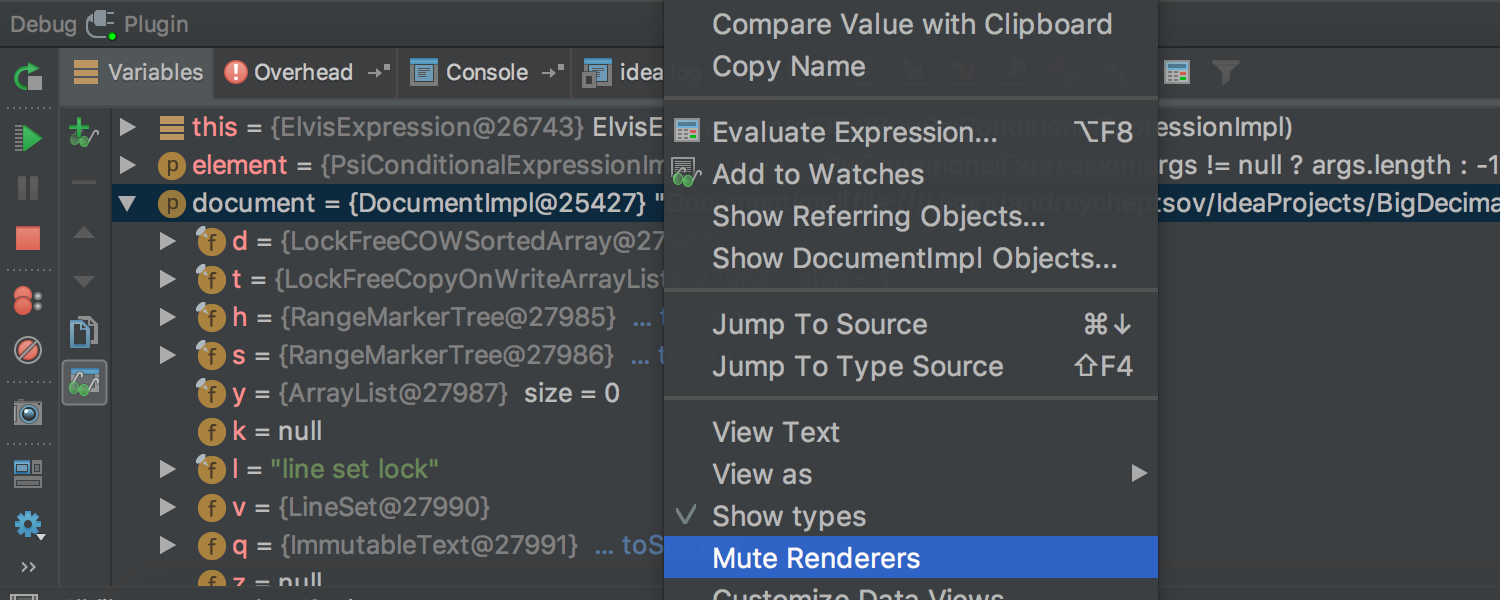
either by selecting Mute Renderers in the context menu on a specific value:
We also optimized the cost of resources for calculation Async Stacktraces . In addition, Async Stacktraces does not need to be further configured. Now they work right away, out of the box. Java Stream Debugger
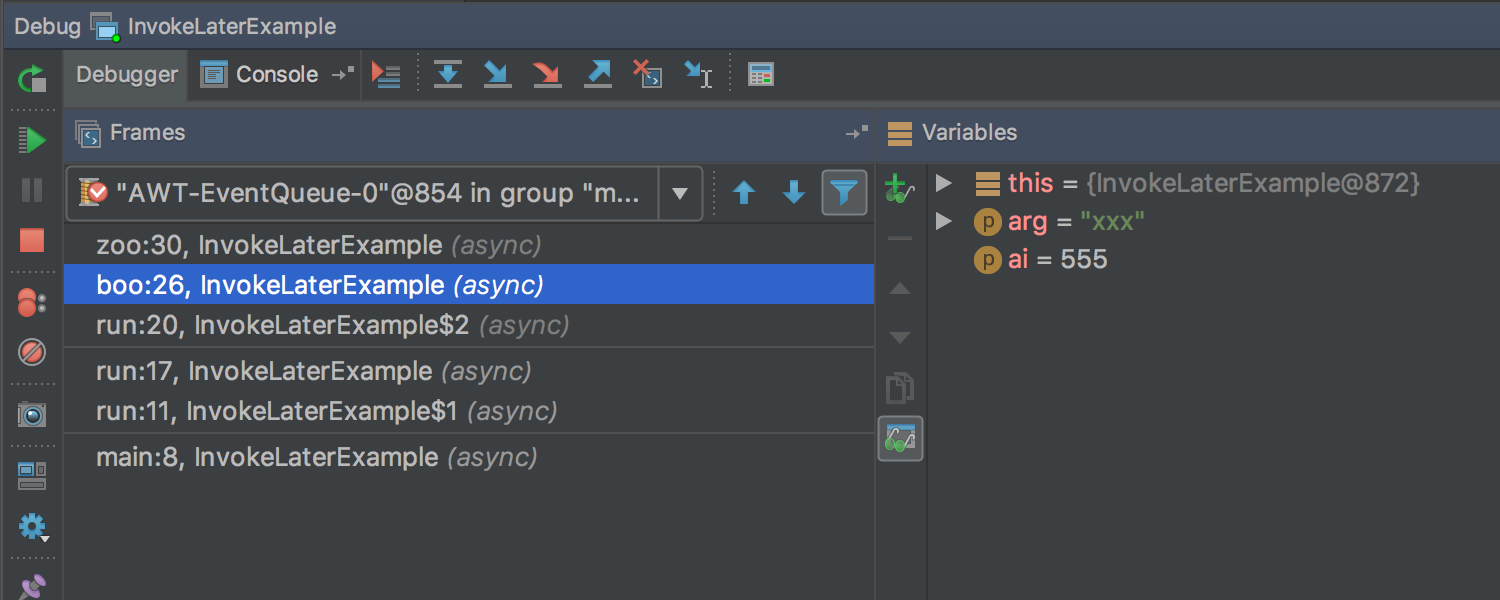
plugin that helped debug Stream API call chains, is now part of the IDE and is available during debugging ( Trace Current Stream Chain button in the Debug tool window ):
Tips and navigation for Java EE 8 The
new release fully supports the Java EE 8 standard and offers additional tips, navigation and other nice features for Asynchronous CDI Events , CDI Bean Injection , PushBuilder , Disposes and Produces :
Support for Spring and Spring Boot
Now the IDE can automatically detect and configure MVC Context in the Spring Facet settings for applicationsSpring Boot :

The Endpoints tab in the Spring Boot application launch and debugging window , which helps monitor the running application, now supports Spring Boot 2.0 Actuator Endpoints .
The highlighting in Spring Boot application configuration files now takes into account the type of values:

In the dependency diagrams between the beans ( Spring Beans Diagram ), a new interesting mode has appeared: Neighborhood . In this mode, only direct dependencies are displayed. When you select one of the dependencies, you will see direct dependencies for the selected bin, etc. Thus it is convenient to navigate between the dependencies:
Working with modules
If you marked some modules as “unloaded” (unloaded ) and when updating the VCS project , new modules were created, earlier they were automatically marked as “loaded” ( loaded ). Now, in those cases when the modules marked as “loaded” do not depend on these modules, these modules are automatically marked as “unloaded”.
Also, before committing, the IDE now checks that the "unloaded" modules compile without errors.
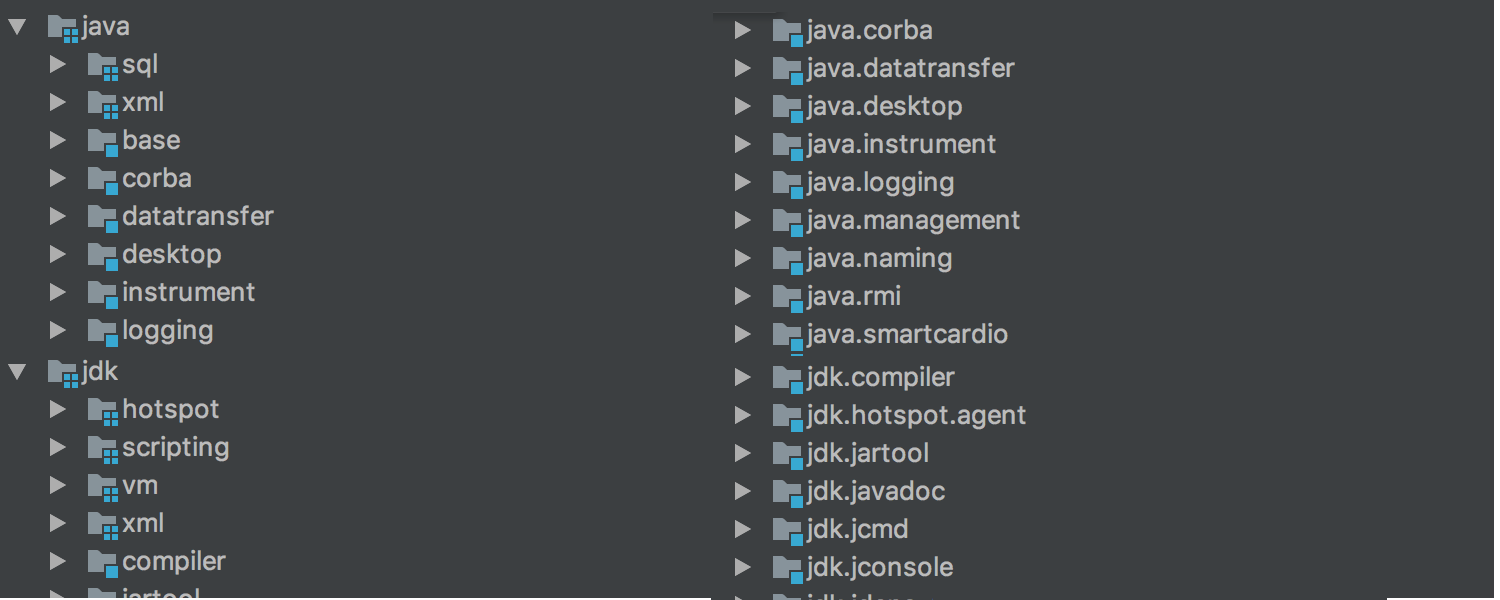
In addition, the way grouping modules during display has changed. Previously, groups of modules that could be created in Project Structure were used for this . Now, using the same mechanism that is used to group packages structure ( -packages ): name of the module is divided symbol point and forms a tree:
Building the project
Earlier, when using Gradle, running applications and tests in the mode of collecting statistics on code coverage ( Run with Coverage ) did not work if the option Delegate IDE build / run actions to Gradle or Gradle Test Runner was enabled . Now Run with Coverage works in all cases.
The process of importing, compiling and building a project for Gradle , Android / Gradle and SBT can now be seen in the new Build tool window :

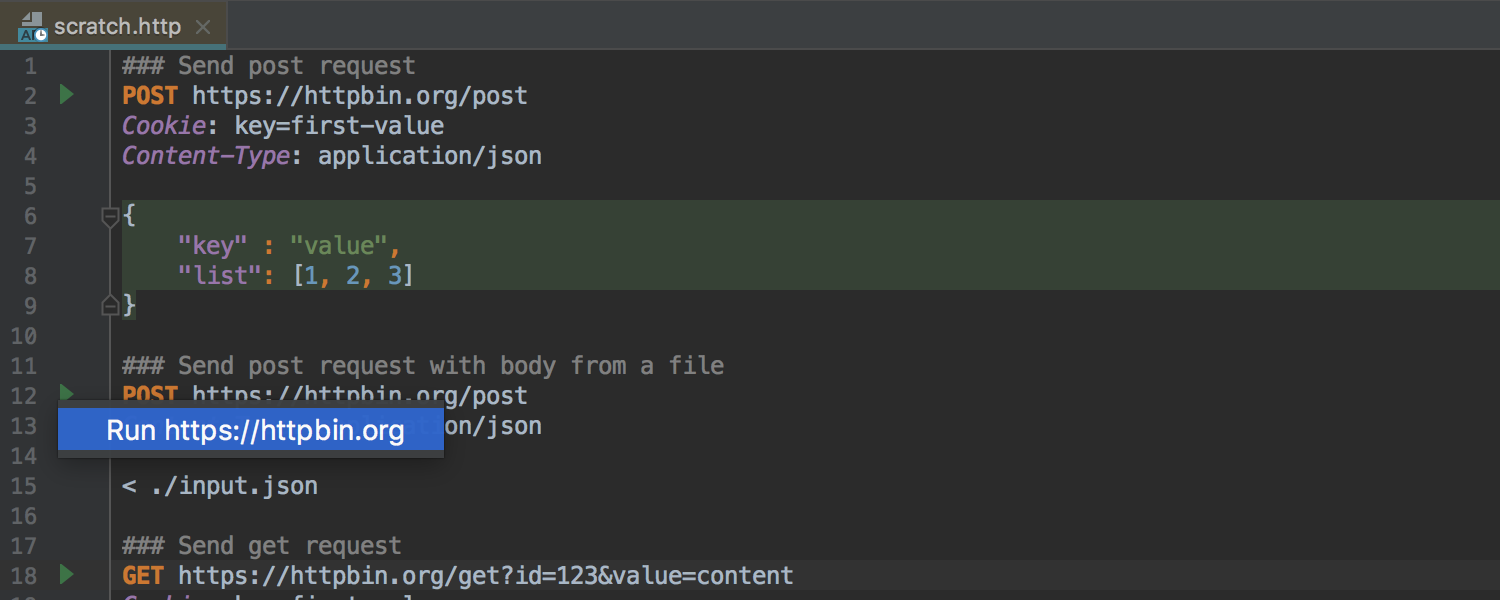
Working with REST requests
Now working with REST-queries can be done using a new tool based on the editor. To do this, just create a file in the project with .http permission and open it in the editor. If you do not want to create a file in the project, you can use Scratch File :
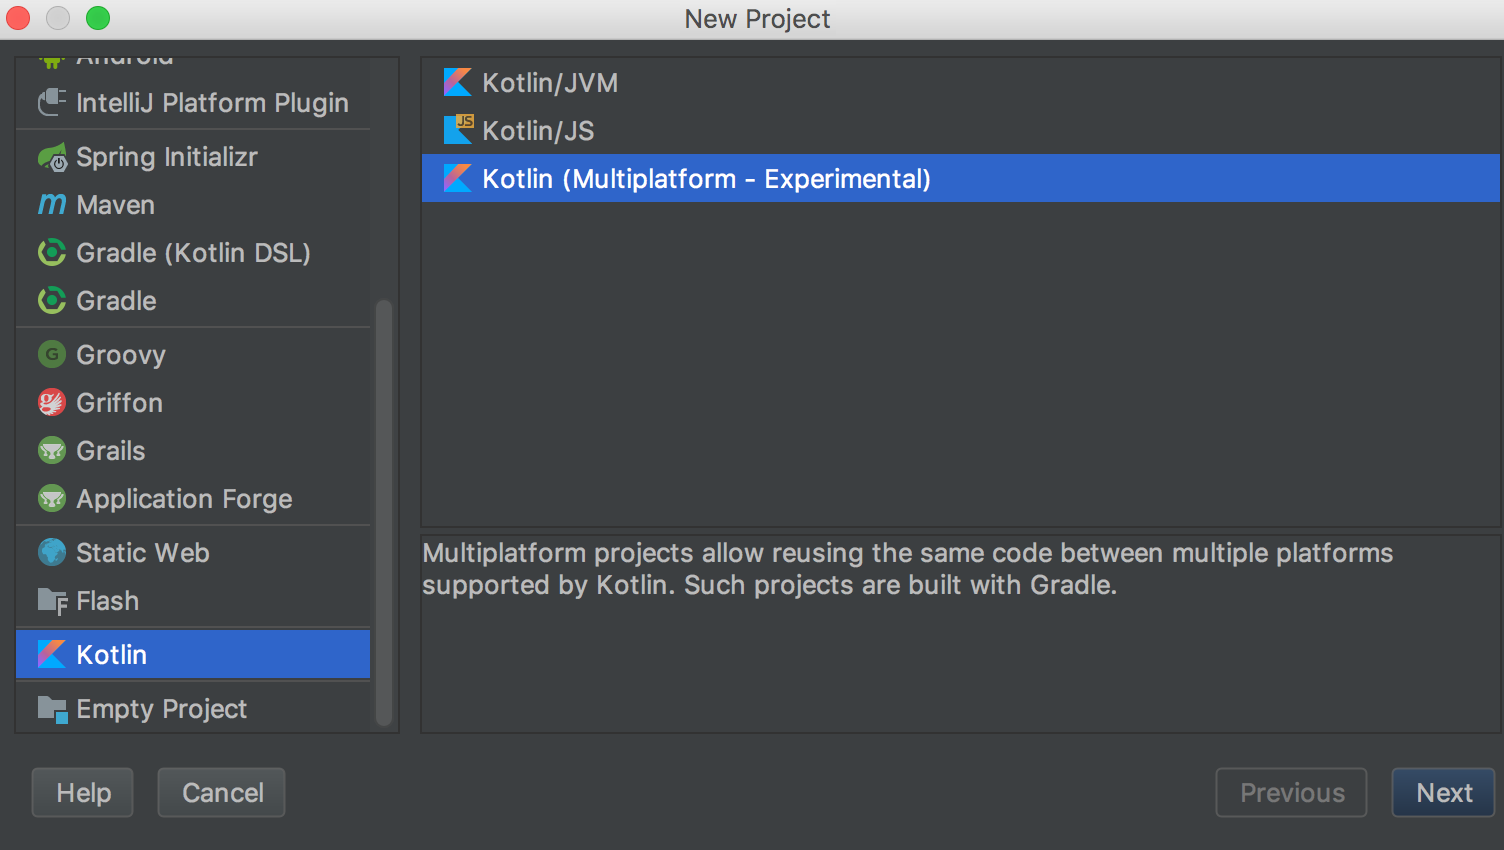
Kotlin
Following the release of Kotlin 1.2 , which happened yesterday, the language support in the IDE has been updated. The main innovation of the update is the experimental possibility of “reusing code” between the JVM and JavaScript :
Using the expect keyword, any class or method can now be declared as “general”. The implementation of this class or method for a specific platform can be declared using the keywordactual в модуле для соответствующей платформы. IDE проверяет, что реализация существует для сконфигурированных платформ, и позволяет переходить от декларации к реализациям и обратно:
Подробнее о работе «общих модулей» (common modules) можно прочитать в этом хабрапосте или в официальной документации (на английском). Обязательным условием работы таких модулей является сборка проекта Gradle.
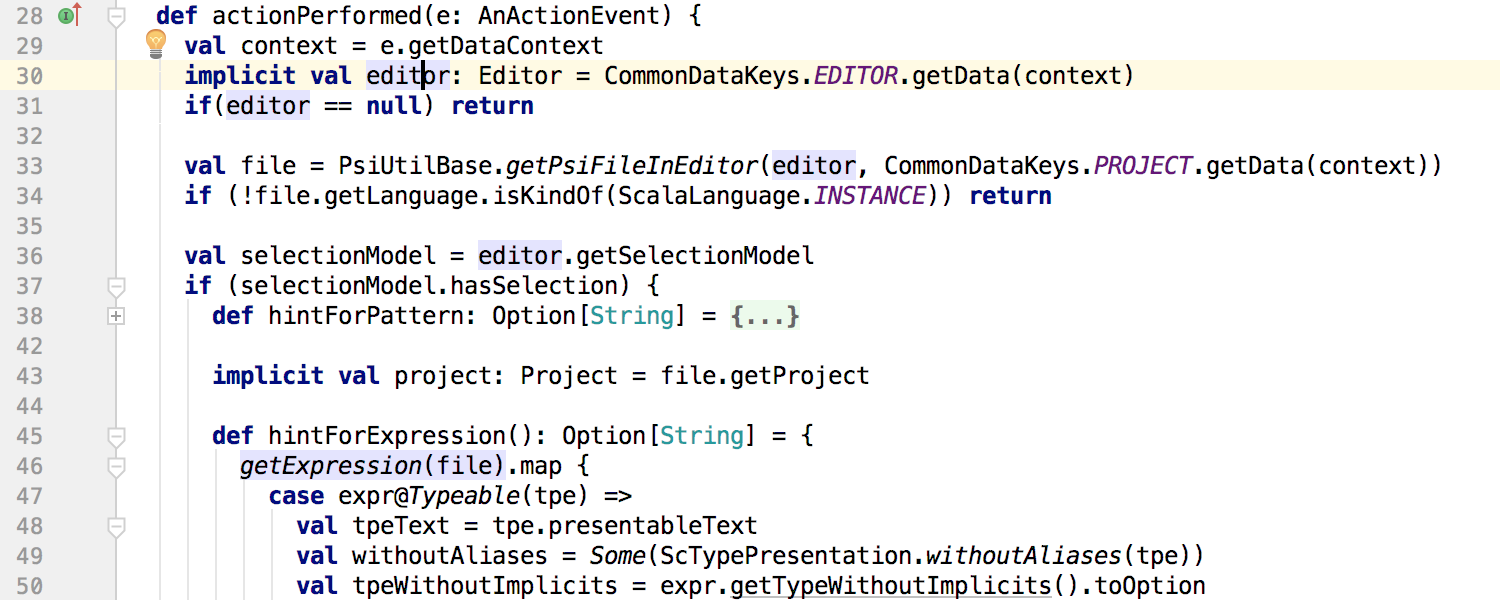
Scala
Подсветка символа под кареткой (которая включена по-умолчанию, как и та, которая доступна по нажатию Shift+Ctrl/Cmd+F7) теперь подсвечивает также неявное (implicit) использование символа:
The assembly and launch of the application or tests are no longer tied to indexing and work even if indexing has not yet ended.
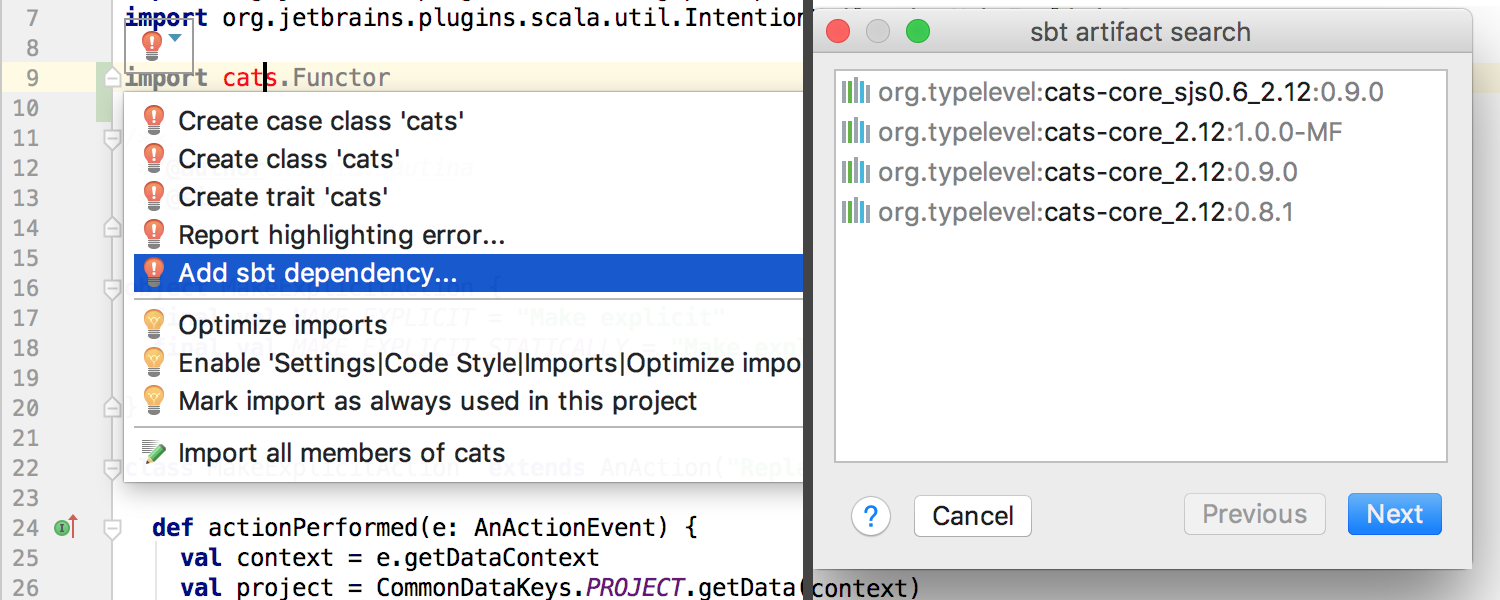
In SBT projects, when a plugin notices a dependency import expression that is not specified in the SBT configuration but is present in the local Ivy Cache , the IDE offers to add it to the SBT configuration: The
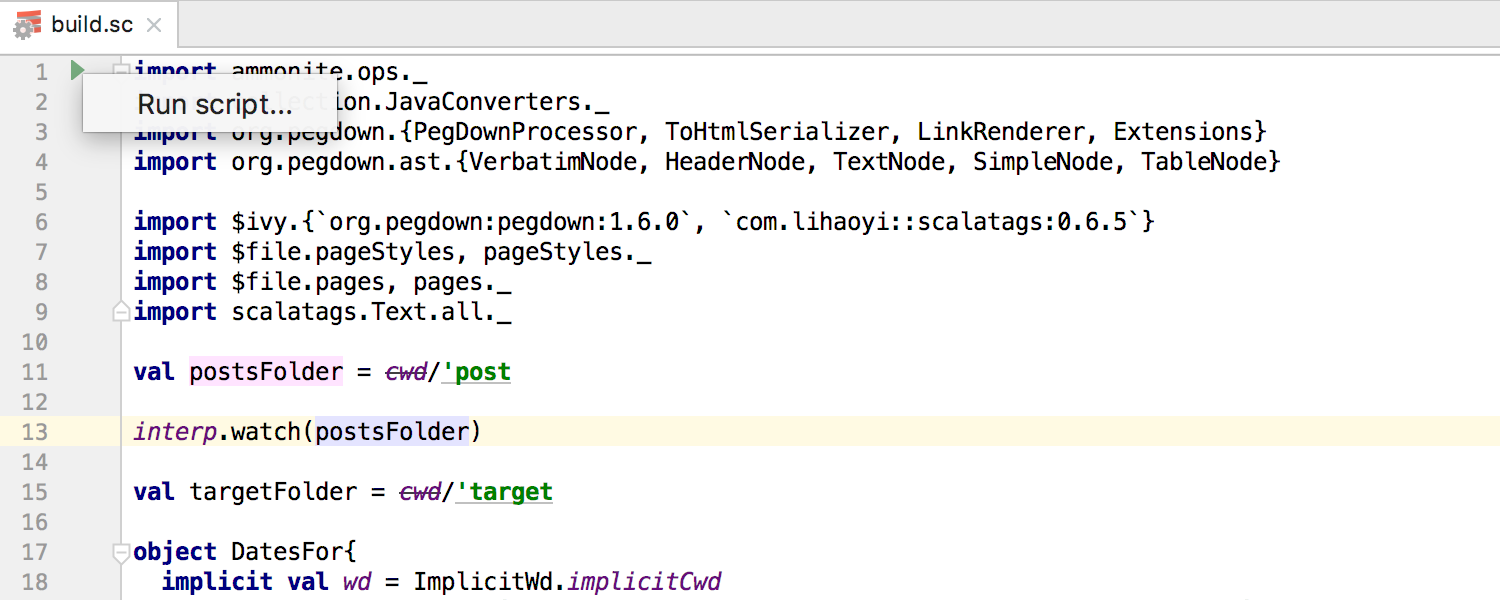
new version of the plugin supports Ammonite and offers syntax highlighting, tooltips, navigation, and a separate Run Configuration type :
The creation of Scala projects has changed. Now, instead of Lightbend Activator (which ceased to exist in the middle of this year), the plugin suggests using project templatesTech Hub Project Starter.
Работа с Git и Mercurial
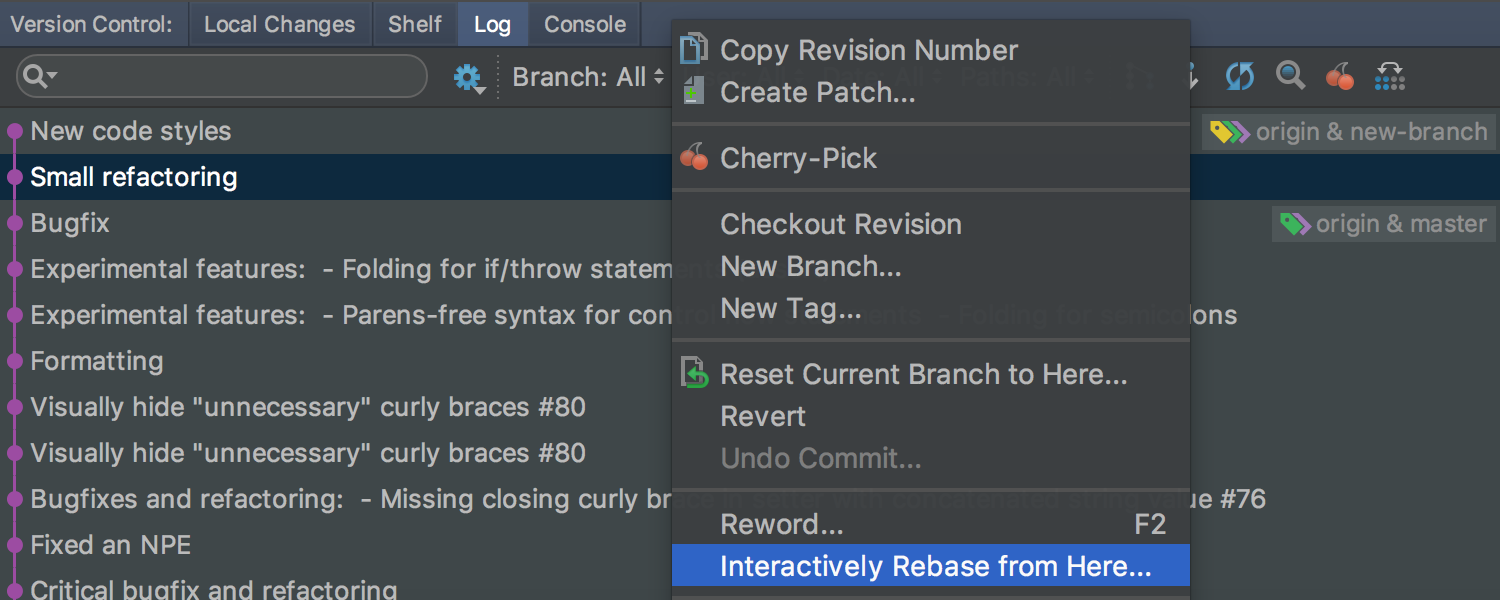
Теперь можно интерактивно ребейзить (rebase) последние изменения в Git, вызвав Interactively Rebase from Here из Log:
При переключении между ветками IDE сохраняет состояние workspace: расположение вкладок редактора, окон инструментов, и т. п.:
Для удобства работы изменениями, участвующими в слиянии (merge), в Log добавлен новый режим: Show Changes to Parents. В этом режиме правая панель в Logshows not only changes in files with conflicts, but also separately non-conflict changes for each branch participating in the merge:

The mode can be activated in the context menu.
To view conflicting changes for Git , the Log IDE now offers a three-panel interface.
When sending changes from a patch, the IDE automatically puts down the name, author’s mail and a description of the change, if they were in the patch:

Synchronize IDE settings between different computers
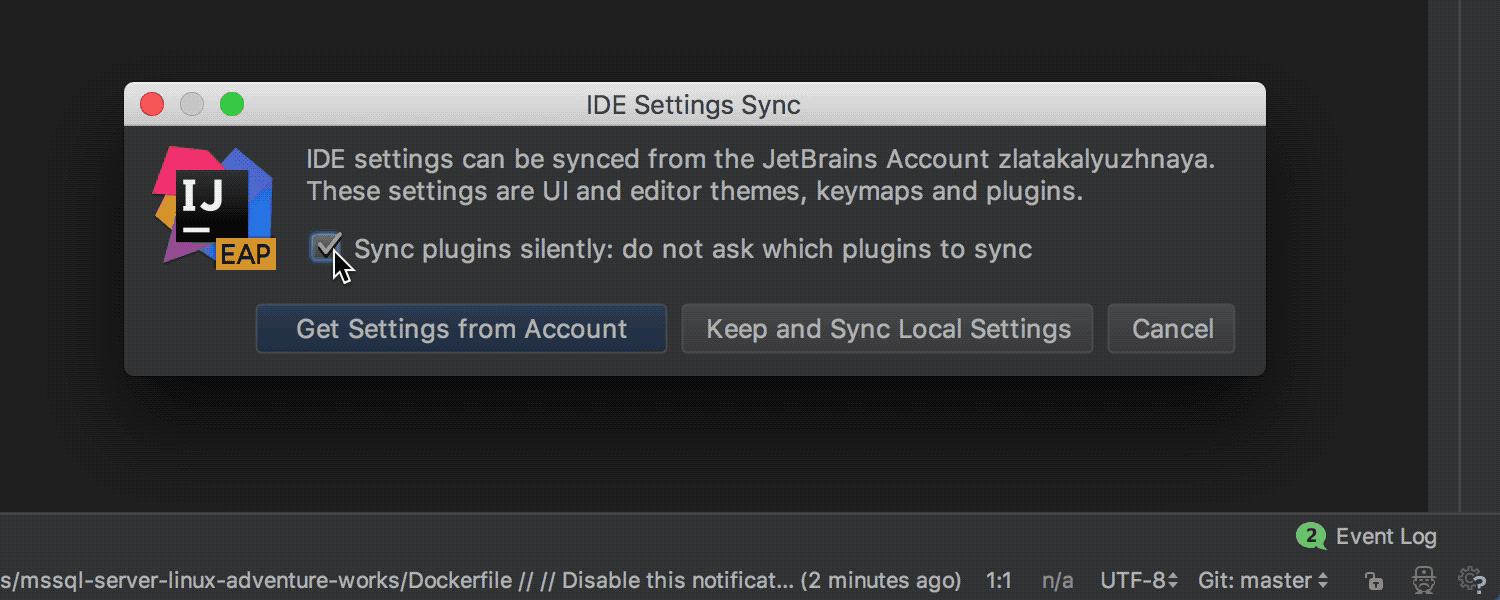
Sometimes it happens that the IDE is installed at work and at home, on a desktop computer and on a laptop, etc. Previously, you had to configure the IDE on each computer. Some time ago, you could use a plugin to automate this process. When using this plugin, the settings were stored in the specified Git repository. IntelliJ IDEA Ultimate 2017.3 has a new mechanism that does not require a Git repository: all settings are stored in a secure form on the JetBrains server. Another advantage of the new mechanism is the synchronization of not only settings, but also directly installed plugins. To use the new mechanism requires a JetBrains Account .
Changes to the Docker Plugin
In this release, we continue to improve the plugin for Docker. Of the most notable:
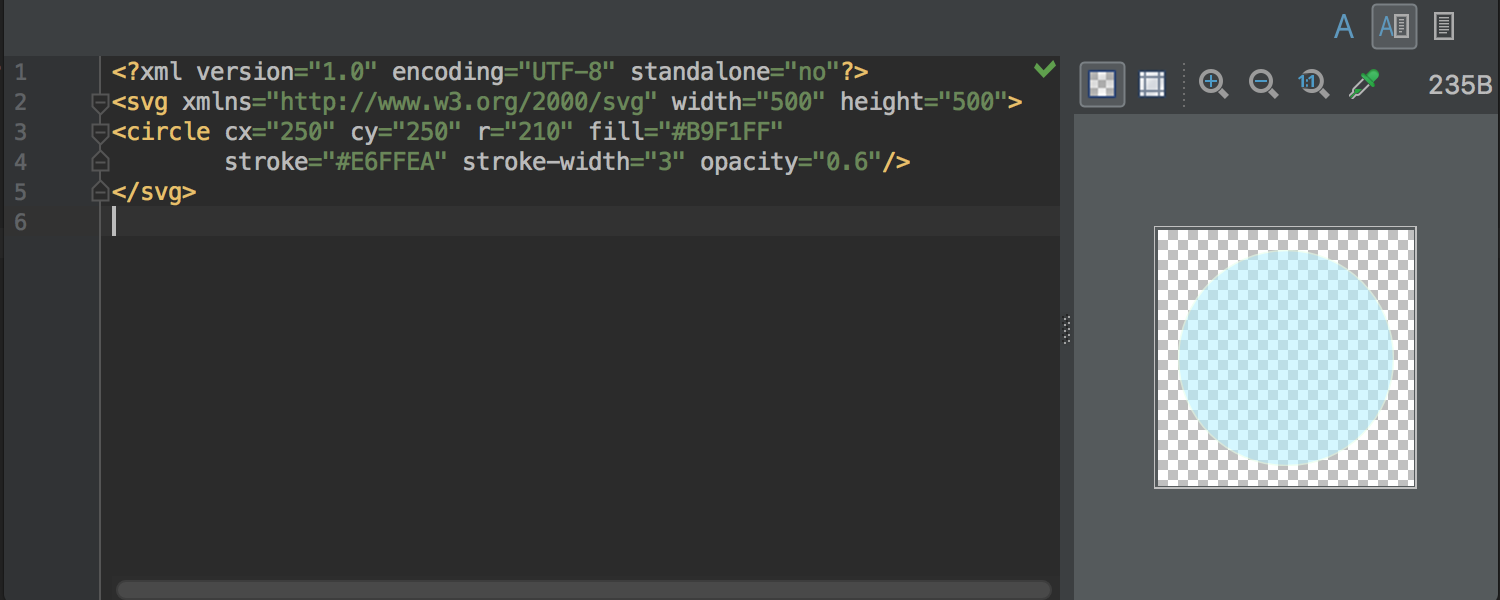
Preview for SVG files
Now, when opening an SVG file in the editor, the IDE will offer a visual preview of this file on the right side:
Visual boundaries in the editor
Previously, the IDE had the Right margin setting , which was displayed in the editor and was taken into account in the code styles . In the new release, this setting was renamed to Hard wrap at , and in addition to it, a new Visual guides option was added . With it, you can specify comma-separated values for several visual boundaries at once. These borders will also be displayed in the editor:
Mainly, this is necessary in cases where the rules for the design of the code refer to several such boundaries (this is possible, for example, for Python and in PHP).
Database Tools (DataGrip 2017.3)
JavaScript and TypeScript support (WebStorm 2017.3)
As you can see from this post, IntelliJ IDEA 2017.3 has a lot of new and interesting things, apart from a few hundred bug fixes and fewer features that simply would not fit in one post.
You can download the update through the Toolbox App or from the official website . I will be glad to answer any questions. Questions that I can’t answer myself, I will send to the team.
UPDATE: GoLand 2017.3 has been released, and now it can be bought. IntelliJ IDEA Ultimate users get GoLand functionality for free with the plugin: plugins.jetbrains.com/plugin/9568-go
Program with pleasure!
Go!
Type casting for call chains in Smart Completion
In the previous release (IntelliJ IDEA 2017.2), method call chains began to appear on the first call of Smart Completion (before that they were available only on the second call). In this release, these chains also allow for automatic type conversion based on context:
Analysis of code execution flow
A couple of years ago, IntelliJ IDEA learned how to automatically output Nullable and NotNull annotations for parameters and return values of library class methods. This conclusion was made on the basis of the analysis of the flow of execution inside the methods. In version 2017.3, the output of annotations for parameters works not only for library class methods, but also for private or final class methods inside a project.
In case of annotation output in a similar method, the IDE offers quick-fix for explicit declaration of annotation:
Also, the IDE learned to detect potential Nullability problems inside Stream API method calls. If a potential problem is detected, the IDE reports this and, where possible, offers to automatically make changes to the code in order to avoid errors during execution:
Transforming a for loop into a Stream API call chain for
loops , the result of which is adding lines to StringBuilder , now you can automatically transform into a chain of Stream API calls using Stream.collect and Collectors.joining : Inverting the logic of boolean methods using quick-fix Invert Boolean refactoring is now available as quick-fix for methods (previously quick-fix was only available in
batch mode , as well as for variables, constants and fields of the class):
Separate method calls on collections and Stream API call chains
Where it makes sense, now the IDE suggests replacing individual sort and toArray calls on collections with the corresponding methods on the Stream API call chain :
Detecting duplicate keys in Map and Set initialization
If you accidentally specify a value for the same key two or more times or try to add the same element to Set , the IDE will now warn you of a possible error:
Detection of excessive exception
declarations fishing redundant exception declarations previously worked only forfinal and private methods. Now detection works for any methods:
This particular inspection can be disabled for so-called entry points, for example for tests.
Migrating deprecated methods
When an explicit alternative is specified for the deprecated method, the IDE offers a quick-fix for auto-replace:
Migrating from JUnit 4 to JUnit 5
If both JUnit 4 and JUnit 5 are present in the module , the IDE offers quick-fix for automatic migration from JUnit 4 on JUnit 5 :
Run Dashboard for all types of Run Configuration
Run DashboardIt was previously available only for Spring Boot applications, and now can be used for any type of Run Configuration . To do this, open the Edit Run Configurations dialog , select Defaults and add the appropriate configuration types to the Run Dashboard Types list :
Run Dashboard offers a convenient interface for launching and managing several Run Configurations :
Debugger for JVM
In this release, more attention was paid to accounting and optimization of computational costs the resources ( overhead ) that Debugger introduces into the starting process due to the processing of breakpoints (breakpoints ) and value displays (using Data Renderers ) in the Variables , Watches , Evaluate Expression , Inspect, and other tabs .
To account for these resource costs , a new Overhead tab has been added to the Debug tool window . This tab displays the cumulative number of calls to Breakpoints and Data Renderers (given the option Enable 'toString ()' object view , used by default if a specific Data Renderer is not specified ): In addition, any Data Renderer can be marked as
On-demand . This will mean that the value will be calculated and displayed only if necessary (by clicking): You can
mark Data Renderer as On-demand in the Java Type Renderers settings :
either by selecting Mute Renderers in the context menu on a specific value:
We also optimized the cost of resources for calculation Async Stacktraces . In addition, Async Stacktraces does not need to be further configured. Now they work right away, out of the box. Java Stream Debugger
plugin that helped debug Stream API call chains, is now part of the IDE and is available during debugging ( Trace Current Stream Chain button in the Debug tool window ):
Tips and navigation for Java EE 8 The
new release fully supports the Java EE 8 standard and offers additional tips, navigation and other nice features for Asynchronous CDI Events , CDI Bean Injection , PushBuilder , Disposes and Produces :
Support for Spring and Spring Boot
Now the IDE can automatically detect and configure MVC Context in the Spring Facet settings for applicationsSpring Boot :
The Endpoints tab in the Spring Boot application launch and debugging window , which helps monitor the running application, now supports Spring Boot 2.0 Actuator Endpoints .
The highlighting in Spring Boot application configuration files now takes into account the type of values:
In the dependency diagrams between the beans ( Spring Beans Diagram ), a new interesting mode has appeared: Neighborhood . In this mode, only direct dependencies are displayed. When you select one of the dependencies, you will see direct dependencies for the selected bin, etc. Thus it is convenient to navigate between the dependencies:
Working with modules
If you marked some modules as “unloaded” (unloaded ) and when updating the VCS project , new modules were created, earlier they were automatically marked as “loaded” ( loaded ). Now, in those cases when the modules marked as “loaded” do not depend on these modules, these modules are automatically marked as “unloaded”.
Also, before committing, the IDE now checks that the "unloaded" modules compile without errors.
In addition, the way grouping modules during display has changed. Previously, groups of modules that could be created in Project Structure were used for this . Now, using the same mechanism that is used to group packages structure ( -packages ): name of the module is divided symbol point and forms a tree:
Building the project
Earlier, when using Gradle, running applications and tests in the mode of collecting statistics on code coverage ( Run with Coverage ) did not work if the option Delegate IDE build / run actions to Gradle or Gradle Test Runner was enabled . Now Run with Coverage works in all cases.
The process of importing, compiling and building a project for Gradle , Android / Gradle and SBT can now be seen in the new Build tool window :
Working with REST requests
Now working with REST-queries can be done using a new tool based on the editor. To do this, just create a file in the project with .http permission and open it in the editor. If you do not want to create a file in the project, you can use Scratch File :
Kotlin
Following the release of Kotlin 1.2 , which happened yesterday, the language support in the IDE has been updated. The main innovation of the update is the experimental possibility of “reusing code” between the JVM and JavaScript :
Using the expect keyword, any class or method can now be declared as “general”. The implementation of this class or method for a specific platform can be declared using the keywordactual в модуле для соответствующей платформы. IDE проверяет, что реализация существует для сконфигурированных платформ, и позволяет переходить от декларации к реализациям и обратно:
Подробнее о работе «общих модулей» (common modules) можно прочитать в этом хабрапосте или в официальной документации (на английском). Обязательным условием работы таких модулей является сборка проекта Gradle.
Scala
Подсветка символа под кареткой (которая включена по-умолчанию, как и та, которая доступна по нажатию Shift+Ctrl/Cmd+F7) теперь подсвечивает также неявное (implicit) использование символа:
The assembly and launch of the application or tests are no longer tied to indexing and work even if indexing has not yet ended.
In SBT projects, when a plugin notices a dependency import expression that is not specified in the SBT configuration but is present in the local Ivy Cache , the IDE offers to add it to the SBT configuration: The
new version of the plugin supports Ammonite and offers syntax highlighting, tooltips, navigation, and a separate Run Configuration type :
The creation of Scala projects has changed. Now, instead of Lightbend Activator (which ceased to exist in the middle of this year), the plugin suggests using project templatesTech Hub Project Starter.
Работа с Git и Mercurial
Теперь можно интерактивно ребейзить (rebase) последние изменения в Git, вызвав Interactively Rebase from Here из Log:
При переключении между ветками IDE сохраняет состояние workspace: расположение вкладок редактора, окон инструментов, и т. п.:
Для удобства работы изменениями, участвующими в слиянии (merge), в Log добавлен новый режим: Show Changes to Parents. В этом режиме правая панель в Logshows not only changes in files with conflicts, but also separately non-conflict changes for each branch participating in the merge:
The mode can be activated in the context menu.
To view conflicting changes for Git , the Log IDE now offers a three-panel interface.
When sending changes from a patch, the IDE automatically puts down the name, author’s mail and a description of the change, if they were in the patch:
Synchronize IDE settings between different computers
Sometimes it happens that the IDE is installed at work and at home, on a desktop computer and on a laptop, etc. Previously, you had to configure the IDE on each computer. Some time ago, you could use a plugin to automate this process. When using this plugin, the settings were stored in the specified Git repository. IntelliJ IDEA Ultimate 2017.3 has a new mechanism that does not require a Git repository: all settings are stored in a secure form on the JetBrains server. Another advantage of the new mechanism is the synchronization of not only settings, but also directly installed plugins. To use the new mechanism requires a JetBrains Account .
Changes to the Docker Plugin
In this release, we continue to improve the plugin for Docker. Of the most notable:
- Docker Deployment Run Configuration is divided into 3 separate Run Configurations : Dockerfile ( building the image from the Dockerfile and launching the container based on the resulting image), Docker Image (starting the image, equivalent to the “ docker run ” command ) and Docker Compose (starting services).
- In Docker Image Run Configuration, you can now specify the command line directly (previously, the IDE required the creation of a special JSON file).
- In Dockerfile Run Configuration, now you can only collect the image and not run it as a container.
- Now you can assemble an image or launch a container based on this image directly from the Dockerfile editor (by clicking on the panel to the left of the editor).
- The IDE supports alternative names for Dockerfile and docker-compose.yml files.
- The Docker tool window is now hidden by default until the Docker settings in Settings are added .
Preview for SVG files
Now, when opening an SVG file in the editor, the IDE will offer a visual preview of this file on the right side:
Visual boundaries in the editor
Previously, the IDE had the Right margin setting , which was displayed in the editor and was taken into account in the code styles . In the new release, this setting was renamed to Hard wrap at , and in addition to it, a new Visual guides option was added . With it, you can specify comma-separated values for several visual boundaries at once. These borders will also be displayed in the editor:
Mainly, this is necessary in cases where the rules for the design of the code refer to several such boundaries (this is possible, for example, for Python and in PHP).
Database Tools (DataGrip 2017.3)
- If you work with a large number of data sources , these data sources can now be organized into groups.
- For the convenience of working with numerical data in the table, they are now aligned to the right.
- For PostgreSQL , the Database toolbar displays Users and Roles , and Foreign Data Wrappers are also supported .
- Data in the table can now be inserted from Excel.
- Several values of the table can now be compared with each other.
- Export to DDL now supports more options and is available through ( Context menu | SQL Scripts | SQL Generator ).
- Auto-completion for JOIN has become a little smarter.
- Exasol database support .
- Backlight for XQuery and XPath for Sql Server through Language Injection .
JavaScript and TypeScript support (WebStorm 2017.3)
- For Vue.js , code completion and navigation for props, properties and methods, as well as a new collection of code templates, have appeared.
- New Pull member up and Extract superclass refactorings for JavaScript and TypeScript classes.
- New refactoring Extract type alias and Extract interface for TypeScript .
- Updated documentation and improved auto-completion for standard JavaScript methods and objects . Project discovery is faster thanks to pre-built indexes for these methods.
- Support for watch mode for Jest and Mocha , reports on code coverage with tests for Jest and the ability to easily update Jest snapshots in one click.
- Imports in JavaScript and TypeScript files are now added automatically when copying and pasting code from one file to another.
- Debugging client applications in WebStorm no longer requires the installation of an additional extension for Chrome . But the extension is still needed for Live Editing , which is now disabled by default.
As you can see from this post, IntelliJ IDEA 2017.3 has a lot of new and interesting things, apart from a few hundred bug fixes and fewer features that simply would not fit in one post.
You can download the update through the Toolbox App or from the official website . I will be glad to answer any questions. Questions that I can’t answer myself, I will send to the team.
UPDATE: GoLand 2017.3 has been released, and now it can be bought. IntelliJ IDEA Ultimate users get GoLand functionality for free with the plugin: plugins.jetbrains.com/plugin/9568-go
Program with pleasure!