Zabbix 3.4: Mass data collection using Mercury and smartmontools counter examples
- Tutorial

Hello everyone, we previously mentioned the possibilities for mass data collection in the new version of the open source monitoring system Zabbix 3.4. Now let’s dwell on this functionality in more detail, and to make it clearer, we will talk about it with two examples:
- collecting all the data at a time received in JSON from the console utility of the electricity meter Mercury 236
- collection of SMART indicators of hard drives and SSDs obtained in tabular form from smartmontools.
And what was the actual problem?
It was possible to collect data through console utilities or API calls earlier, but there were difficulties:
- slow startups of utilities every time for every needed data item
- access to the resource (disk, port, counter, application API) for each data element
- parsing the result had to be done with external scripts / utilities
- and if later it was necessary to correct the parsing - you had to update UserParameters or scripts again
- among other things, simultaneous requests from several Zabbix pollers led to an error when accessing, for example, a serial port.
In general, it was like this:
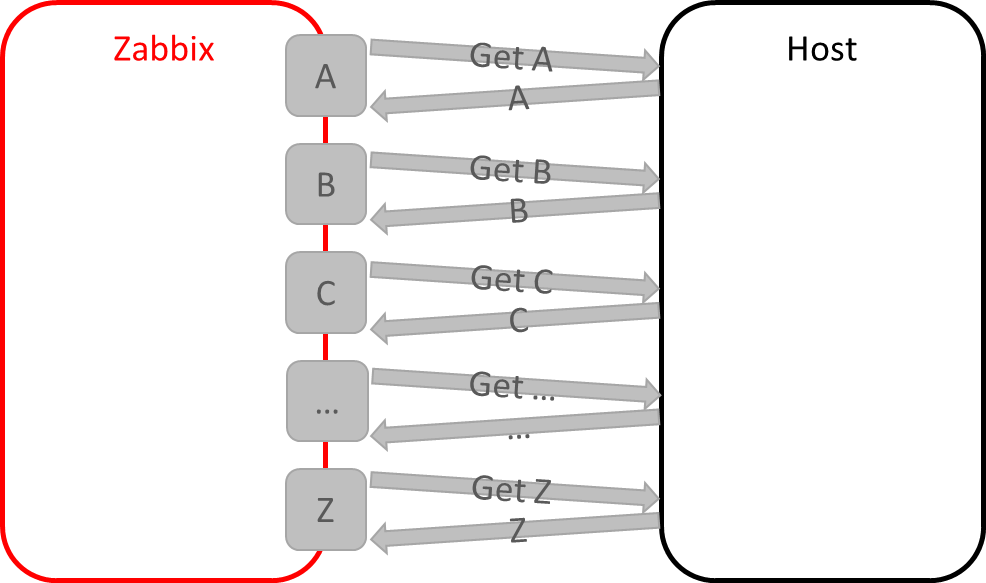
And with the advent of dependent data elements , it became possible like this:
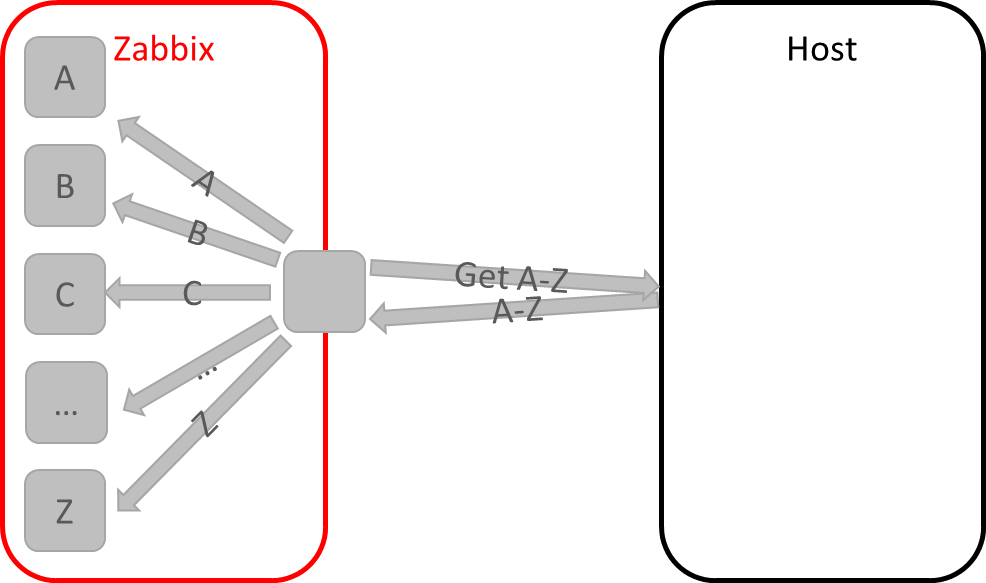
How does it work?
- In Zabbix 3.4, the data source can be another data item called a parent or master item. Such an element may, for example, contain an array of data in JSON, XML, or arbitrary text format.
- When new data arrives at the parent element, the rest of the data elements, which are called dependent, access the parent element and use the preprocessing functions such as JSON path, XPath or Regex to extract the desired metric from the text.
By the way, preprocessing is also an innovation 3.4, it is implemented by adding new processes preprocessing_manager and preprocessing_worker on a Zabbix server. Therefore, if you are upgrading from 3.2 - do not forget to update the template for the server to monitor their work.
We pass to examples.
Mercury 236
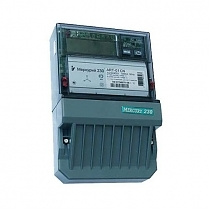
Imagine that on our project, in addition to containers, virtual machines, applications, network devices, databases, business indicators and everything else that requires monitoring, there is a need to monitor the performance of the power grid and other “engineers”, such as climate equipment. The devices that are standard for our mid-band are used: a three-phase electricity meter Mercury 236 ART-01 PQRS with an RS-485 interface, on top of which communication occurs through the manufacturer’s proprietary protocol.
The responsible task is to immediately collect indicators of voltage, power, current, consumption, frequency. Connecting such a device to a server with a Zabbix agent is a feasible task - a serial port with RS-485, for example, in the form of a USB adapter, will be enough. But how to read the data? If not for github andkind people who shared their solution for a smart home, would write us a module to Zabbix, which we would learn to talk on the counter protocol and interrogate indicators.
The utility is simple and convenient (for which many thanks to the author) the author connects to the counter on the specified port, reads the data and gives it to us in the form of text, CSV or JSON.
Let's try to install and run: Starts up! Great, we connect the counter, interrogate, we get JSON: ./mercury236 / dev / ttyS0 --json
git clone https://github.com/Shden/mercury236.git

cd mercury236

make

./mercury236 /dev/ttyS0 --help

Usage: mercury236 RS485 [OPTIONS] ...

 RS485 address of RS485 dongle (e.g. /dev/ttyUSB0), required

 --debug to print extra debug info

 --testRun dry run to see output sample, no hardware required

 Output formatting:

....

 --help prints this screen
{
                "U": {
                               "p1": 0.35,
                               "p2": 0.35,
                               "p3": 226.86
                },
                "I": {
                               "p1": 0.00,
                               "p2": 0.00,
                               "p3": 0.39
                },
                "CosF": {
                               "p1": 0.00,
                               "p2": 0.00,
                               "p3": 0.60,
                               "sum": 0.60
                },
                "F": 50.00,
                "A": {
                               "p1": 41943.03,
                               "p2": 41943.03,
                               "p3": 41943.03
                },
                "P": {
                               "p1": 0.00,
                               "p2": 0.00,
                               "p3": 53.45,
                               "sum": 53.45
                },
                "S": {
                               "p1": 0.00,
                               "p2": 0.00,
                               "p3": 89.83,
                               "sum": 89.83
                },
                "PR": {
                               "ap": 120.51
                },
                "PR-day": {
                               "ap": 86.00
                },
                "PR-night": {
                               "ap": 34.51
                },
                "PY": {
                               "ap": 0.00
                },
                "PT": {
                               "ap": 0.04
                }
}
As a result, the utility has already done all the difficult work for us, implementing a protocol for communicating with the counter, pulling out the data, and even offered it to us in the form of a convenient JSON object. Only earlier, just like that, we would not be able to use it - we would have to write the binding in the form of scripts, and most importantly, implement a mechanism for controlling access to the serial port environment. Indeed, if two Zabbix pollers simultaneously turned to it - one after the current of the third phase 3, and the other - after the current of phase 2, nothing would come back to us.
In 3.4, everything becomes much simpler, and now we can quickly and easily transfer data from third-party console utilities to Zabbix without resorting to wrapping scripts and without running 10 times the same thing on each data element separately. So,
Configure the launch of the mercury236 utility from Zabbix
sudo cp mercury236 /etc/zabbix/scripts

cd /etc/zabbix/scripts

chmod +x mercury236

sudo usermod -G dialout zabbix
To run the script, create a new UserParameter in the Zabbix agent config :
UserParameter=mercury236[*],/etc/zabbix/scripts/mercury236 $1 $2We save the file, do not forget to restart our Zabbix agent.
Now let's create a parent data element in the new template:
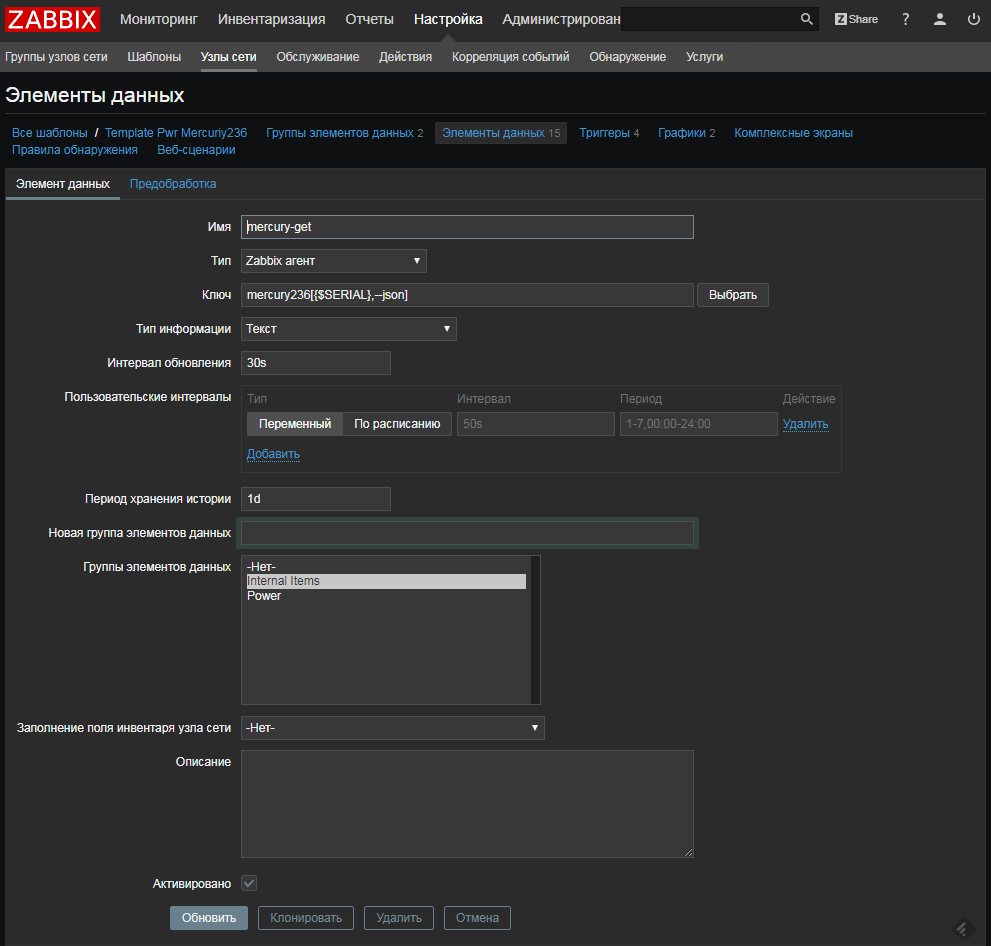
As you can see, there is nothing special in the parent data element - just check through the UserParameter Zabbix agent. And this means that there are no restrictions on what type of verification can act as a parent element - here there can be data received through Zabbix trapper or through External checks. The only thing we have chosen is the Information Type - Text and the history storage period of 1 day - to store longer, we are going to store the metrics separately in dependent elements (we can not store data at all in the parent element, setting the storage period to 0). Please note that we do not touch the preprocessing in this data element.
Set up getting our meter metrics
To start creating dependent data items, you can use the new assistant. Well, or just click "Create a data element":
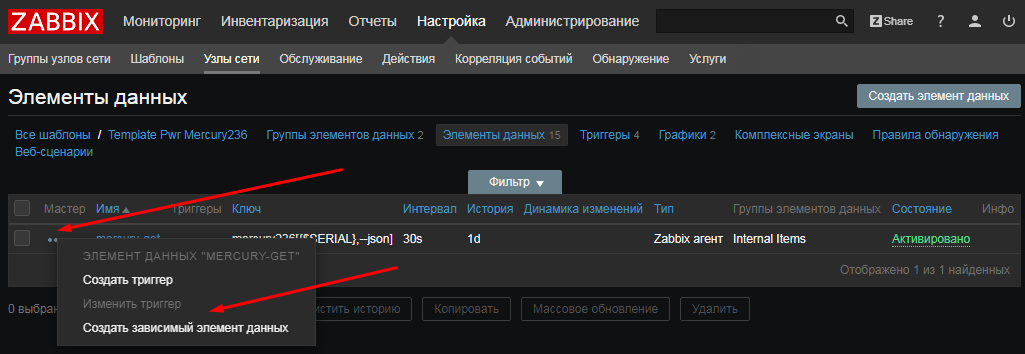
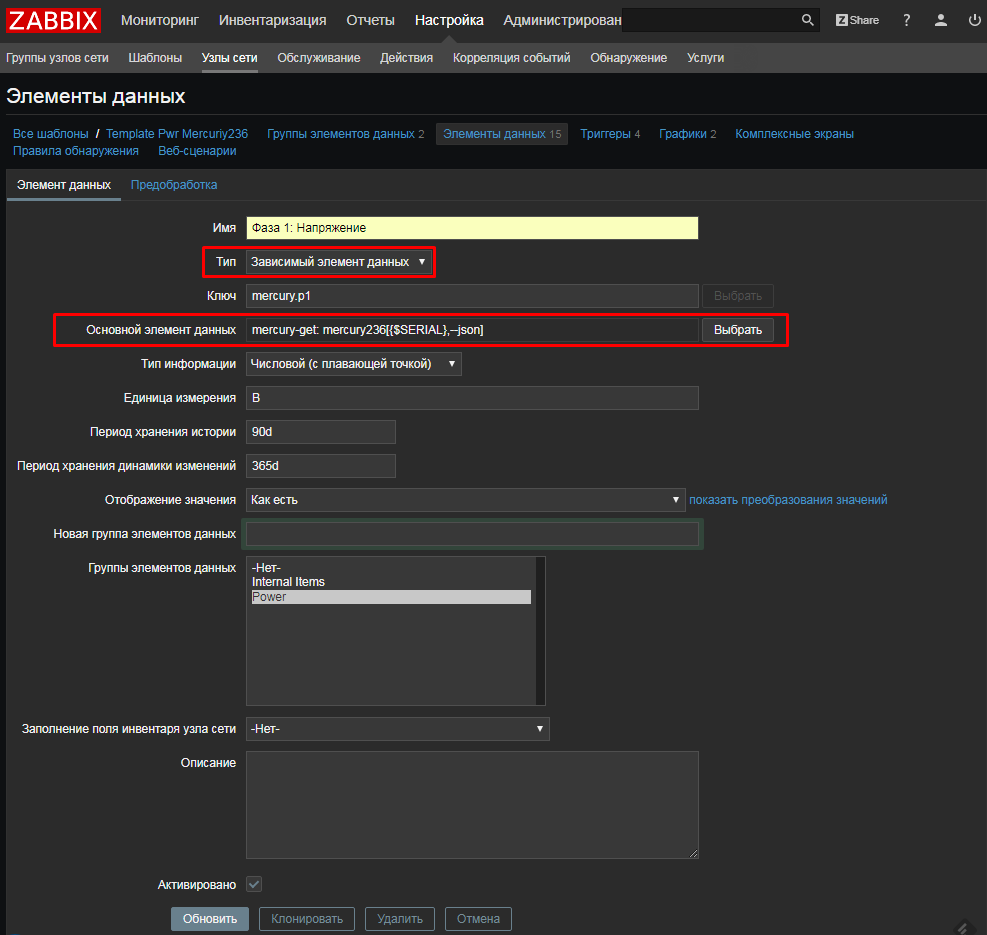
Create a data element for the voltage of the first phase, select:
- Type: Dependent Data Item
- Primary Data Item: mercury-get
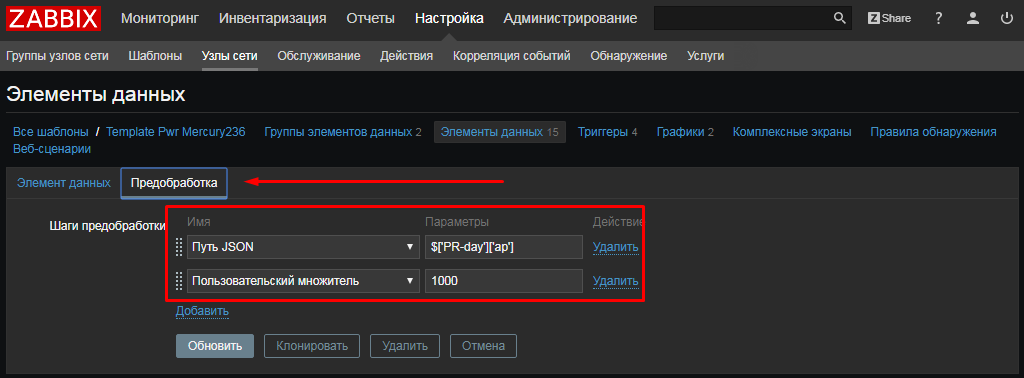
Then in the “Pre-Processing” tab, add our JSON Path expression:
JSON path: $ .U.p1

By the way, a little tip. In order not to spend a lot of time debugging and catching errors, before filling out the JSON Path, you can quickly check the correctness of the expression online, for example here: jsonpath.com by copying the JSON received from the utility there.
Similarly, we create other metrics that interest us. Including - for the accumulated energy at the daily rate.
To do this, create a new data item and select:
- Type: Dependent Data Item
- Primary Data Item: mercury-get
But in the “Pre-processing” tab, pay attention to two nuances:
- we will use notation with square brackets, since there is a hyphen in the JSON path
- preprocessing can be multi-step, for example, here we multiply the result of the first step by 1000 to get W * h from kW * h
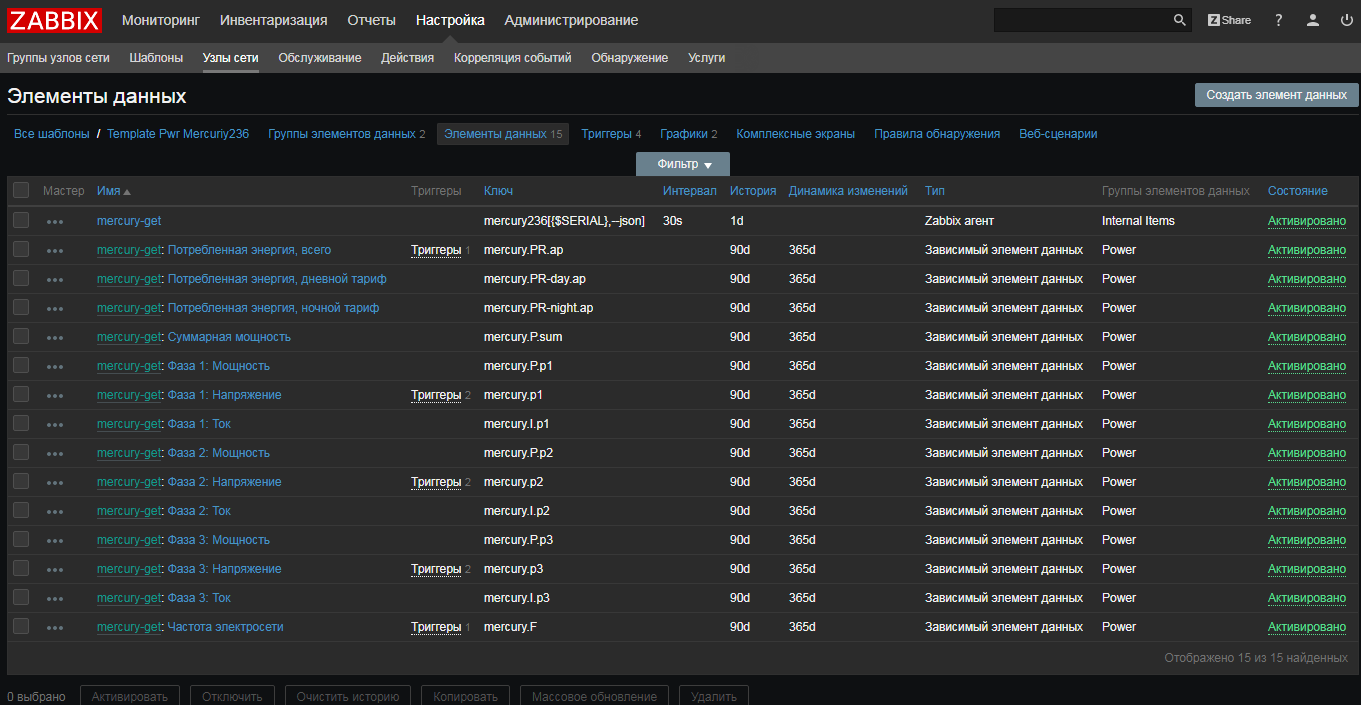
Let's do the same for the remaining key metrics of the counter, in the end we get this list:
Let's bring our template to mind
To make the template complete, we add triggers using macros , making it as flexible as possible. Do not forget about trigger dependencies .
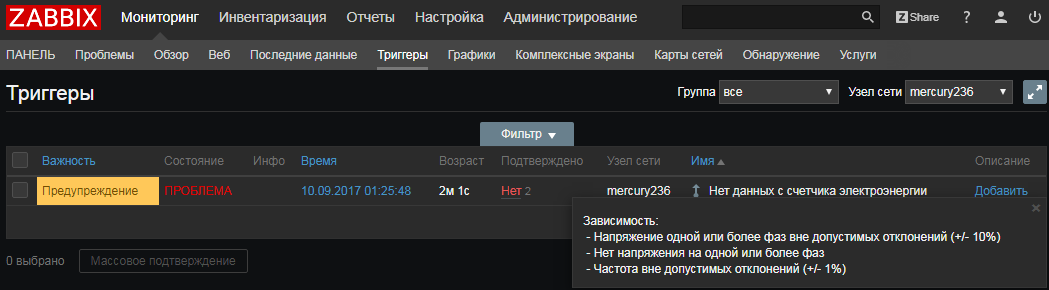
What happened
The template is ready, the data ran, let's see what we got:

All the latest data collected in one call:
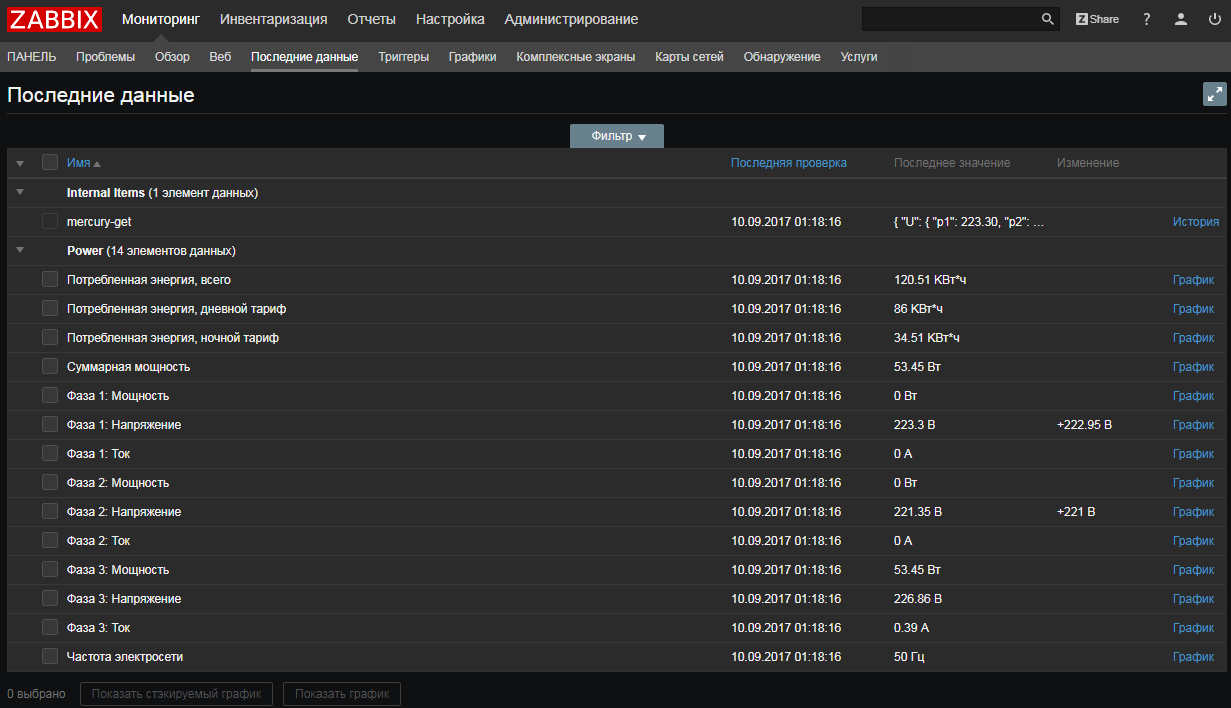
Please note that the collection time for all metrics is absolutely identical.
The final template for the counter is available on the solution repository at share.zabbix.com here .
To summarize:
- reused a good program and did not waste time writing their implementation of data collection according to the Mercury protocol
- UserParameter remained, but collapsed to a simple call. In fact, you can even system.run [] use
- scripts-wrappers did not write either. All parsed through the JSON path in the template
- the counter wasn’t tormented much, one request - all the data we need at once.
Smartctl and smartmontools
For a long time we already wrote on a habr how it is possible to control SMART of hard drives in order to manage to change them in time, through use of UserParameters. This approach works, but it was not without flaws:
- redundant starts of the smartctl utility, and it, in turn, turned to the hard disk controller each time
- I had to do separate parsing for Linux and Windows. It is especially painful to work with Win now: (for / F ... so ... escape double quotes with more quotes .... Ahhh !!!!)
We will try in 3.4 to get rid of all this.
The case with smartmontools has two differences from the example with the counter above:
- smartctl does not return JSON to us
- There may be a different number of disks in the server, so we need to use low-level discovery (LLD).
But no big deal! Firstly, dependent data elements also work for LLD, and secondly, we also have PCRE regex among preprocessing filters. We will use it to get the necessary indicators from the not super structured response of the utility. Something like this:
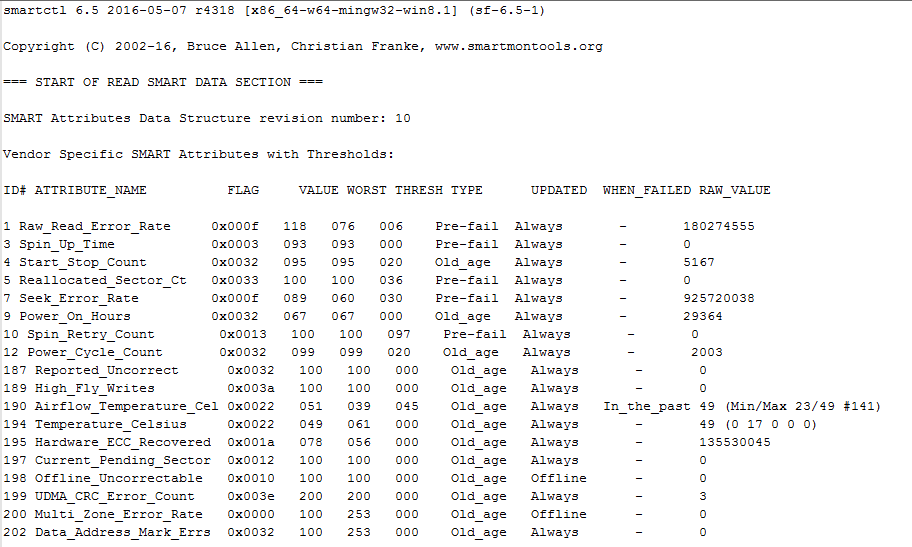
Let's get started.
Simplify UserParameters
It was:
UserParameter=uHDD[*], sudo smartctl -A $1| grep -i "$2"| tail -1| cut -c 88-|cut -f1 -d' '
UserParameter=uHDD.model.[*],sudo smartctl -i $1 |grep -i "Device Model"| cut -f2 -d: |tr -d " "
UserParameter=uHDD.sn.[*],sudo smartctl -i $1 |grep -i "Serial Number"| cut -f2 -d: |tr -d " "
UserParameter=uHDD.health.[*],sudo smartctl -H $1 |grep -i "test"| cut -f2 -d: |tr -d " "
UserParameter=uHDD.errorlog.[*],sudo smartctl -l error $1 |grep -i "ATA Error Count"| cut -f2 -d: |tr -d " "
UserParameter=uHDD.discovery,sudo /etc/zabbix/scripts/smartctl-disks-discovery.pl
It became:
UserParameter=uHDD.A[*],sudo smartctl -A $1
UserParameter=uHDD.i[*],sudo smartctl -i $1
UserParameter=uHDD.health[*],sudo smartctl -H $1
UserParameter=uHDD.discovery,sudo /etc/zabbix/scripts/smartctl-disks-discovery.pl
We do the same for Windows, simultaneously getting rid of CMD magic using for / F and find . You can see it here .
Create new parent data items
To collect all the SMART attributes, we will create a prototype of the master data element:
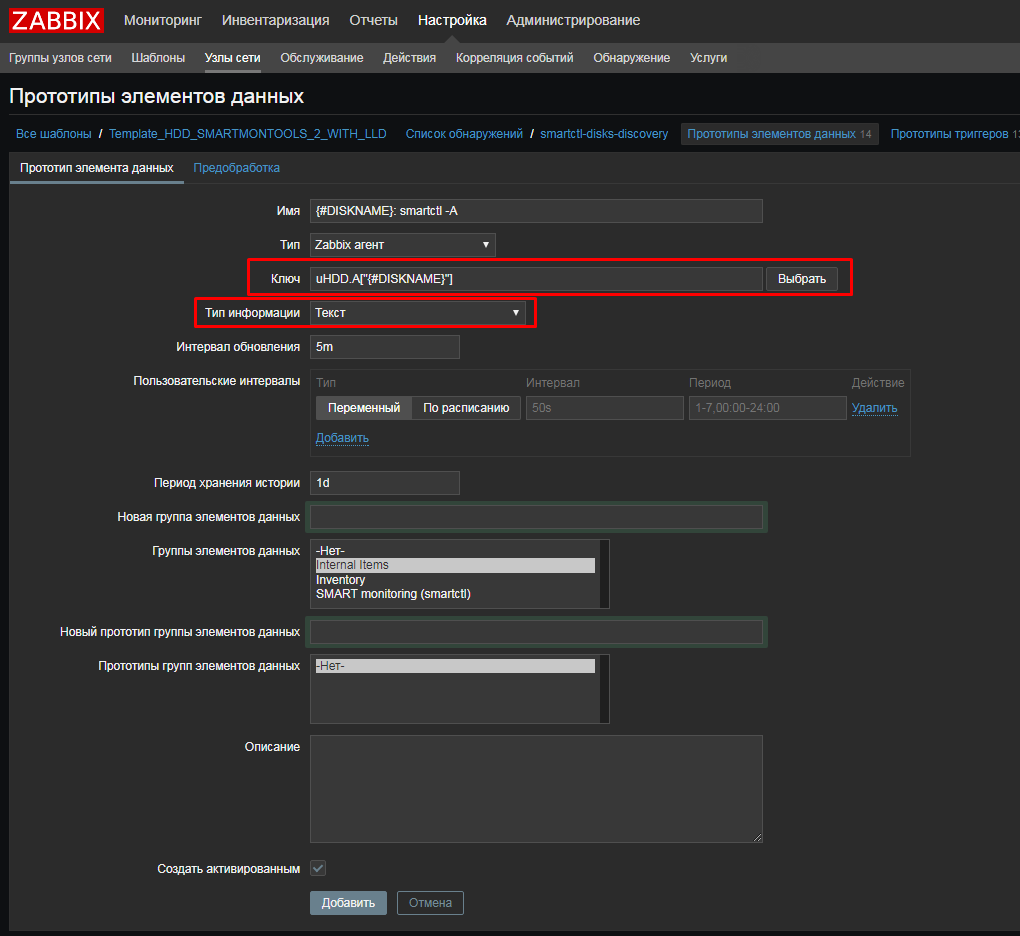
As in the previous example, nothing special needs to be configured. Only the Information Type is Text, and the Storage Period is 1 day.
To collect test results and inventory data, we need to run smartctl with other keys. Therefore, in the same way, we create two more data elements:
- uHDD.i ["{# DISKNAME}"]
- uHDD.health ["{# DISKNAME}"]
Set up getting our SMART drive attributes
Let's create a dependent data item for attribute 5, Reallocated :
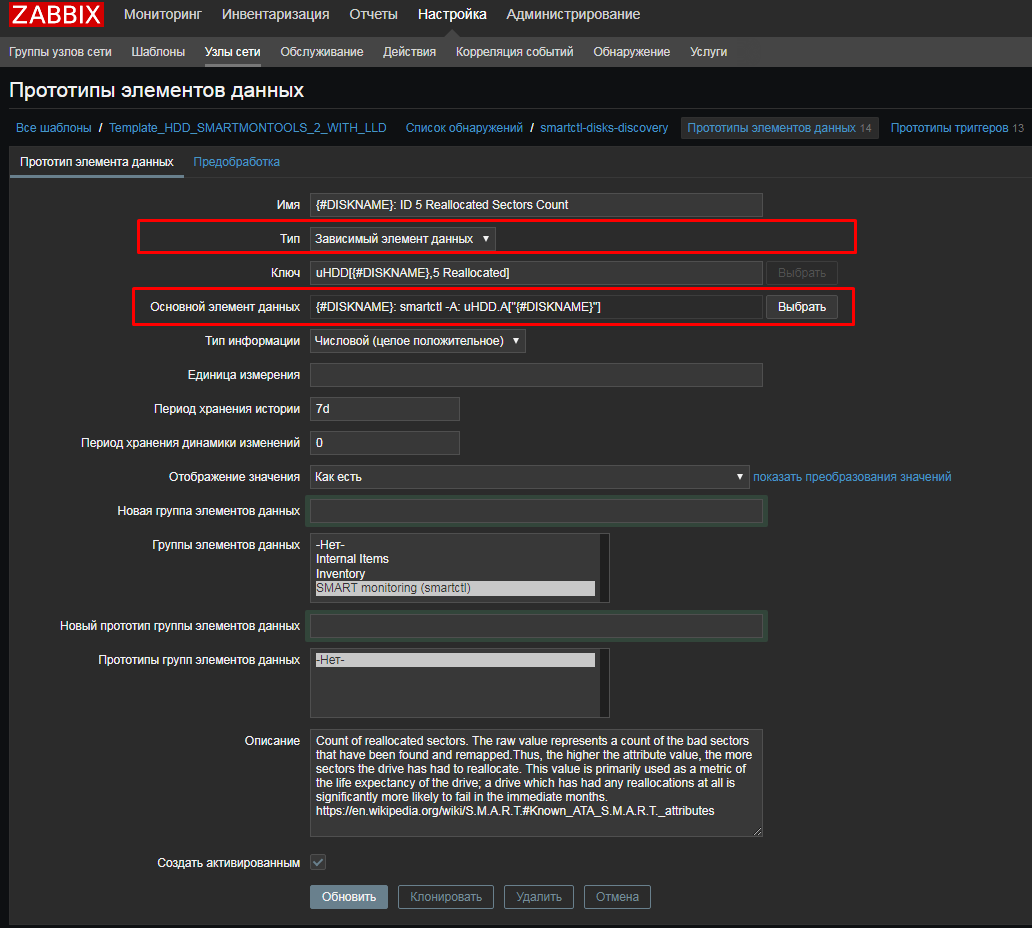
And in the “Pre-Processing” tab we use the regular expression:

And just like with JSON Path, in order not to spend a lot of time debugging and catching errors, before filling in regex, it’s convenient to quickly check the correctness online expressions, for example here: regex101.com by copying our smartctl output there.
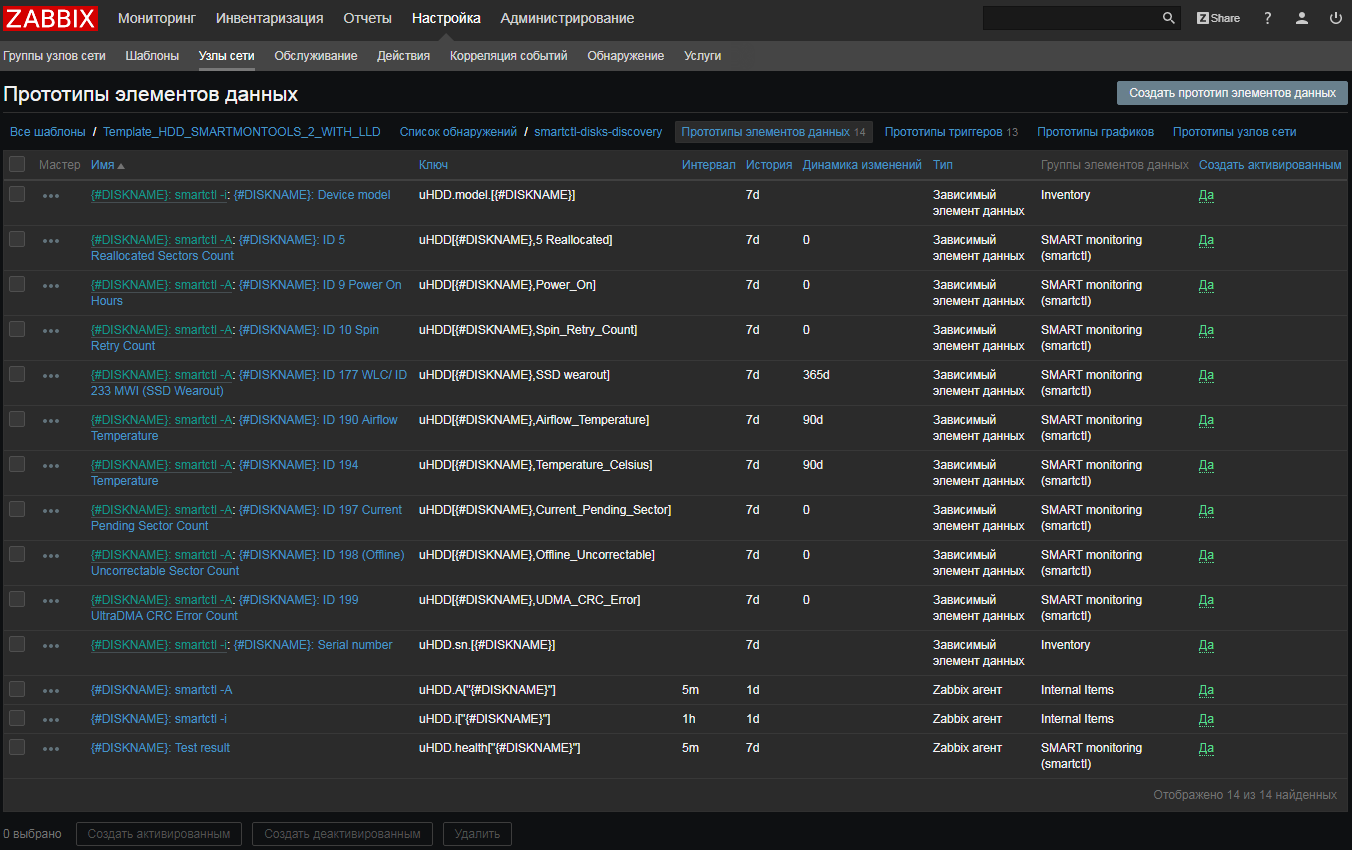
As a result, we get such a list of prototypes:
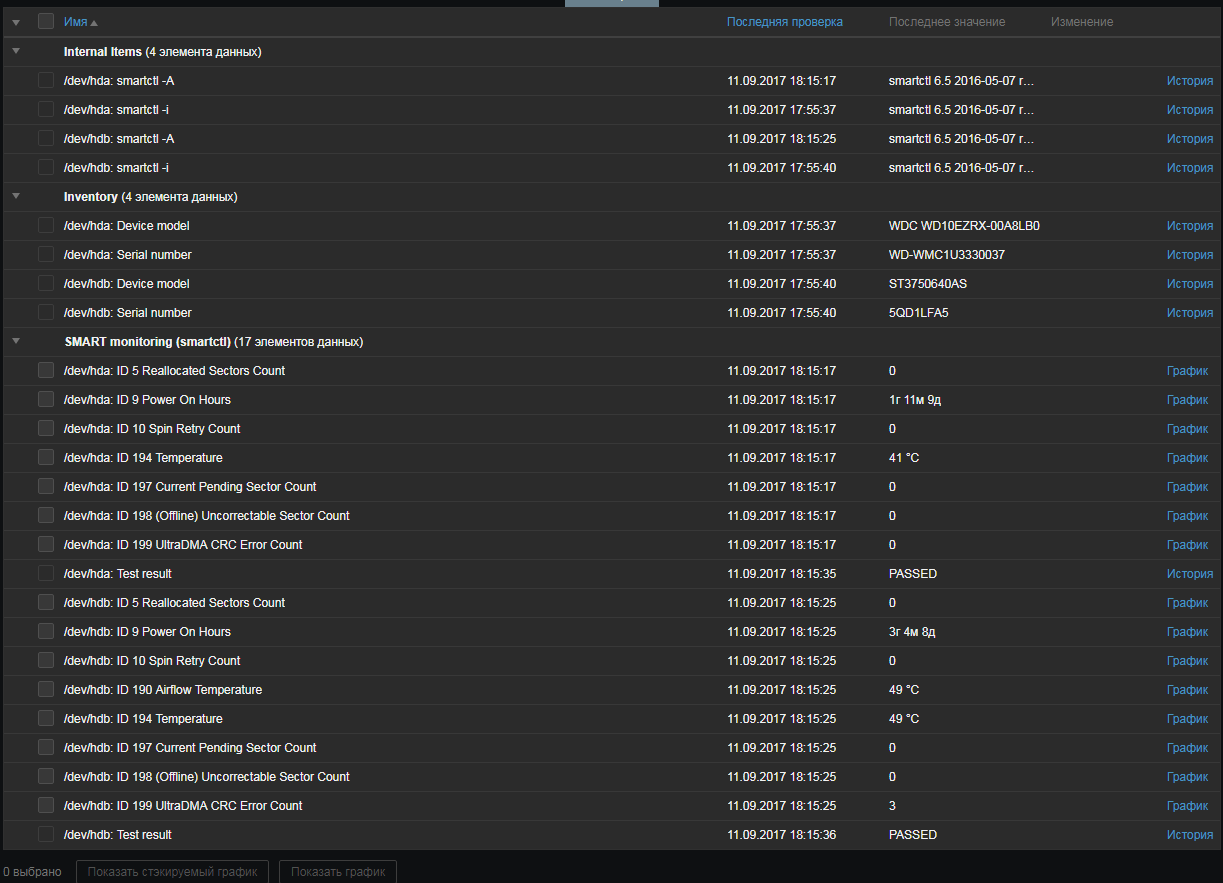
Testing, see what happened
For two HDDs:
For SSDs under Windows:
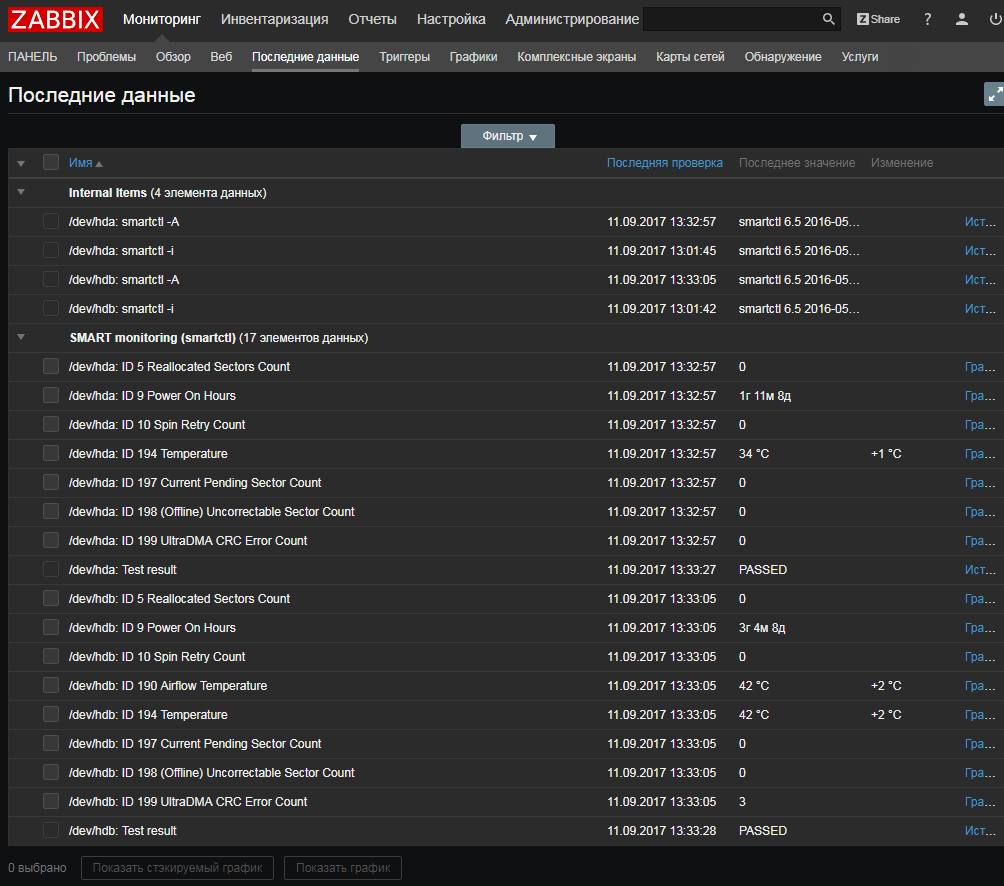
To summarize the example with smartmontools:
- we removed all parsing from UserParameters
- there are no external scripts (except LLD), there are no external dependencies, all parsing occurs on the Zabbix server, there it is easy to see and fix it, if necessary
- when a utility or API does not return XML / JSON - it doesn’t matter, you can always try using regular expressions
- we don’t torment hard drives anymore - first we get the entire list of SMART parameters, and then on the Zabbix server we arrange it in metrics.
An updated template (at the same time updated triggers, added data elements for SSD) is available on the solution repository on share.zabbix.com here .
At the end
Mass collection of metrics is a simple and easy way to reduce the load on the network and the resources of the observed systems, as well as reduce the need for external scripts. We are sure that many Zabbix users will like it.
PS The article is also available in English on our blog .