VAX - a tool for visual programming, or how to write SQL with the mouse
I want to talk about the web editor I created for “visual programming” and its history.
We have a department dealing with claims with the Russian Post. Guys are looking for lost / unpaid / undelivered items. The bottom line for developers, this task boiled down to writing a very large number of diverse and huge (> 150 lines) SQL queries in the PostgreSQL dialect, which were VERY often changed and supplemented due to the active emergence of new hypotheses, as well as the arrival of new information about orders.
Naturally, we, as programmers, got tired of this business very quickly, and immediately wanted to offer to
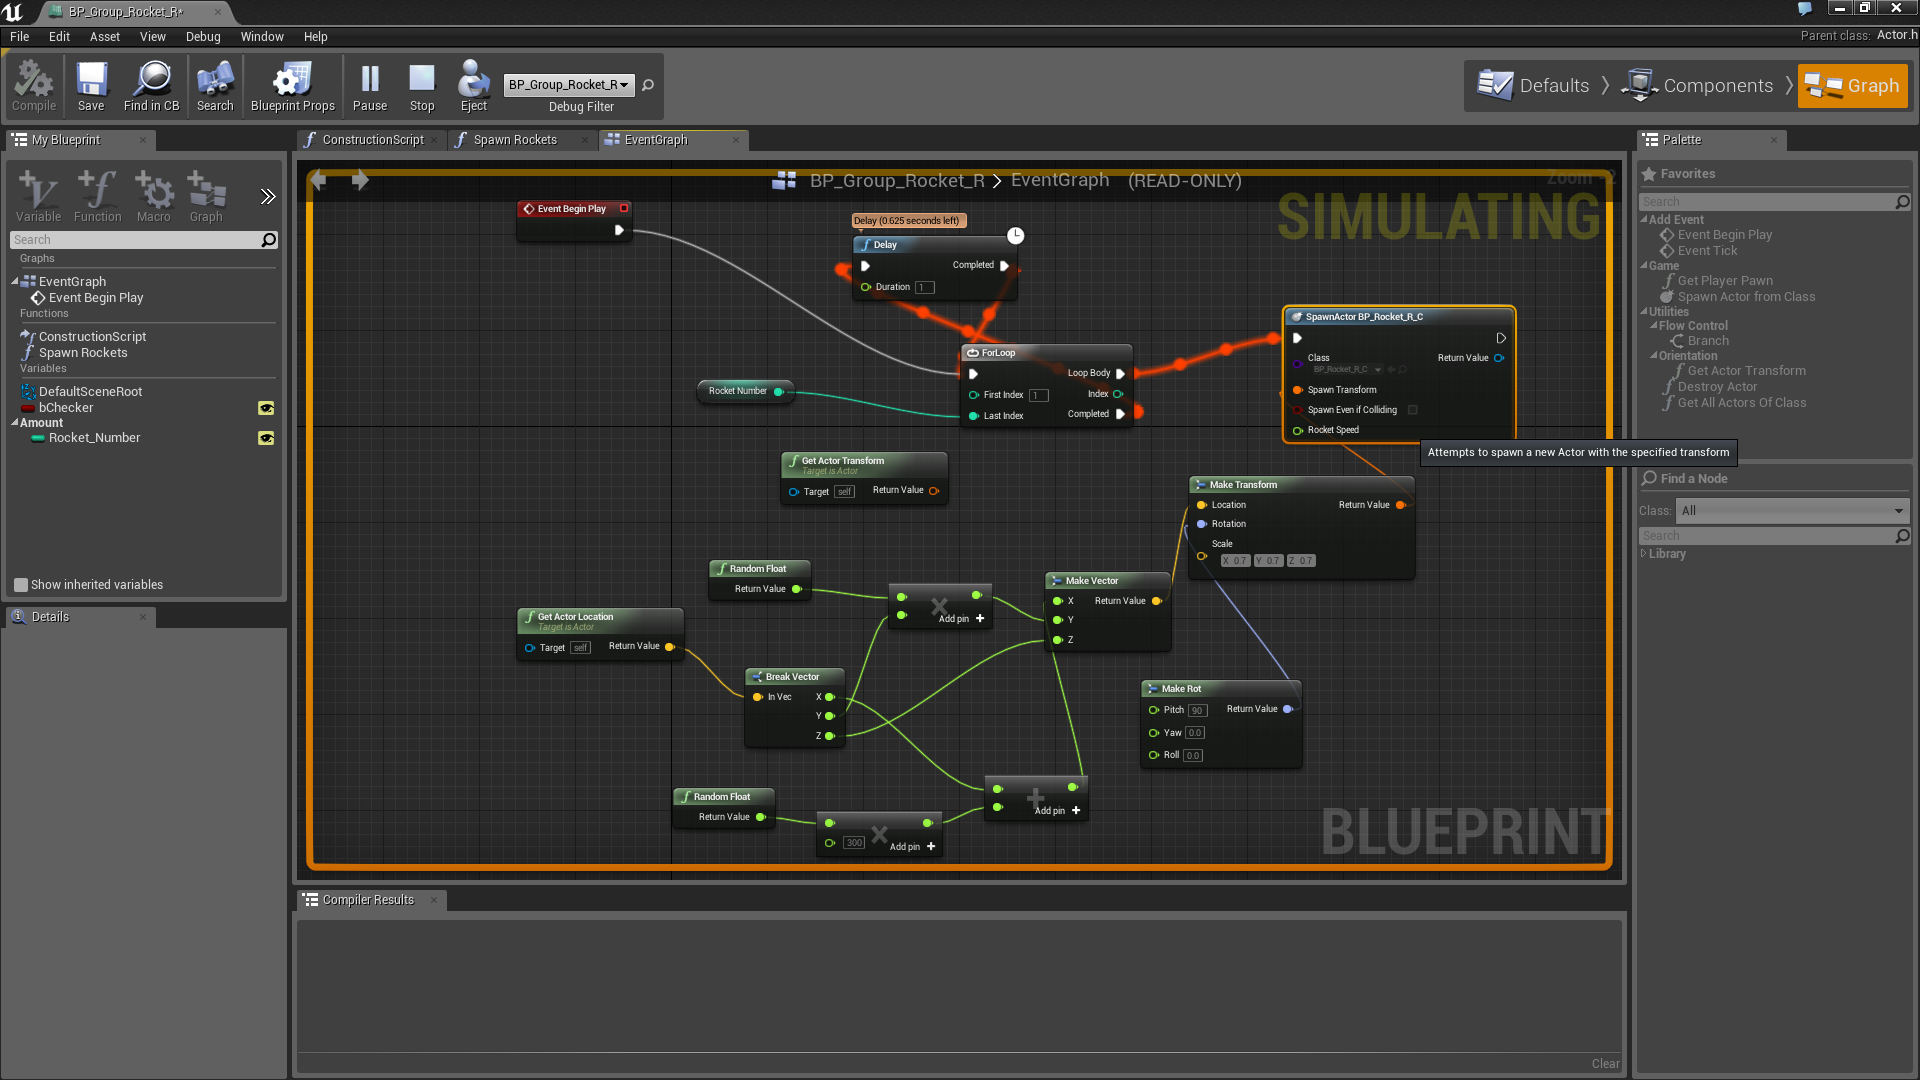
And then, as in the movie “Flash of Genius”, I saw a picture of the visual editor of blueprints from UE4 (Unreal Engine 4), with which the characters launched fireballs at their enemies:
Running into that evening home, I took the first JavaScript library that could draw beautiful rectangles and complex lines - it turned out to be Raphaël from our compatriot DmitryBaranovskiy . After drawing a couple of rectangles and twitching them using library drag-and-drop, I immediately wrote to the author of the library with the question of whether he supports it. And without waiting for an answer (until now), that night I produced more than 1000 lines of JavaScript code, and my dream almost came true before my eyes! But there was still much work to be done.
In the end, what I wanted to do:
- A beautiful and convenient editor on the web that provides tools for manipulating and linking "nodes" of different types, which are described in the domain scheme that is passed to the editor during initialization. Thus, make the editor independent of the subject area.
- The ability to serialize a user’s acyclic graph into a tree structure that is very easy to parse (like JSON) and interpret in any language.
- Provide a convenient format for describing the types and components of the subject area.
- To come up with a rich system of types and restrictions that will help the user to create graphs that are correct from the point of view of the subject area.
- To enable the user to create their own components from combinations of existing ones.
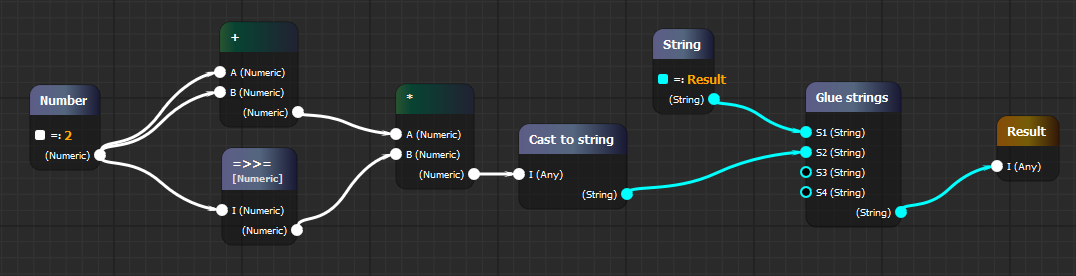
In the end, this is what happened:

It can be seen that the blueprint consists of nodes, which are concrete instances of the components described in the domain schema. The nodes are connected by wires. A wire always goes from the output of one node to the input of another (and vice versa). Many wires can go from one output, but only one can be connected to the input.
All inputs and outputs are of type, and accordingly impose restrictions on possible communications. For example, take the following type system:
types:
    # Всегда есть тип Any, который супер-родитель всех типов
    Scalar:
    Numeric:
       extends: Scalar
    String:
       extends: Scalar
    List:
       typeParams: [A]
Thus, you can associate an output of type Numeric with an input of type Scalar, but not vice versa. For parameterized types like List , covariance is implied, i.e. List [String] can be passed to List [Scalar] , but not vice versa. Plus, there is always a super type Any , which is inherited by all other types.
Nodes can also have attributes that are not configured using wires, and the user himself enters values into them. To do this, there is the concept of valuePickers, with which you can set your own interface for entering attribute values. Out of the box there is just a text input and the ability to choose from a predefined set of constants.
Nodes are also parameterized by type. For example, given a component:
IfThenElse:
  typeParams: [T]
  in:
    C: Boolean
  out:
    onTrue: @T
    onFalse: @T
When creating a node based on the IfThenElse component , the editor will ask us to specify the type T and substitute it in all places with T : The
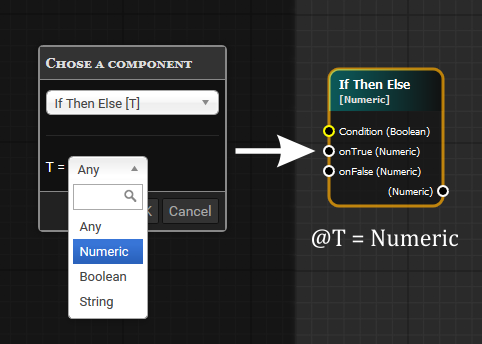
types of inputs and outputs also help the user in the design. If you pull the entries from the output with the Numeric type and release the mouse, the window for creating components filtered out in such a way that only those inputs that are compatible with the Numeric type will remain there will come out . And even automatically postings will be attached.
All this took about a clean three man-weeks, stretched for a good 5-6 months. And six months later, forces appeared to document something and make this known to the world.
So gentlemen, the time has come to create! Let's take the most unrealistic case when you need to give a “non-technical" user the ability to visually program the process of adding numbers. We understand that we only need one type of Numeric and a couple of components: the ability to specify a number ( Literal ) and the ability to add two such numbers ( Plus ). The following is an example of a circuit of this subject area: (all examples of circuits are described in YAML format for clarity, in reality, you will need to transfer native javascript objects):
types:
    # Всегда есть тип Any, который супер-родитель всех типов
    Numeric:
        color: "#fff"
components:
  Literal: # Название компонента
    attrs: # Атрибуты
      V: Numeric
    out: # Исходящие сокеты
      O: Numeric
  Plus:
    in: # Входящие сокеты
      A: Numeric
      B: Numeric
    out:
      O: Numeric
An example of an assembled editor with this scheme and a simple graph can be found here .
Have fun! Press X to create a new item, delete the item by double-clicking. Wire the components, select them all and copy and paste via Ctrl + C and the Ctrl + the V . Then select all Ctrl + A and delete using Delete . After all, you can always make Undo, resorting to Ctrl + Z !
Now suppose our simple user has assembled the following graph:
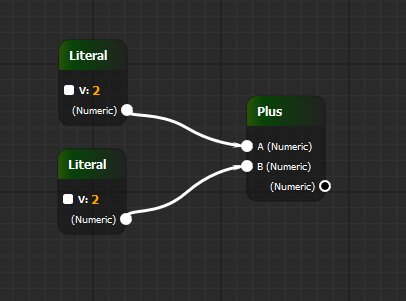
If we ask the editor to save our graph in a tree, we get:
[
  {
    "id": 8,
    "c": "Plus",
    "links": {
      "A": {
        "id": 2,
        "c": "Literal",
        "a": {
          "V": "2"
        },
        "links": {},
        "out": "O"
      },
      "B": {
        "id": 5,
        "c": "Literal",
        "a": {
          "V": "2"
        },
        "links": {},
        "out": "O"
      }
    }
  }
]
As we can see, a tree has come here that is very easy to walk around recursively and get some kind of result. Let's say our backend language is also JavaScript (although it can be any).
We write a trivial code:
function walk(node) {
    switch (node.c) {
        case 'Literal':
            return parseFloat(node.a.V);
        case 'Plus':
            return walk(node.links.A) + walk(node.links.B);
        default:
            throw new Error("Unsupported node component: " + node.component);
    }
}
walk(tree);
If we walk such a function along the above tree, we get 2 + 2 = 4. Voila!
A very nice bonus is the ability of the user to define their "functions" by combining existing components.
For example, even having such a meager domain area where you can simply add numbers, the user can define his component, which will multiply the given number by three:
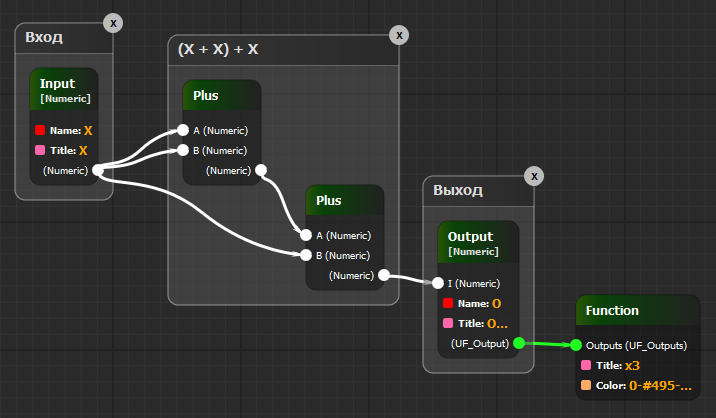
Now we have a custom function x3 :
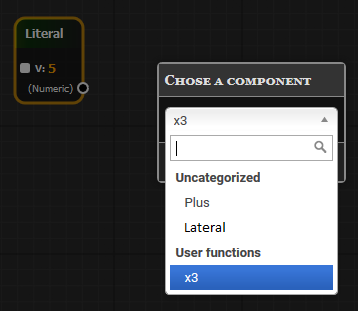
Which can be used as a new component:

At the same time, you can send a tree to the backend where all user-defined functions are inlined, and the developer will not even know that some nodes were part of the user-defined function. It turns out that users themselves can enrich their design language with due imagination and perseverance.
Let us return to our first primitive example of folding numbers. Despite the fact that the processor is an integrated device that only does what it adds up, it will not be very fun to visually program the end user at the level of addition of numbers. We need more expressive and rich designs!
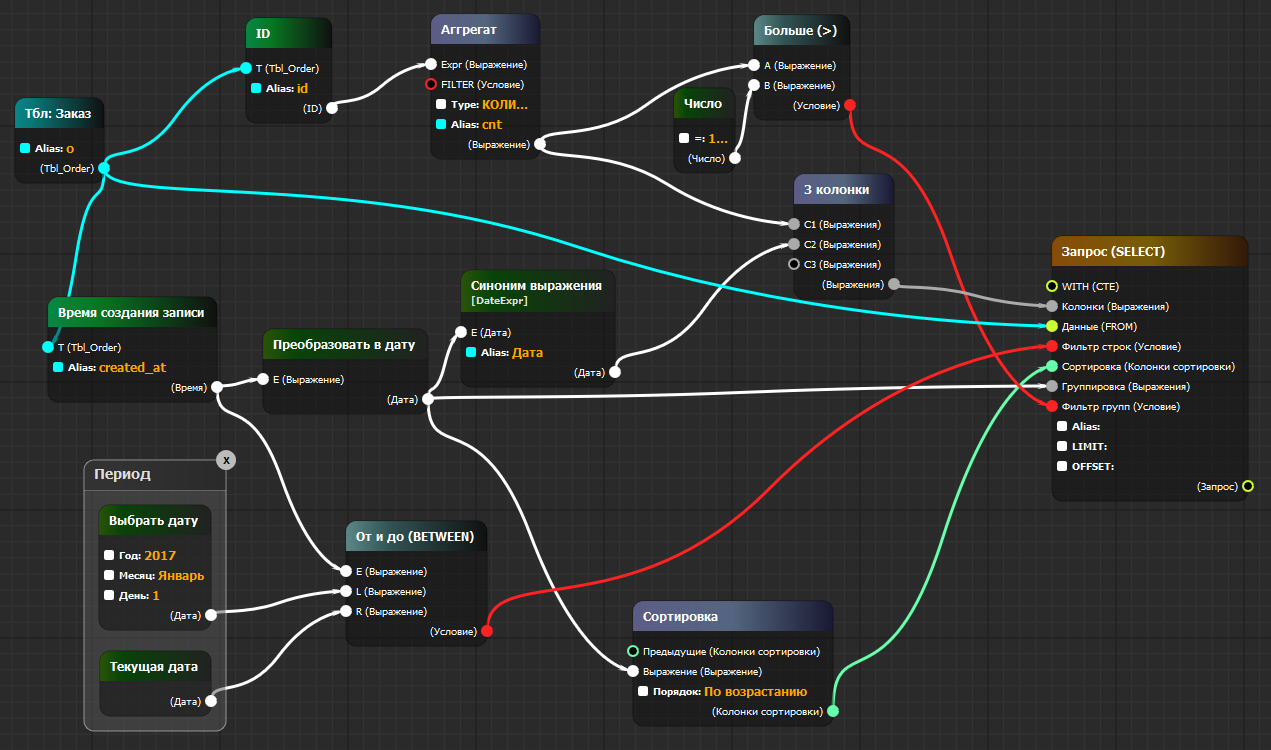
Take for example the wonderful SQL language. If you look closely, then any SQL query is actually very easy to decompose into a tree (this is what the database does first when it receives your query). Having written enough types and components, you can get something even more frightening :
PS If one of the examples does not open ...
Perhaps this is due to the fact that you have already tried to save a user-defined function for one of the schemes. And since by default (but you can and must define your handlers) all user functions are stored in localStorage , a situation may arise when the editor tries to load components or types that are not described in the current scheme.
To do this, simply clear the current localStorage with:
To do this, simply clear the current localStorage with:
localStorage.clear()Unfortunately, the demonstration of turning this graph into real SQL will fail, because she is strongly tied to our project. But in reality, this is going to the following SQL:
SELECT
     COUNT(o.id) AS cnt
   , (o.created_at)::DATE AS "Дата"
FROM tbl_order AS o
WHERE o.created_at BETWEEN '2017-1-1'::DATE AND CURRENT_DATE
GROUP BY (o.created_at)::DATE
HAVING ( COUNT(o.id) ) > ( 100 )
ORDER BY (o.created_at)::DATE ASC
Which is immediately executed and gives the finished report in Excel format. Transferring this SQL to human, we get:
Show the number of loaded orders for each day in chronological order, beginnings from January 1, 2017, throwing out days where less than 100 orders were loaded. Quite a real business report for yourself!
A diagram in JSON format for this example can be found here .
I will not give a full description of the type system and components in the article, for this I send it to the appropriate section of the documentation . But to warm up the interest, I’ll just “throw in” something that you can write like this (highlighting the pretentious YAML syntax a bit):
Plus:
        typeParams: [T]
        typeBounds: {T: {<: Expr}} # Параметризованный тип 'T' ограничен сверху типом 'Expr',
                                   # что означает, что нам надо сюда передать наследник типа 'Expr'
        in:
            A: @T
            B: @T
        out:
            O: @T
It is as if you had declared a function in Scala:
def Plus[T <: Expr](A: T, B: T): T = A + BAs a result, by preparing a sufficient number of components, and come up with a good type system (and writing a
Most importantly, I’m happy to share this tool with the public domain on GitHub under the MIT license.
Who cares, there are ideas / tasks for the further development of the tool:
- More convenient navigation of components in the diagram + their documentation for the user
- Attribute Sockets (as in UE4)
- Ability to define attributes in custom functions.
- Read-only mode for displaying circuits
- Custom-shaped nodes (as in UE4), not just rectangles
- Acceleration and optimization for working with a large number of elements
- Internationalization
- Export pictures to SVG / PNG
- You name it!
It will be cool if someone wants to use this tool in practice and share their experience.
PS It will be even cooler if someone joins the development of the tool!
PPS I made a presentation of the tool in the company using this document .