We are writing a mnemonic editor for the SCADA-system on Fabric.js. Part 2
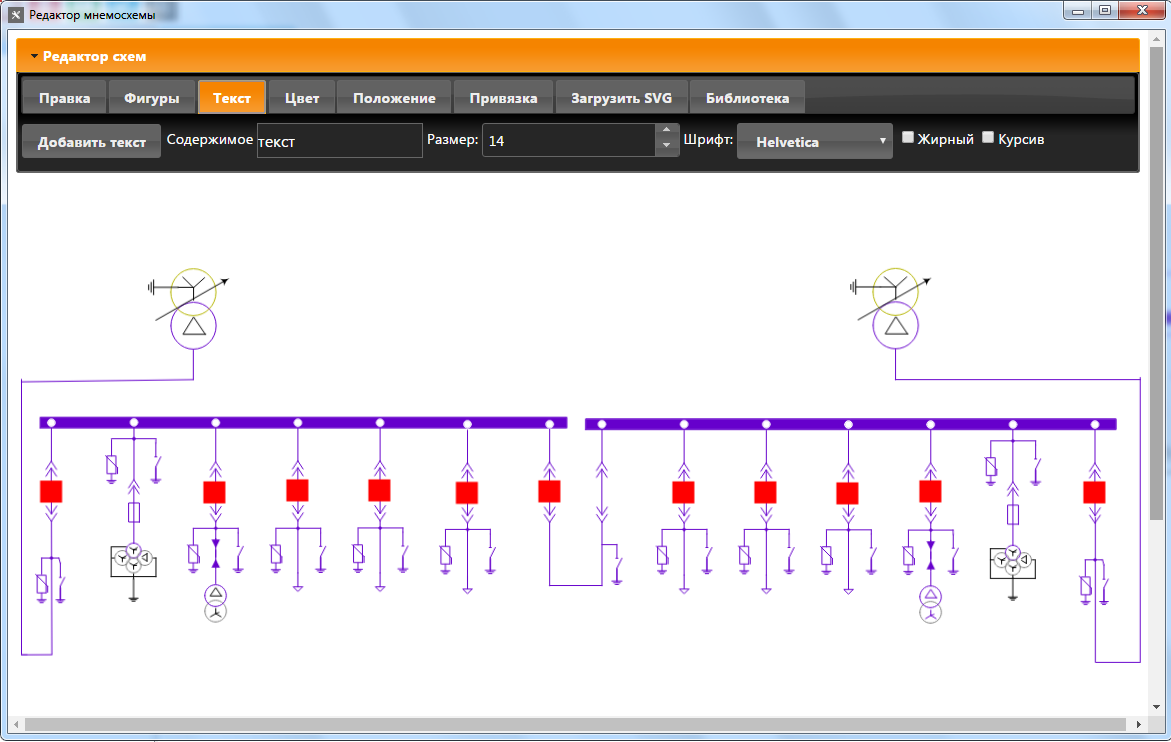
In the last article, we started writing the mnemonic editor. Today is an article about a ready-made editor. Here's what happened:
We stopped at the fact that when loading SVG from a file, it’s ungrouped on elements with the property transform = “translate (XY)”, the indicators for resizing appear in the upper left corner, while the image itself is in X Y coordinates. Bypass this The bug turned out to be not so simple. It was experimentally noticed that if you set the coordinates to 0 0, remembering their transformMatrix before, and then restore them to XY, the pointers for resizing will coincide with the image. And for this, the following function was written:
After loading the document, the canvas did not always contain elements. They appeared on it a little later. I had to do like this:
Now, from the launch in the browser, let's move on to our own editor. We will render HTML pages through the idhttpserver component. For display we will use Chromium, more precisely the DcefBrowser component. Idhttpserver opens port 15500, Chromium opens page 127.0.0.1 : 15500 /. You can, for example, open 127.0.0.1 : 15500 / with any other browser and edit using it. Palming our Chromium to the user, and not forcing him to use his browser, we give him a browser in which java scripts are guaranteed to work as we need.
Index.html through idhttpserver we give a little modified:
Using the methods of
Saving the circuit in SVG:
In the http-server we catch the post-request and save it in SVG
Adding an SVG image to the library. Select several elements, click on the “Add selected to library” button,
where
Copy to operating system clipboard. Select several elements, click on the “copy” button, the following script is executed:
In the http-server we catch the post-request and copy it to the clipboard
Now you can open another diagram and insert SVG into it. To do this, go to the “Download SVG” tab - paste the contents of the clipboard into the text field, click on the “Download” button.
Now let's move on to establishing links between the variable that gets its value from the OPC server and the SVG image.
To bind analog variables, use the text element. It is necessary to create text on the "text" tab. Select it. On the Binding tab, select the variable name. In this case, the text will become
To display a discrete variable, 2 elements must be used. One will be used to display the enabled state, the other for the disabled state. Those. when an element is on, an element will be displayed showing the on state. An item that displays a disabled state will be invisible.
To bind an element that displays the included state, select it, select it in the drop-down list
Now about drawing. Many image editors allow you to save in SVG format. So far I am using the following scheme.
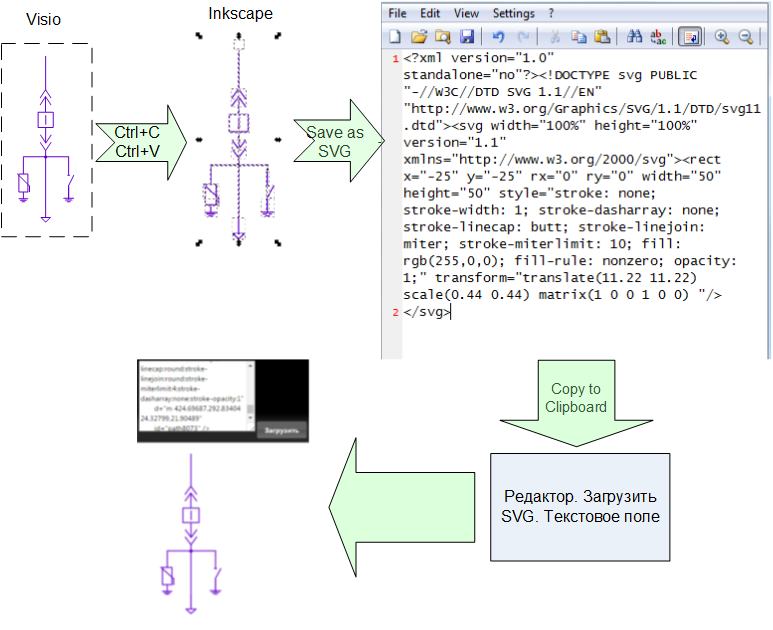
I open the existing scheme in Visio, copy it to Inkscape, save it in SVG, open it in notepad, copy, paste it in the editor through the “Download SVG” tab - text field - “download” button.
You have to copy from Visio to Inkscape, because Visio creates an SVG that FabricJS cannot render normally.
You can watch the editor online without the possibility of saving here .
Download the prototype SCADA-system with the editor here .
And in the next article we will revive the drawn diagram.
We stopped at the fact that when loading SVG from a file, it’s ungrouped on elements with the property transform = “translate (XY)”, the indicators for resizing appear in the upper left corner, while the image itself is in X Y coordinates. Bypass this The bug turned out to be not so simple. It was experimentally noticed that if you set the coordinates to 0 0, remembering their transformMatrix before, and then restore them to XY, the pointers for resizing will coincide with the image. And for this, the following function was written:
We move the pointers to resize where necessary
function After_load() {
var kol = 0;
canvas.forEachObject(function(obj){
var transformMatrix1 = [1,0,0,1,0,0];
var str_x;
var str_y;
var tr_y;
var tx_sg = obj.toSVG();
if ((tx_sg.indexOf('transform="translate')>=0) && (tx_sg.indexOf('=0))
{
obj.setOriginX('left');
obj.set('lockScalingX','false');
obj.set('lockScalingY','false');
}
var transformMatrix2 = obj.get('transformMatrix');
var strokeWidth1 = obj.getStrokeWidth();
var m_x = obj.getLeft();
var m_y = obj.getTop();
var calcTransformMatrix2 = obj.calcTransformMatrix();
transformMatrix1[1] = transformMatrix2[1];
transformMatrix1[2] = transformMatrix2[2];
if (!((tx_sg.indexOf('transform="translate')>=0) && (tx_sg.indexOf('=0)))
{
obj.setTransformMatrix(transformMatrix1);
}
obj.setTop(transformMatrix2[5]+m_y*transformMatrix2[3]);*/
if (tx_sg.indexOf('=0){
obj.setLeft(transformMatrix2[4]+(m_x)*transformMatrix2[0]-(strokeWidth1/2)*transformMatrix2[0]);//(m_x-0.5)*transformMatrix2[0]
obj.setTop(transformMatrix2[5]+(m_y)*transformMatrix2[3]-(strokeWidth1/2)*transformMatrix2[3]); //(m_y-0.5)*transformMatrix2[3]
}
else
if ((tx_sg.indexOf('=0) || (tx_sg.indexOf('=0) || (tx_sg.indexOf('=0) && (tx_sg.indexOf('=0))//if (tx_sg.indexOf('");
var poz1 = tx_sg.indexOf("0) && (poz1>0))
{
var poz3 = tx_sg.indexOf(">",poz1+1);
if (poz3>0){
var str = tx_sg.substring(poz3+1,poz2);
}
}// if ((poz2>0) && (poz1>0))
tx_sg = obj.toSVG();
poz2 = tx_sg.indexOf(" ");
poz1 = tx_sg.indexOf("0) && (poz1>0))
{
var poz3 = tx_sg.indexOf('x="',poz1+1);
if (poz3>0){
var poz4 = tx_sg.indexOf('"',poz3+4);
str_x = tx_sg.substring(poz3+3,poz4);
}
poz3 = tx_sg.indexOf('y="',poz1+1);
if (poz3>0){
var poz4 = tx_sg.indexOf('"',poz3+4);
str_y = tx_sg.substring(poz3+3,poz4);
}
}// if ((poz2>0) && (poz1>0))
poz1 = tx_sg.indexOf('transform="translate(');
if (poz1>0)
{
poz2 = tx_sg.indexOf(" ",poz1+21);
var poz3 = tx_sg.indexOf(')',poz2+1);
tr_y = tx_sg.substring(poz2,poz3);
}
m_x = obj.getLeft();
m_y = obj.getTop();
transformMatrix2 = obj.get('transformMatrix');
obj.setTransformMatrix(transformMatrix1);
obj.setTop(transformMatrix2[5]-parseFloat(tr_y)-parseFloat(str_y)-strokeWidth1*0.58);
obj.setLeft(transformMatrix2[4] + parseFloat(str_x) - (strokeWidth1/2) );
}
else
{
obj.setLeft(transformMatrix2[4]+(m_x)*transformMatrix2[0]-(strokeWidth1/2)*transformMatrix2[0]);//(m_x-0.5)*transformMatrix2[0]
obj.setTop(transformMatrix2[5]+(m_y)*transformMatrix2[3]-(strokeWidth1/2)*transformMatrix2[3]); //(m_y-0.5)*transformMatrix2[3]
}
obj.setScaleX(transformMatrix2[0]);
obj.setScaleY(transformMatrix2[3]);
obj.set('transparentCorners','true');
obj.setCoords();
kol = kol + 1;
});
if (kol === 0)
{
$.post("After_load", kol);
}
else
{
Is_After_load = true;
}
};
After loading the document, the canvas did not always contain elements. They appeared on it a little later. I had to do like this:
Call this function 5 seconds after the page loads.
setTimeout(function() {
  if (!Is_After_load){
   After_load();
  }
}, 5000);
Now, from the launch in the browser, let's move on to our own editor. We will render HTML pages through the idhttpserver component. For display we will use Chromium, more precisely the DcefBrowser component. Idhttpserver opens port 15500, Chromium opens page 127.0.0.1 : 15500 /. You can, for example, open 127.0.0.1 : 15500 / with any other browser and edit using it. Palming our Chromium to the user, and not forcing him to use his browser, we give him a browser in which java scripts are guaranteed to work as we need.
Index.html through idhttpserver we give a little modified:
- Canvas becomes the size specified by the user in the settings.
- The SVG file that the user is currently editing is loading.
- User SVG files from the image library are loaded.
- The list of variables received from OPC servers is filled.
Using the methods of
$.postand toSVG you can do the following things: Saving the circuit in SVG:
function Post_sheme() {
$.post("save.php", canvas.toSVG());
};
In the http-server we catch the post-request and save it in SVG
ARequestInfo.UnparsedParams. Adding an SVG image to the library. Select several elements, click on the “Add selected to library” button,
$.post("new.php?"+$("input[name=namenewsvg]").val(), Buff_clipb);where
$("input[name=namenewsvg]").val() is the name of the SVG image. Copy to operating system clipboard. Select several elements, click on the “copy” button, the following script is executed:
Spoiler heading
var tx = canvas.getActiveGroup().toSVG();
tx = '';
$.post("copy.php", tx);
In the http-server we catch the post-request and copy it to the clipboard
Clipboard.AsText := ARequestInfo.UnparsedParams;Now you can open another diagram and insert SVG into it. To do this, go to the “Download SVG” tab - paste the contents of the clipboard into the text field, click on the “Download” button.
Now let's move on to establishing links between the variable that gets its value from the OPC server and the SVG image.
To bind analog variables, use the text element. It is necessary to create text on the "text" tab. Select it. On the Binding tab, select the variable name. In this case, the text will become
{{val.Имя_переменной}}. Those. text binding is carried out through the content text.To display a discrete variable, 2 elements must be used. One will be used to display the enabled state, the other for the disabled state. Those. when an element is on, an element will be displayed showing the on state. An item that displays a disabled state will be invisible.
To bind an element that displays the included state, select it, select it in the drop-down list
Имя_переменной_on. To bind an element that displays a disabled state, select it, select it in the drop-down list Имя_переменной_off. Use the arrows on the keyboard to move the elements so that one is under the other.Binding of discrete variables is done through id.
function setIDObj() {
     var activeObject = canvas.getActiveObject();
     if (activeObject) {
    activeObject.set({
     id : $("input[name=nameobj]").val()
     });
     var tx_sg = activeObject.toSVG();
     var poz2 = tx_sg.indexOf("");
     var poz1 = tx_sg.indexOf("0) && (poz1>0))
   {
    var ttx = $("input[name=nameobj]").val();
    if (ttx.indexOf("{{")<=0)
    {
      ttx = "{{val."+ttx+"}}";
    }
     activeObject.set({
        text: ttx
   });
    canvas.renderAll();
   }
   }
  };
Now about drawing. Many image editors allow you to save in SVG format. So far I am using the following scheme.
I open the existing scheme in Visio, copy it to Inkscape, save it in SVG, open it in notepad, copy, paste it in the editor through the “Download SVG” tab - text field - “download” button.
You have to copy from Visio to Inkscape, because Visio creates an SVG that FabricJS cannot render normally.
You can watch the editor online without the possibility of saving here .
Download the prototype SCADA-system with the editor here .
And in the next article we will revive the drawn diagram.